
Making BAT Light Curves
1. Overview:
This thread describes how to make a light curve from BAT event data using the 'batbinevt' task.
Read this thread if you want to: Make a background-subtracted light curve from BAT data.
Last update: 2007-07-17
2. Prerequisites
BAT event data (in obsid/bat/event/swNNNNNNNNNNNbevshsp_uf.evt.gz);
BAT quality map (in obsid/bat/hk/swNNNNNNNNNNNbcbdq.hk.gz).
We will use the original event list of GRB 050713A as an example (obsid 00145675 000). The event data should have been ray-traced by the SDC using the position of the GRB. Energy calibrations should also have been applied. See the Mask-Weighting and Energy Correction threads for more information.
3. Change into Event Directory
Change directories to the location of the event data.
cd 00145675000/bat/event
4. Make the light curve
BAT light curves are made with the 'batbinevt' task. Here is an example:
batbinevt infile=sw00145675000bevshsp_uf.evt.gz outfile=onesec.lc outtype=LC \
  timedel=1.0 timebinalg=u energybins=15-150 \
  detmask=../hk/sw00145675000bcbdq.hk.gz clobber=YES
the infile is the input events file
the outifle is the output light curve
the outtype=LC means make a "light curve"
the timedel=1.0 means make 1 second time bins
the timebinalg=u means make them uniform bins (instead of variable sized bins)
the energybins=15-150 means make a 1-channel light curve from 15-150 keV
the detmask is required to filter out noisy detectors
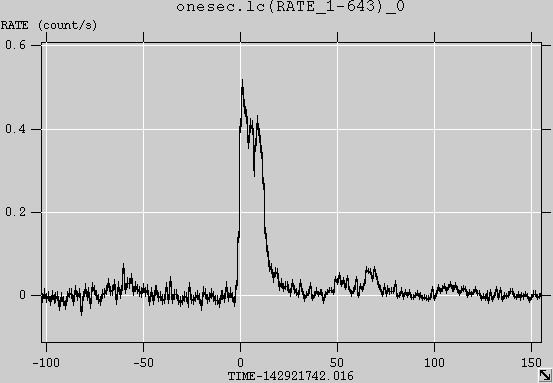
5. Plot the Light Curve
You can plot the light curve with 'fplot' or 'fv'. Example:
      fplot onesec.lc offset=yes
         X column = TIME
         Y column = RATE[ERROR]
you will have to adjust the X range to see the burst since there are large amounts of extraneous data included by the SDC. For example: r x -100 3000 zooms on the first 3000 seconds
If the trigger time (TRIGTIME) keyword is present in the light curve file, then it is convenient to plot the light curve after subtracting this time as an offset. It is easiest to do this with the 'fv' task. Run 'fv' on the light curve file and select 'Plot'. For the X value, type TIME - TRIGTIME and the trigger time will be placed at the origin of the plot.
6. Changing the Energy Binning
You can choose different energy bins using the 'energybins' parameter to the task. Give any energy range ELOW to EHIGH as "ELOW-EHIGH". Be sure to use an energy range appropriate to the BAT (within 14-200 keV).
An easy way to make light-curves in multiple bands is to re-run the task with different energy ranges. For example, if you want to make light curves in the 15-50 and 50-150 keV bands, you can run the task twice:
   batbinevt ... energybins=15-50 ...

   batbinevt ... energybins=50-150 ...
This will produce two light curve files, each with the different energy ranges.
Another way to make multi-channel light curves is to specify both energybins in one command. In the example above of two bands (15-50 and 50-150 keV), the command would be:
batbinevt ... energybins=15-50,50-150 ...
This will produce one light curve file with a vector RATE column. You can plot these within 'fv' using RATE[1] and RATE[2] as the Y column names.
7. Changing the time binning
The task 'batbinevt' has several options for time binning of light curves.
uniform time binning (timebinalg='u') - you choose the time bin size with the timedel parameter, or set it to zero to sum all the data into one bin;
constant signal to noise (timebinalg='s') - the time bin size is variable and determined by the signal to noise ratio of the data (using the snrthresh parameter);
user-specified binning (timebinalg='g') - you explicitly set the time bin edges using the gtifile parameter.
The user-specified binning gives you the freedom to choose precisely the time bin edges that you wish (expressed in mission elapsed time). You specify these bin edges with a good time interval file (GTI file). The task 'battblocks' can produce a set of "interesting" time bins automatically using the Bayesian block algorithm. You can also construct a GTI file by hand (see below).
8. Optional: Making a GTI file
This example shows how to make a GTI file with user-specified time bins. We will assume the time bins of interest are already known relative to the trigger time. The goal will be to make a GTI file with absolute mission elapsed times.
For example, enter the time bin edges in the text file gti.txt. These are in seconds relative to the trigger time. Of course you can choose any relative times that you wish.
# START STOP
-500   -400
-400   -300
-300   -250
-250   -200
-200   -150
-150   -100
-100    -75
 -75    -50
 -50    -40
 -40    -30
 -30    -20
 -20    -10
 -10      0
   0     10
  10     20
  20     30
  30     40
  40     50
  50     75
  75    100
 100    150
 150    200
 200    250
 250    300
 300    400
 400    500
Describe the good time interval column names in the file gti.col.
START 1D s
STOP 1D s
Enter required keywords into the file gti.head
MJDREFI = 51910          / Swift reference epoch: days
MJDREFF = 0.00074287037  / Swift reference epoch: fractional days
TIMEZERO = 0.0           / Time offset value
TRIGTIME = 142921742.016 / Trigger time: ** Change for your burst! **
And create the relative time good time interval.
ftcreate gti.col gti.txt offset.gti headfile=gti.head extname=GTI
Finally, add the trigger mission elapsed time (TRIGTIME=142921742.016 for this particular GRB) to make an absolute-time good time interval file.
ftcopy offset.gti'[1][col START=START+TRIGTIME;STOP=STOP+TRIGTIME]' absolute.gti
You can use this good time interval file to extract the light curve values in your desired time bin ranges:
batbinevt infile=sw00145675000bevshsp_uf.evt.gz outfile=mybins.lc outtype=LC \
  timedel=1.0 timebinalg=g energybins=15-150 gtifile=absolute.gti \
  detmask=../hk/sw00145675000bcbdq.hk.gz clobber=YES
9. Modifications
2005-12-04 - first revision
2006-04-12 - formatting changes
2006-09-08 - mention cleaned event lists
2006-10-31 - clarify creation of custom GTI
2007-01-25 - remove mention of cleaned event lists (no longer needed)
2007-07-17 - fix typo in fplot command

- Curator: J.D. Myers
- NASA Official & Swift PI: Brad Cenko
- PAO Contact: Francis Reddy
- Questions/Comments/Feedback
- › Privacy Policy and Important Notices
- › Accessibility
- › Contact NASA
- › Page Last Updated: Tue, Mar 20, 2012