
Swift Response Matrices
1. File downloads
Ancilliary Response Files (ARFs) and Response Matrix Files (RMFs) are available for download from the HEASARC Calibration Database (caldb) for all three instruments (Table 1.1). These are XSPEC compatible files which can be used for data simulation. In some cases ARFs and RMFs are supplemented, or in the cases of BAT and UVOT, replaced by RSP files. These are response files that have been normalized to their appropriate effective areas. As such RSP files should be used in XSPEC without ARFs.
Table 1.1: ARF, RMF and RSP calibration file downloads for the BAT, XRT and UVOT.
| Instrument | Mode/Grades/Filter | Files |
|---|---|---|
| BAT | N/A | bat.rsp |
| XRT | Windowed Timing grade 0-2 | swxs6_20010101v001.arf, swxwt0to2s6_20131212v015.rmf |
| Photon counting grade 0-12 | swxs6_20010101v001.arf, swxpc0to12s6_20130101v014.rmf | |
| UVOT | UV Grism | ugrism.rsp |
| Optical Grism | vgrism.rsp | |
| White | swuwh_20041120v105.rsp | |
| U | swuuu_20041120v105.rsp | |
| B | swubb_20041120v105.rsp | |
| V | swuvv_20041120v105.rsp | |
| UVW1 | swuw1_20041120v106.rsp | |
| UVM2 | swum2_20041120v106.rsp | |
| UVW2 | swuw2_20041120v106.rsp |
A detailed description of the RMF & ARF file formats is available. Notes for each instrument are provided below.
Two sets of files are provided for the XRT, one suitable for spectra extracted from Windowed Timing mode grade 0-2 and one from Photon Couting mode grade 0-12.
RSP files for each UVOT filter are provided except the magnifier. The two grism filters provide spectrally resolved data and should be treated similarly to the XRT and BAT spectral data. The broad band filters yield a scalar number per observation, and so, since all spectral models require more than one free parameter, one or more additional response files must used in conjunction with a broad band response in order to fit data with it.
Swift users with science backgrounds in optical astronomy may need some preliminary orientation in high energy data reduction techniques to make full use of the UV and optical data. In order to analyze UVOT data simultaneously with BAT and XRT data, fully-consistent external calibration files are provided for use with the standard HEASARC high energy software.
Example XSPEC sessions for the simulation of Swift data are also provided.
2. BAT
The BAT response matrix was generated from flight data for the on-axis response with all 32768 detectors enabled. In reality, gamma-ray bursts will be detected off-axis, and with fewer detectors, so the "typical" matrix represents the ideal case. The BAT effective area curve is displayed in Figure 2.1.
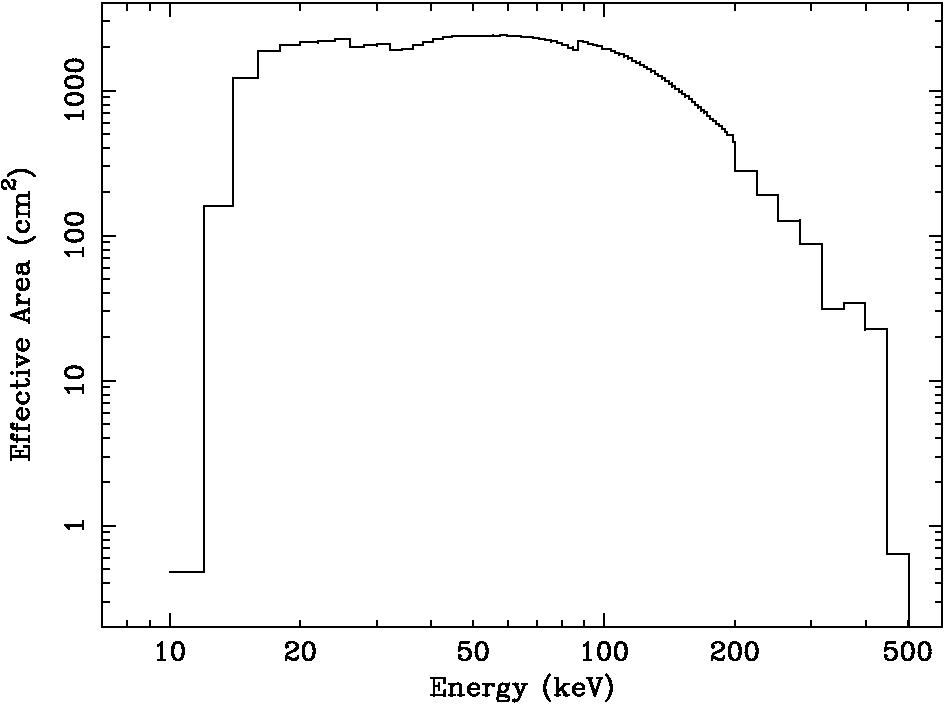
Figure 2.1: BAT effective area.
BAT spectra should be simulated as described in the fhelp file for batphasimerr. Batphasimerr is distributed with the Swift software.
Table 2.1 describes the FWHM spectral resolution of the BAT. This quantity was derived by fitting a Gaussian to model emission lines of negligible intrinsic width. The shape of the cutoff at energies greater than 100 keV prevent a meaningful measure of the FWHM above 80 keV using a Guassian model.
Table 2.1: Comparison of the FWHM spectral resolution of the BAT as a function of +energy.
| E = 20 keV | E = 50 keV | E = 80 keV |
|---|---|---|
| 4.5 | 5.3 | 1.9 |
3. XRT
The Swift XRT is designed to operate autonomously and aquires data in three spectroscopic modes depending on the source intensity:- Photodiode mode (PD) - a fast timing mode (time resolution 0.14ms) with no spatial information
- Windowed Timing mode (WT) - another fast timing mode (time resolution 1.8ms) with 1D position information
- Photon Counting mode (PC) - full 2D imaging and spectroscopy is performed with a time resolution of 2.5s
The XRT effective area is determined by three main components: the mirror area, the filter transmission and the CCD quantum efficiency (QE). The ancilliary response (ARF) files contain the mirror area (which was initially created by a ray-tracing code) and the filter transmission (which is identical to the XMM-MOS medium filter), as well as any corrections for vignetting and point spread function losses. The CCD QE is accounted for by the Redistribution Matrix Files (RMFs) and depends on the operating mode and choice of grades selected.
The RMFs were created by a Monte-Carlo simulation code which models the physical interaction of an X-ray in the CCD and the appropriate readout mode (Osborne et al. 2005, SPIE, 5898, 340; Godet et al. 2007, SPIE, submitted). The standard grades which maximize the QE are grade 0-2 for WT mode and grade 0-12 for PC mode (see Burrows et al., 2005, Space Science Review, 120, 165 for a description of the grade definitions). Using in-orbit calibration observations, corrections were made to the ARF files to remove residuals around the gold edges (2.2-3.0 keV), near the oxygen edge (0.54 keV) and the silicon edge (1.84 keV). (see Campana et al.).
The Swift XRT RMFs and ARFs provided here for simulation purposes are appropriate for WT mode grade 0-2 and PC mode grade 0-12. The figure below compares their effective areas.
Figure 3.1: XRT Effective area curves for WT mode grade 0-2 and PC mode grade 0-12.
Caveats when using the RMFs
The XRT CCD spectral resolution has degraded since launch due to the expected increase in the charge transfer inefficiency (CTI) with time. The RMFs provided here were created using CTI values from 2006 September. Additionally, we have evidence that charge traps are forming on the CCD which further degrades the spectral resolution. As figure 3.2 below shows, the spectra resolution has continued to degrade and therefore the RMFs provided here will underpredict the intrinsic width of spectral line features. The internal calibration source data shows that the PC mode FWHM at 5.895 keV has increased from 145 eV at launch (2004 December) to 210 eV by 2007 September.
Figure 3.2: The Swift XRT WT mode spectrum of Cas A SNR at 3 epochs showing degredation in the energy resolution at the Si-Ka and S-Ka lines.
In order to decrease the electronic noise within the detector and improve its operating performance, the CCD substrate voltage was increased from 0V to 6V in 2007 September. The calibration files are currently being refined by the XRT team to account for this change but observers should be aware that, as a consequence, the QE will decrease by ~10 percent at high energies ( 5 keV).
4. UVOT
Reponse matrices for the UVOT filters and grisms have been generated using flight data. The grism response matrices are for the nominal mode only.Effective areas of the filters (fig. 4.1) have been generated by scaling the manufacturer's specifications to the observed fluxes measured on orbit (see Poole et al. 2007, astro-ph 0708.2259). The grism effective areas (fig 4.2) are based on observed calibration spectra.
Figure 4.1: UVOT broad band filter effective areas.
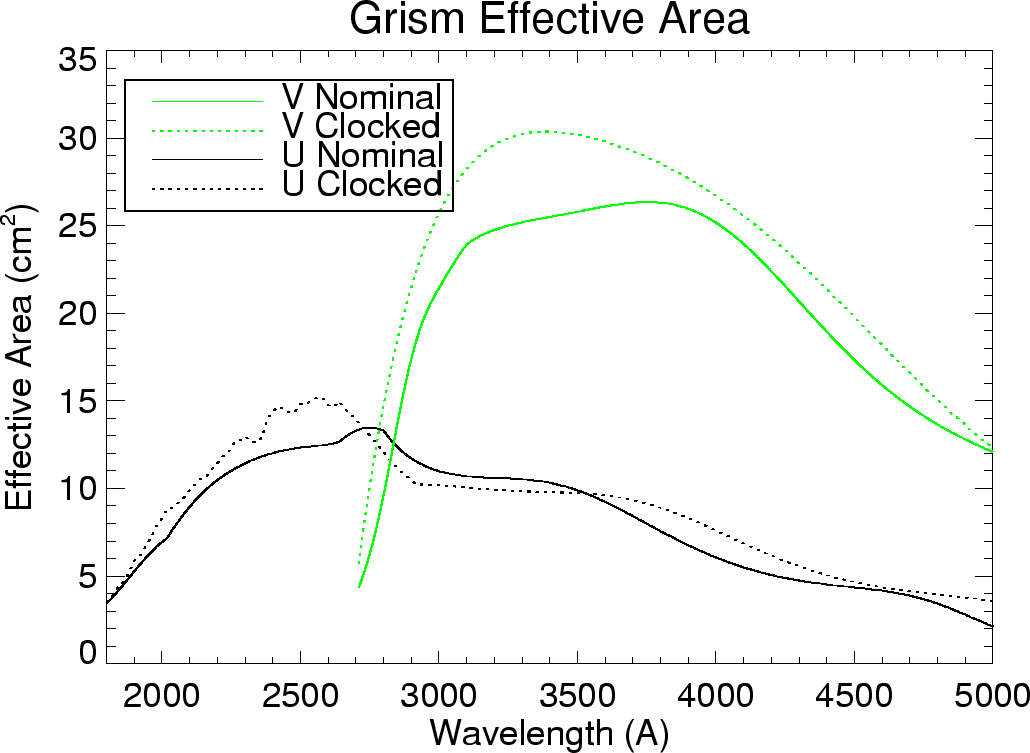
Figure 4.2: UVOT optical (VGRISM) and UV (UGRISM) grism effective areas.

- Curator: J.D. Myers
- NASA Official & Swift PI: Brad Cenko
- PAO Contact: Francis Reddy
- Questions/Comments/Feedback
- › Privacy Policy and Important Notices
- › Accessibility
- › Contact NASA
- › Page Last Updated: Fri, Mar 31, 2023