Table of current XRT observations of [PFH2005] 622
---------------------------------------------------------------------------------------------------------
Observation Time | Exposure time | Number of | Expected | Source count rate
| (s) | Detected photon | Background Count | (ct/s)
---------------------------------------------------------------------------------------------------------
Epoch 1 | | | |
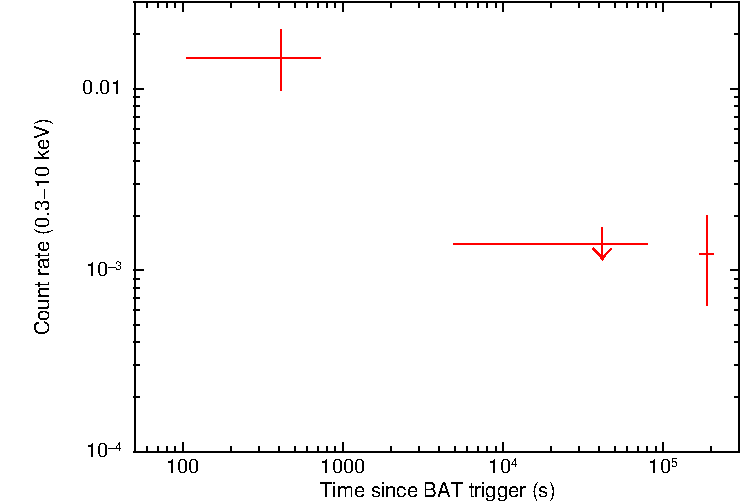
(T0+107s to T0+720s) | 614 | 8 in 21 arcsec | 0.34 | 1.48(+0.6,-0.5)x10^-2
----------------------------------------------------------------------------------------------------------
Epoch 2 | | | |
(T0+4ks to T0+80ks) | 7200 | 3 in 21 arcsec | 1.25 | ≺ 0.002
----------------------------------------------------------------------------------------------------------
Epoch 3 | | | |
(T0+171ks to T0+206ks) | 4829 | 5 in 21 arcsec | 0.64 | 1.20(+0.8,-0.6)x10^-3
----------------------------------------------------------------------------------------------------------
* T0 refers to the BAT trigger time
* All measurements use a source radius of 9 pixels (21 arcseconds),
a background measurement from an annulus around the source region, and
the Bayesian method of Kraft, Burrows, and Nousek (1991, ApJ, 374, 344) to obtain
the 1-sigma confidence intervals (for detections) or 3-sigma upper limits (for non-detections).
Light Curve from XRT observations