Analysis Summary
Notes:
- 1) No attempt has been made to eliminate the non-significant decimal places.
- 2) This batgrbproduct analysis is done using the HEASARC data.
- 3) This batgrbproduct analysis is using the flight position for the mask-weighting calculation.
==========================================================================
BAT GRB DATA PROCESSING REPORT
Process Script Ver: batgrbproduct v2.46
Process Start Time: Tue Jun 30 12:22:48 EDT 2015
Host Name: bat1
Current Working Dir: /local/data/bat1/alien/Swift_3rdBATcatalog/event/batevent_reproc/trigger100368
======================================================================
Trigger: 00100368 Segment: 000
BAT Trigger Time: 125163527.319
UTC: 2004-12-19T15:38:48 [includes UTCF correction]
Where From?: GCN 2883
Refined Position: [ source = BAT pre-slew image ]
RA: 167.688825414 Dec: -33.4616679293 [deg; J2000]
{ 11h 10m 45.3s , -33d -27' -42.0" }
+/- 2.02696067777 [arcmin] (estimated 90% radius based on SNR)
SNR: 11.0872728498
Angular difference between the analysis and refined position is Usage: arcmin
Partial Coding Fraction: 0.7734375 [ including projection effects ]
Duration
T90: 9.85600000619888 +/- 18.6919447976637
Measured from: 18.624
to: 28.48 [s; relative to TRIGTIME]
T50: 5.95200000703335 +/- 1.13227558091422
Measured from: 20.8
to: 26.752 [s; relative to TRIGTIME]
====== Table of the duration information =============================
Value tstart tstop
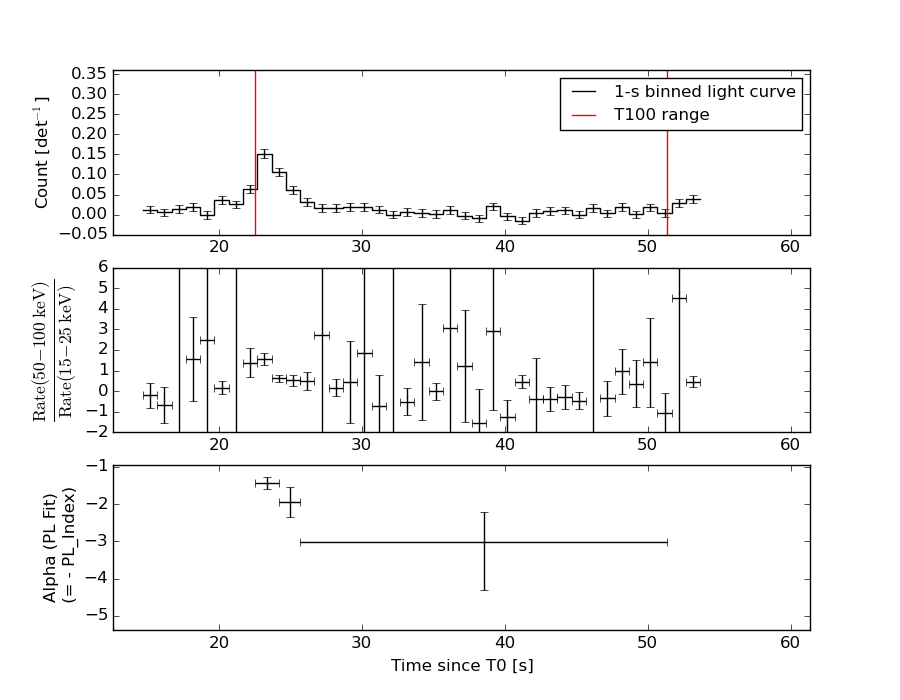
T100 28.800 22.553 51.353
T90 9.856 41.177 51.033
T50 5.952 43.353 49.305
Peak 1.000 22.853 23.853
====== Spectral Analysis Summary =====================================
Model : spectral model: simple power-law (PL) and cutoff power-law (CPL)
Ph_index : photon index: E^{Ph_index}
Ph_90err : 90% error of the photon index
Epeak : Epeak in keV
Epeak_90err: 90% error of Epeak
Norm : normalization at 50 keV in both the PL model and CPL model
Nomr_90err : 90% error of the normalization
chi2 : Chi-Squared
dof : degree of freedo
=== Time-averaged spectral analysis ===
(Best model with acceptable fit: PL)
Model Ph_index Ph_90err_low Ph_90err_hi Epeak Epeak_90err_low Epeak_90err_hi Norm Nomr_90err_low Norm_90err_hi chi2 dof
PL -2.028 -0.326 0.295 - - - 1.05e-03 -2.23e-04 2.12e-04 43.420 57
CPL -2.166 -0.339 1.028 72.193 N/A N/A 8.67e-04 N/A N/A 43.170 56
=== 1-s peak spectral analysis ===
(Best model with acceptable fit: PL)
Model Ph_index Ph_90err_low Ph_90err_hi Epeak Epeak_90err_low Epeak_90err_hi Norm Nomr_90err_low Norm_90err_hi chi2 dof
PL -1.341 -0.172 0.172 - - - 1.14e-02 -1.18e-03 1.17e-03 64.890 57
CPL -0.634 -0.697 0.841 101.986 -30.538 972.454 2.50e-02 -1.33e-02 3.67e-02 61.880 56
=== Fluence/Peak Flux Summary ===
Model Band1 Band2 Band3 Band4 Band5 Total
15-25 25-50 50-100 100-350 15-150 15-350 keV
Fluence PL 6.36e-08 8.49e-08 8.32e-08 1.46e-07 2.80e-07 3.78e-07 erg/cm2
90%_error_low -1.31e-08 -1.31e-08 -2.36e-08 -6.84e-08 -5.30e-08 -9.84e-08 erg/cm2
90%_error_hi 1.35e-08 1.29e-08 2.44e-08 9.99e-08 5.49e-08 1.23e-07 erg/cm2
Peak flux PL 4.03e-01 4.45e-01 3.52e-01 4.58e-01 1.37e+00 1.66e+00 ph/cm2/s
90%_error_low -7.09e-02 -5.04e-02 -4.39e-02 -1.08e-01 -1.42e-01 -1.76e-01 ph/cm2/s
90%_error_hi 7.46e-02 4.99e-02 4.35e-02 1.26e-01 1.43e-01 1.77e-01 ph/cm2/s
Fluence CPL 6.19e-08 8.09e-08 7.74e-08 1.63e-07 2.62e-07 3.86e-07 erg/cm2
90%_error_low -1.53e-08 N/A -6.15e-08 -8.14e-08 N/A -2.47e-07 erg/cm2
90%_error_hi 1.48e-08 N/A 1.62e-08 5.62e-08 N/A 9.72e-08 erg/cm2
Peak flux CPL 3.48e-01 4.71e-01 3.77e-01 2.33e-01 1.33e+00 1.43e+00 ph/cm2/s
90%_error_low -8.79e-02 -5.81e-02 -5.16e-02 -1.11e-01 -1.48e-01 -1.93e-01 ph/cm2/s
90%_error_hi 9.11e-02 5.99e-02 5.30e-02 2.28e-01 1.48e-01 2.58e-01 ph/cm2/s
======================================================================
Image
15.0-350.0 keV image (Event data)
#RAcent DECcent POSerr Theta  Phi  Peak_Cts  SNR Name
167.689 -33.462 0.017 26.540 158.805 0.621 11.087 TRIG_00100368

Image time interval: 22.553 to 51.353 [sec]
Light Curves
Note: The mask-weighted lightcurves have units of either count/det or counts/sec/det, where a det is 0.4 x 0.4 = 0.16 sq cm.
Full-time range; 1 s binning
Other quick-look light curves:
- 64 ms binning (zoomed)
- 16 ms binning (zoomed)
- 8 ms binning (zoomed)
- 2 ms binning (zoomed)
- SN=5 or 10 s binning (full-time range)
- Raw light curve
Spectra
- 64 ms binning (zoomed)
- 16 ms binning (zoomed)
- 8 ms binning (zoomed)
- 2 ms binning (zoomed)
- SN=5 or 10 s binning (full-time range)
- Raw light curve
Spectra
Notes:
- 1) The fitting includes the systematic errors.
- 2) When the burst includes telescope slew time periods, the fitting uses an average response file made from multiple 5-s response files through out the slew time plus single time preiod for the non-slew times, and weighted by the total counts in the corresponding time period using addrmf. An average response file is needed becuase a spectral fit using the pre-slew DRM will introduce some errors in both a spectral shape and a normalization if the PHA file contains a lot of the slew/post-slew time interval.
- 3) For fits to more complicated models (e.g. a power-law over a cutoff power-law), the BAT team has decided to require a chi-square improvement of more than 6 for each extra dof.
Time averaged spectrum fit using the average DRM
Power-law model

Time interval is from   22.553 sec. to   51.353 sec.

Spectral model in power-law:
------------------------------------------------------------
Parameters  : value       lower 90%   higher 90%
Photon index: -2.02774     ( -0.32631   0.295237 )
Norm@50keV  : 1.05098E-03    ( -0.000222612   0.000212377 )
------------------------------------------------------------
#Fit statistic : Chi-Squared =          43.42 using 59 PHA bins.
# Reduced chi-squared =         0.7617 for     57 degrees of freedom
# Null hypothesis probability =   9.076623e-01

Photon flux (15-150 keV)    in 28.8 sec: 0.159704 ( -0.023743  0.023743 ) ph/cm2/s
Energy fluence (15-150 keV)             : 2.79636e-07 ( -5.29767e-08  5.49464e-08 ) ergs/cm2
Cutoff power-law model

Time interval is from   22.553 sec. to   51.353 sec.
Spectral model in the cutoff power-law:
------------------------------------------------------------
Parameters  : value       lower 90%   higher 90%
Photon index: -2.3396     ( -0.165383   1.20198 )
Epeak [keV] : 130.619      (   )
Norm@50keV  : 7.21232E-04    (     )
------------------------------------------------------------
#Fit statistic : Chi-Squared =          43.05 using 59 PHA bins.
# Reduced chi-squared =         0.7687 for     56 degrees of freedom
# Null hypothesis probability =   8.977901e-01

Photon flux (15-150 keV)    in 28.8 sec: 0.140239 (    ) ph/cm2/s
Energy fluence (15-150 keV)             : 2.6182e-07 ( 0  0 ) ergs/cm2
1-s peak spectrum fit
Power-law model
Time interval is from   22.853 sec. to   23.853 sec.

Spectral model in power-law:
------------------------------------------------------------
Parameters  : value       lower 90%   higher 90%
Photon index: -1.34096     ( -0.172254   0.17161 )
Norm@50keV  : 1.13911E-02    ( -0.00117672   0.00117258 )
------------------------------------------------------------
#Fit statistic : Chi-Squared =          64.89 using 59 PHA bins.
# Reduced chi-squared =          1.138 for     57 degrees of freedom
# Null hypothesis probability =   2.210114e-01

Photon flux (15-150 keV)    in 1 sec: 1.36979 ( -0.14249  0.14266 ) ph/cm2/s
Energy fluence (15-150 keV)             : 1.11496e-07 ( -1.27658e-08  1.28667e-08 ) ergs/cm2
Cutoff power-law model
Time interval is from   22.853 sec. to   23.853 sec.
Spectral model in the cutoff power-law:
------------------------------------------------------------
Parameters  : value       lower 90%   higher 90%
Photon index: -0.633827     ( -0.696886   0.840734 )
Epeak [keV] : 101.986      ( -30.5343 972.454 )
Norm@50keV  : 2.50277E-02    ( -0.013303   0.0367269 )
------------------------------------------------------------
#Fit statistic : Chi-Squared =          61.88 using 59 PHA bins.
# Reduced chi-squared =          1.105 for     56 degrees of freedom
# Null hypothesis probability =   2.742825e-01

Photon flux (15-150 keV)    in 1 sec: 1.33274 ( -0.14844  0.14752 ) ph/cm2/s
Energy fluence (15-150 keV)             : 1.07137e-07 ( -1.36524e-08  1.36861e-08 ) ergs/cm2
Time-resolved spectra
Distribution
T90 vs. Hardness ratio plot
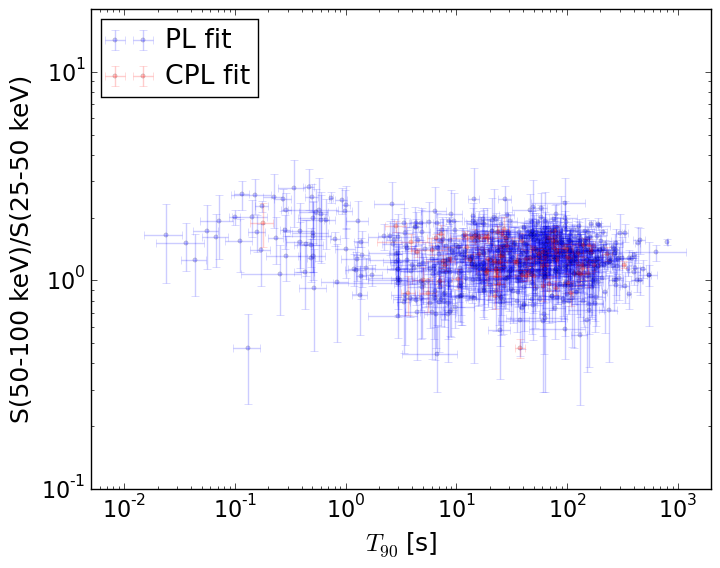
T90                                   = N/A sec.
Hardness ratio (energy fluence ratio) = N/A
S(15-50 keV) vs. S(50-150 keV) plot
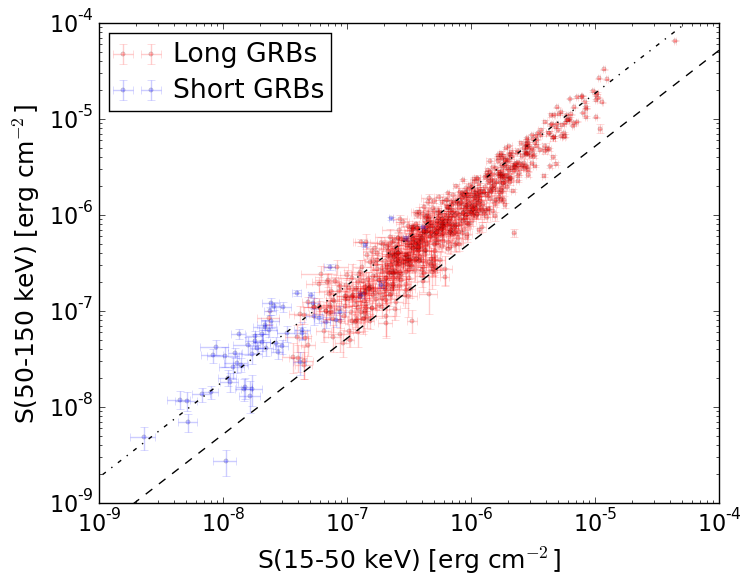
S(15-50 keV)  = N/A
S(50-150 keV) = N/A
The dash-dotted line and the dashed line traces the fluences calculated from the Band function with Epeak = 15 and 150 keV, respectively. Both lines assume a canonical values of alpha = -1 and beta = -2.5.
Mask shadow pattern
IMX = -0.465664395162, IMY = -0.180567902956
Spacecraft aspect plot
Bright source in the event data image
Event data image of 15-350 keV band
Time interval of the image:
24.209000 41.297000

# RAcent  DECcent POSerr Theta    Phi  PeakCts   SNR AngSep     Name
#  [deg]    [deg]    ['] [deg]  [deg]                   [']
135.6123 -40.5934    4.8  28.6   99.8   0.2235   2.4    4.5	Vela X-1
170.2624 -60.6209   92.5   0.7  -40.3  -0.0073  -0.1    1.6	Cen X-3
186.9536 -62.6274    5.3   8.7  -82.2   0.1247   2.2   11.8	GX 301-2
282.3999 -62.8090    2.5  47.0  -52.6   1.3154   4.7 ------	UNKNOWN
Webpage updated on:
Tue Jun 30 15:43:06 EDT 2015