Analysis Summary
Notes:
- 1) No attempt has been made to eliminate the non-significant decimal places.
- 2) This batgrbproduct analysis is done using the HEASARC data.
- 3) This batgrbproduct analysis is using the flight position for the mask-weighting calculation.
======================================================================
BAT GRB EVENT DATA PROCESSING REPORT
Process Script Ver: batgrbproduct v2.46
Process Start Time: Wed Jan 22 23:31:15 EST 2014
Host Name: batevent1
Current Working Dir: /local/data/batevent/batevent_reproc/trigger100433
======================================================================
Trigger: 00100433 Segment: 000
BAT Trigger Time: 125276305.92 [s; MET]
Trigger Stop: 125276306.944 [s; MET]
UTC: 2004-12-20T22:58:26.599560 [includes UTCF correction]
Where From?: TDRSS position message
BAT
RA: 291.241207804425 Dec: 60.6860958775226 [deg; J2000]
Catalogged Source?: NO
Point Source?: YES
GRB Indicated?: YES [ by BAT flight software ]
Image S/N Ratio: 17
Image Trigger?: NO
Rate S/N Ratio: 47.5184174820669 [ if not an image trigger ]
Image S/N Ratio: 17
Analysis Position: [ source = BAT ]
RA: 291.241207804425 Dec: 60.6860958775226 [deg; J2000]
Refined Position: [ source = BAT pre-slew burst ]
RA: 291.300700438317 Dec: 60.5962989303479 [deg; J2000]
{ 19h 25m 12.2s , +60d 35' 46.7" }
+/- 0.966248937040841 [arcmin] (estimated 90% radius based on SNR)
+/- 0.314594633873435 [arcmin] (formal 1-sigma fit error)
SNR: 31.9462412407968
Angular difference between the analysis and refined position is 5.664920 arcmin
Partial Coding Fraction: 0.8671875 [ including projection effects ]
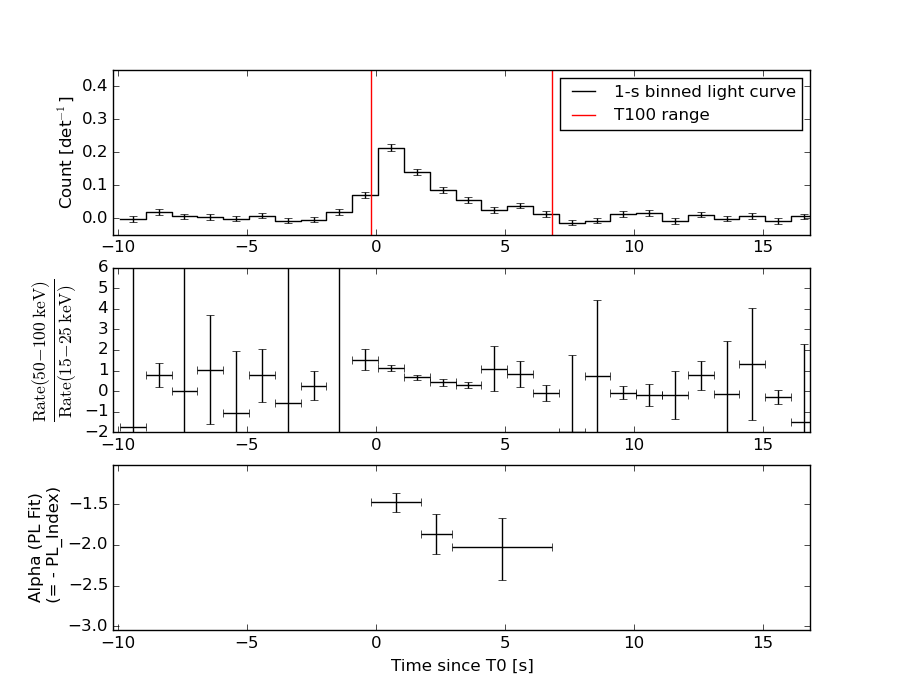
Duration
T90: 5.58400000631809 +/- 1.11335169970864
Measured from: -0.0199999958276749
to: 5.56400001049042 [s; relative to TRIGTIME]
T50: 2.20000000298023 +/- 0.326165601755086
Measured from: 0.508000001311302
to: 2.70800000429153 [s; relative to TRIGTIME]
Fluence
Peak Flux (peak 1 second)
Measured from: -0.0240000039339066
to: 0.975999996066093 [s; relative to TRIGTIME]
Total Fluence
Measured from: -0.208000004291534
to: 6.81199999153614 [s; relative to TRIGTIME]
Band 1 Band 2 Band 3 Band 4
15-25 25-50 50-100 100-350 keV
Total 0.205849 0.245524 0.152386 0.033452
0.013282 0.013819 0.011967 0.009670 [error]
Peak 0.059689 0.075540 0.076703 0.016329
0.005535 0.006035 0.005578 0.004106 [error]
[ fluence units of on-axis counts / fully illuminated detector ]
======================================================================
====== Table of the duration information =============================
Value tstart tstop
T100 7.020 -0.208 6.812
T90 5.584 -0.020 5.564
T50 2.200 0.508 2.708
Peak 1.000 -0.024 0.976
====== Spectral Analysis Summary =====================================
Model : spectral model: simple power-law (PL) and cutoff power-law (CPL)
Ph_index : photon index: E^{Ph_index}
Ph_90err : 90% error of the photon index
Epeak : Epeak in keV
Epeak_90err: 90% error of Epeak
Norm : normalization at 50 keV in both the PL model and CPL model
Nomr_90err : 90% error of the normalization
chi2 : Chi-Squared
dof : degree of freedo
=== Time-averaged spectral analysis ===
(Best model with acceptable fit: PL)
Model Ph_index Ph_90err_low Ph_90err_hi Epeak Epeak_90err_low Epeak_90err_hi Norm Nomr_90err_low Norm_90err_hi chi2 dof
PL -1.672 -0.122 0.120 - - - 5.62e-03 -3.96e-04 3.93e-04 30.460 57
CPL -1.526 -0.255 0.504 155.283 -87.493 -155.283 6.70e-03 -1.44e-03 5.46e-03 30.180 56
=== 1-s peak spectral analysis ===
(Best model with acceptable fit: PL)
Model Ph_index Ph_90err_low Ph_90err_hi Epeak Epeak_90err_low Epeak_90err_hi Norm Nomr_90err_low Norm_90err_hi chi2 dof
PL -1.318 -0.140 0.139 - - - 1.46e-02 -1.17e-03 1.17e-03 56.740 57
CPL -1.107 -0.283 0.579 227.096 -227.096 -227.096 1.85e-02 -4.83e-03 1.57e-02 56.270 56
=== Fluence/Peak Flux Summary ===
Model Band1 Band2 Band3 Band4 Band5 Total
15-25 25-50 50-100 100-350 15-150 15-350 keV
Fluence PL 5.92e-08 9.80e-08 1.23e-07 3.07e-07 3.66e-07 5.88e-07 erg/cm2
90%_error_low -6.28e-09 -6.44e-09 -1.18e-08 -5.82e-08 -2.74e-08 -6.89e-08 erg/cm2
90%_error_hi 6.47e-09 6.44e-09 1.18e-08 6.69e-08 2.76e-08 7.59e-08 erg/cm2
Peak flux PL 5.06e-01 5.68e-01 4.56e-01 6.07e-01 1.75e+00 2.14e+00 ph/cm2/s
90%_error_low -7.19e-02 -5.02e-02 -4.47e-02 -1.17e-01 -1.41e-01 -1.77e-01 ph/cm2/s
90%_error_hi 7.52e-02 4.98e-02 4.42e-02 1.33e-01 1.41e-01 1.79e-01 ph/cm2/s
Fluence CPL 5.80e-08 9.95e-08 1.24e-07 2.40e-07 3.61e-07 5.21e-07 erg/cm2
90%_error_low -7.44e-09 -7.60e-09 -1.21e-08 -1.25e-07 -3.17e-08 -1.30e-07 erg/cm2
90%_error_hi 6.35e-09 8.18e-09 1.23e-08 1.54e-07 3.11e-08 6.43e-08 erg/cm2
Peak flux CPL 4.84e-01 5.77e-01 4.66e-01 4.81e-01 1.74e+00 2.01e+00 ph/cm2/s
90%_error_low -9.03e-02 -5.51e-02 -5.01e-02 -2.05e-01 -1.47e-01 -2.62e-01 ph/cm2/s
90%_error_hi 6.68e-02 5.65e-02 5.26e-02 1.62e-01 1.46e-01 2.39e-01 ph/cm2/s
======================================================================
Image
Pre-slew 15.0-350.0 keV image (Event data)
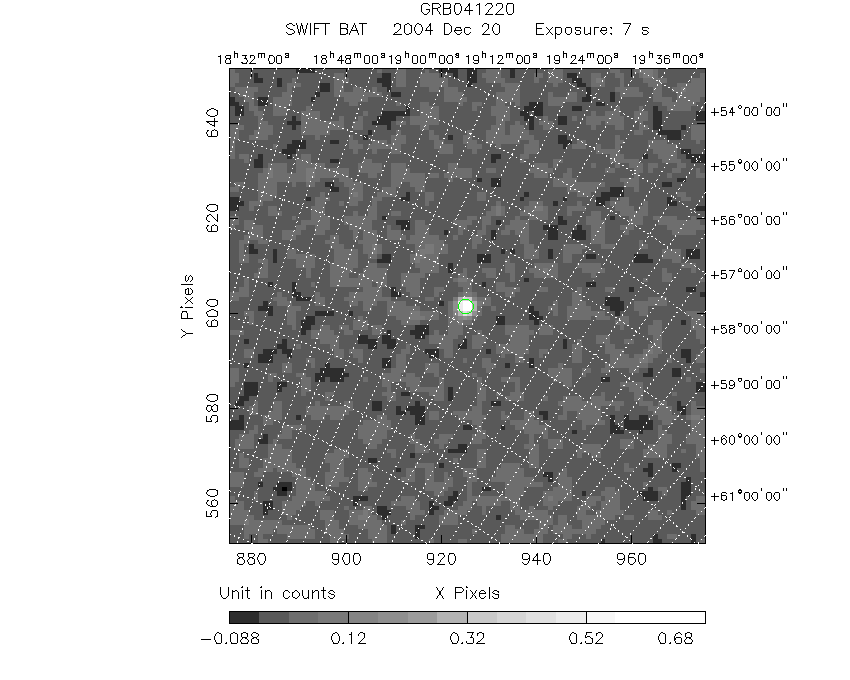
#   RAcent    DECcent   POSerr    Theta     Phi              Peak Cts       SNR   Name
  291.3007    60.5963   0.0060    15.5920  -110.0462         0.8054657     31.946 TRIG_00100433

Foreground time interval of the image:
 -0.208   6.812 (delta_t =   7.020 [sec])
Background time interval of the image:
-299.920  -0.208 (delta_t = 299.712 [sec])
Light Curves
Note: The mask-weighted lightcurves have units of either count/det or counts/sec/det, where a det is 0.4 x 0.4 = 0.16 sq cm.
Full-time range; 1 s binning
Other quick-look light curves:
- 64 ms binning (zoomed)
- 16 ms binning (zoomed)
- 8 ms binning (zoomed)
- 2 ms binning (zoomed)
- SN=5 or 10 s binning (full-time range)
- Raw light curve
Spectra
- 64 ms binning (zoomed)
- 16 ms binning (zoomed)
- 8 ms binning (zoomed)
- 2 ms binning (zoomed)
- SN=5 or 10 s binning (full-time range)
- Raw light curve
Spectra
Notes:
- 1) The fitting includes the systematic errors.
- 2) When the burst includes telescope slew time periods, the fitting uses an average response file made from multiple 5-s response files through out the slew time plus single time preiod for the non-slew times, and weighted by the total counts in the corresponding time period using addrmf. An average response file is needed becuase a spectral fit using the pre-slew DRM will introduce some errors in both a spectral shape and a normalization if the PHA file contains a lot of the slew/post-slew time interval.
- 3) For fits to more complicated models (e.g. a power-law over a cutoff power-law), the BAT team has decided to require a chi-square improvement of more than 6 for each extra dof.
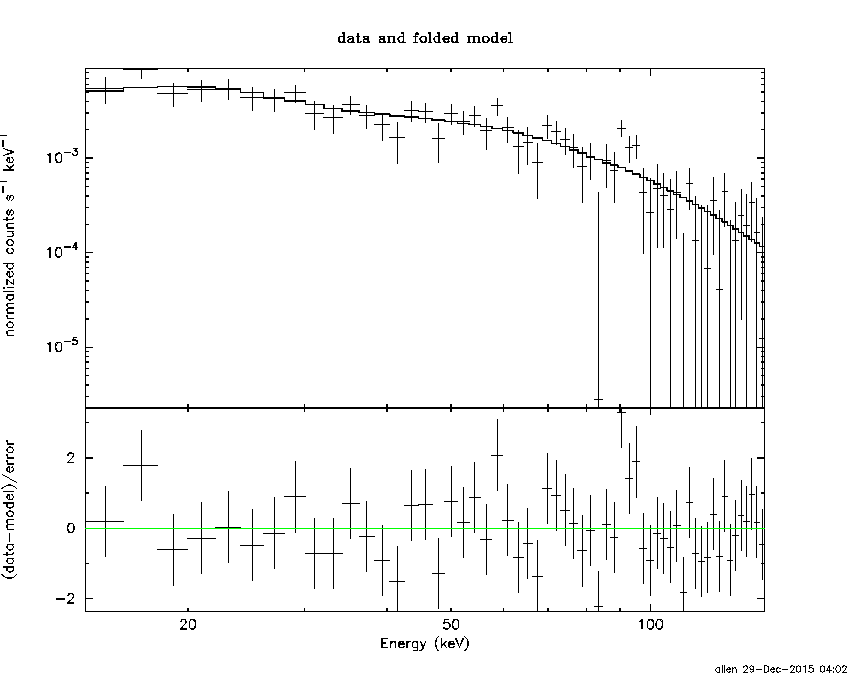
Time averaged spectrum fit using the average DRM
Power-law model

Time interval is from   -0.208 sec. to    6.812 sec.

Spectral model in power-law:
------------------------------------------------------------
Parameters  : value       lower 90%   higher 90%
Photon index: -1.67176     ( -0.122322   0.120246 )
Norm@50keV  : 5.62057E-03    ( -0.000396291   0.00039264 )
------------------------------------------------------------
#Fit statistic : Chi-Squared =          30.46 using 59 PHA bins.
# Reduced chi-squared =         0.5344 for     57 degrees of freedom
# Null hypothesis probability =   9.984831e-01

Photon flux (15-150 keV)    in 7.02 sec: 0.739291 ( -0.048685  0.04876 ) ph/cm2/s
Energy fluence (15-150 keV)             : 3.6625e-07 ( -2.73687e-08  2.76424e-08 ) ergs/cm2
Cutoff power-law model

Time interval is from   -0.208 sec. to    6.812 sec.
Spectral model in the cutoff power-law:
------------------------------------------------------------
Parameters  : value       lower 90%   higher 90%
Photon index: -1.52647     ( -0.254861   0.504098 )
Epeak [keV] : 155.283      ( -87.4986 -155.289 )
Norm@50keV  : 6.69898E-03    ( -0.00144463   0.00546369 )
------------------------------------------------------------
#Fit statistic : Chi-Squared =          30.18 using 59 PHA bins.
# Reduced chi-squared =         0.5388 for     56 degrees of freedom
# Null hypothesis probability =   9.981395e-01

Photon flux (15-150 keV)    in 7.02 sec: 0.733672 ( -0.051897  0.051692 ) ph/cm2/s
Energy fluence (15-150 keV)             : 3.61249e-07 ( -3.17024e-08  3.10858e-08 ) ergs/cm2
1-s peak spectrum fit
Power-law model

Time interval is from   -0.024 sec. to    0.976 sec.

Spectral model in power-law:
------------------------------------------------------------
Parameters  : value       lower 90%   higher 90%
Photon index: -1.31802     ( -0.14013   0.139444 )
Norm@50keV  : 1.46446E-02    ( -0.00116931   0.00116578 )
------------------------------------------------------------
#Fit statistic : Chi-Squared =          56.74 using 59 PHA bins.
# Reduced chi-squared =         0.9954 for     57 degrees of freedom
# Null hypothesis probability =   4.848490e-01

Photon flux (15-150 keV)    in 1 sec: 1.75309 ( -0.14097  0.14115 ) ph/cm2/s
Energy fluence (15-150 keV)             : 1.44105e-07 ( -1.29515e-08  1.30615e-08 ) ergs/cm2
Cutoff power-law model
Time interval is from   -0.024 sec. to    0.976 sec.
Spectral model in the cutoff power-law:
------------------------------------------------------------
Parameters  : value       lower 90%   higher 90%
Photon index: -1.10684     ( -0.283431   0.578642 )
Epeak [keV] : 227.096      ( -227.095 -227.095 )
Norm@50keV  : 1.84788E-02    ( -0.00483383   0.0156774 )
------------------------------------------------------------
#Fit statistic : Chi-Squared =          56.27 using 59 PHA bins.
# Reduced chi-squared =          1.005 for     56 degrees of freedom
# Null hypothesis probability =   4.646704e-01

Photon flux (15-150 keV)    in 1 sec: 1.73732 ( -0.14664  0.14622 ) ph/cm2/s
Energy fluence (15-150 keV)             : 1.42361e-07 ( -1.38057e-08  1.37451e-08 ) ergs/cm2
Time-resolved spectra
Distribution
T90 vs. Hardness ratio plot
T90                                   = N/A sec.
Hardness ratio (energy fluence ratio) = N/A
S(15-50 keV) vs. S(50-150 keV) plot
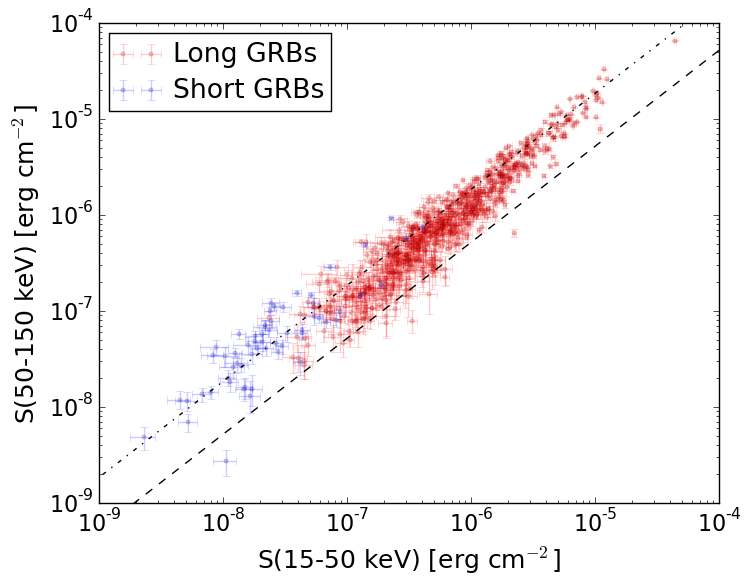
S(15-50 keV)  = N/A
S(50-150 keV) = N/A
The dash-dotted line and the dashed line traces the fluences calculated from the Band function with Epeak = 15 and 150 keV, respectively. Both lines assume a canonical values of alpha = -1 and beta = -2.5.
Mask shadow pattern
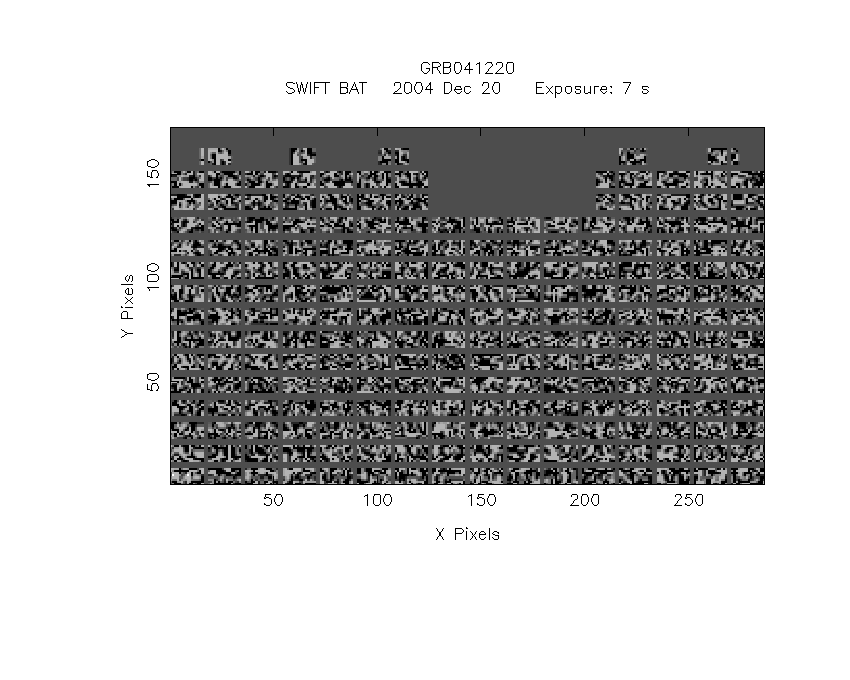
IMX = -9.565389256969814E-02, IMY = 2.621486663322457E-01
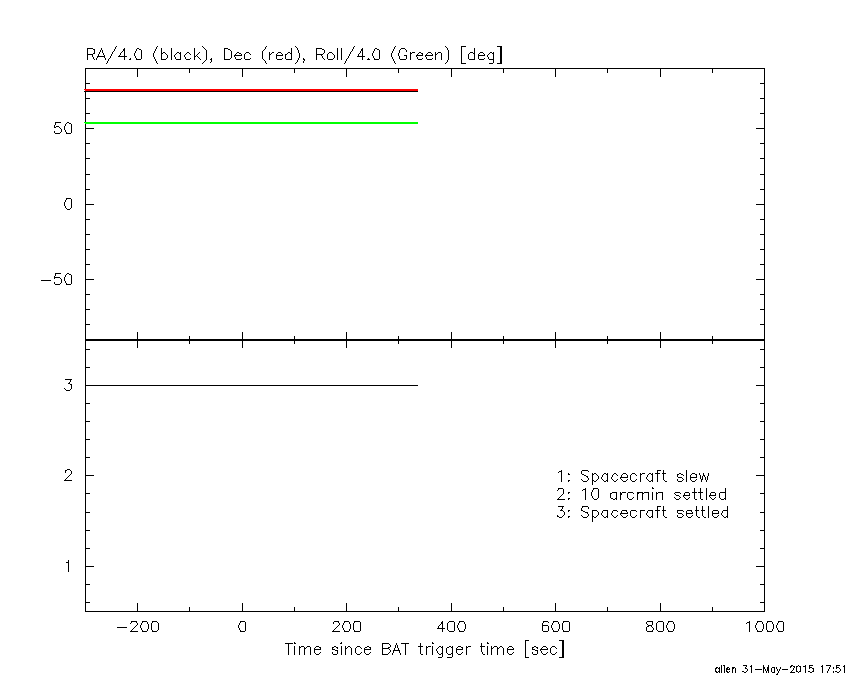
Spacecraft aspect plot
Bright source in the pre-burst/pre-slew/post-slew images
Pre-burst image of 15-350 keV band
Time interval of the image:
-299.920000 -0.208000

# RAcent  DECcent POSerr Theta    Phi  PeakCts   SNR AngSep     Name
#  [deg]    [deg]    ['] [deg]  [deg]                   [']
299.5966  35.1949    0.6  40.7 -125.5   7.8960  20.9    0.5	Cyg X-1
308.1084  40.9828    1.5  35.1 -136.7   1.8272   7.7    1.8	Cyg X-3
326.1683  38.3036    3.1  39.4 -159.1   0.9156   3.8    1.1	Cyg X-2
 43.1289  60.1889    1.9  35.5  110.5   2.5311   5.9 ------	UNKNOWN
136.8521  59.0478    2.9  44.6   41.8   2.3156   3.9 ------	UNKNOWN
 34.5483  59.0934    2.3  34.7  118.1   1.7640   5.0 ------	UNKNOWN
  1.7046  60.2963    2.8  25.9  146.1   0.8877   4.1 ------	UNKNOWN
338.9740  36.9304    2.5  42.8 -173.8   1.1582   4.6 ------	UNKNOWN
308.0768  37.6362    1.6  38.4 -136.3   2.2318   7.1 ------	UNKNOWN
Pre-slew background subtracted image of 15-350 keV band
Time interval of the image:
-0.208000 6.812000

# RAcent  DECcent POSerr Theta    Phi  PeakCts   SNR AngSep     Name
#  [deg]    [deg]    ['] [deg]  [deg]                   [']
299.5170  35.2155    8.5  40.7 -125.4  -0.0731  -1.4    3.7	Cyg X-1
307.9610  41.0058   71.2  35.1 -136.5   0.0056   0.2    7.5	Cyg X-3
326.0692  38.4450    5.3  39.3 -159.0   0.0752   2.2    8.8	Cyg X-2
158.4267  63.5514    2.0  38.4   27.6   0.2533   5.9 ------	UNKNOWN
291.3007  60.5963    0.4  15.6 -110.0   0.8055  31.9 ------	UNKNOWN
Post-slew image of 15-350 keV band
Time interval of the image:
-299.920000 302.116000

# RAcent  DECcent POSerr Theta    Phi  PeakCts   SNR AngSep     Name
#  [deg]    [deg]    ['] [deg]  [deg]                   [']
299.5956  35.1957    0.5  40.7 -125.5  14.5632  23.7    0.4	Cyg X-1
308.0937  40.9819    1.3  35.1 -136.7   3.4780   8.9    1.9	Cyg X-3
326.2165  38.2946    2.8  39.4 -159.1   1.7665   4.2    2.7	Cyg X-2
 43.2038  60.1886    2.4  35.5  110.4   3.2489   4.7 ------	UNKNOWN
347.7842  36.5721    3.9  44.8  176.5   1.5732   2.9 ------	UNKNOWN
308.0774  37.6437    1.6  38.4 -136.3   3.8598   7.3 ------	UNKNOWN