Analysis Summary
Notes:
- 1) No attempt has been made to eliminate the non-significant decimal places.
- 2) This batgrbproduct analysis is done using the HEASARC data.
- 3) This batgrbproduct analysis is using the flight position for the mask-weighting calculation.
======================================================================
                  BAT GRB EVENT DATA PROCESSING REPORT
    Process Script Ver: batgrbproduct v2.46
    Process Start Time: Wed Jan 22 23:25:21 EST 2014
             Host Name: batevent1
   Current Working Dir: /local/data/batevent/batevent_reproc/trigger100703
======================================================================

  Trigger: 00100703      Segment: 000

  BAT Trigger Time: 125612457.024   [s; MET]
      Trigger Stop: 125612458.048   [s; MET]
               UTC: 2004-12-24T20:20:57.698840    [includes UTCF correction]
       Where From?: TDRSS position message

  BAT
    RA: 56.1991351820266   Dec: -6.61701115766916  [deg; J2000]

     Catalogged Source?: NO
     Point Source?:      YES
     GRB Indicated?:     YES    [ by BAT flight software ]
     Image S/N Ratio:    10
     Image Trigger?:     NO
     Rate S/N Ratio:     19.824227601599  [ if not an image trigger ]
     Image S/N Ratio:    10

  Analysis Position:   [ source = BAT ]
    RA: 56.1991351820266   Dec: -6.61701115766916  [deg; J2000]

  Refined Position:   [ source = BAT pre-slew burst ]
    RA: 56.1934089128069   Dec: -6.66233417072409  [deg; J2000]
        { 03h 44m 46.4s , -06d 39' 44.4" }
         +/- 1.98543805277974 [arcmin] (estimated 90% radius based on SNR)
         +/- 0.900451969225868 [arcmin] (formal 1-sigma fit error)
    SNR: 11.4185069616262

  Angular difference between the analysis and refined position is 2.740711 arcmin

  Partial Coding Fraction: 0.2578125    [ including projection effects ]

  Duration
     T90: 177.56400001049 +/- 19.260284628303
        Measured from: -93.6480000019073
                   to: 83.9160000085831     [s; relative to TRIGTIME]
     T50: 38.1920000165701 +/- 4.08676156199759
        Measured from: -12.0920000076294
                   to: 26.1000000089407     [s; relative to TRIGTIME]


  Fluence
     Peak Flux  (peak 1 second)
        Measured from: -0.0600000023841858
                   to: 0.939999997615814     [s; relative to TRIGTIME]
     Total Fluence
        Measured from: -110.652000010014
                   to: 116.271999999881     [s; relative to TRIGTIME]

             Band 1     Band 2     Band 3     Band 4
              15-25      25-50     50-100    100-350     keV
 Total     3.799961   5.664382   3.703137   0.744129
           0.137476   0.143969   0.123508   0.099513 [error]
 Peak      0.069149   0.130282   0.122700   0.034268
           0.010306   0.012011   0.011283   0.008051 [error]

     [ fluence units of on-axis counts / fully illuminated detector ]

======================================================================


====== Table of the duration information =============================

        Value   tstart    tstop
T100  226.924 -110.652  116.272
T90   177.564  -93.648   83.916
T50    38.192  -12.092   26.100
Peak    1.000   -0.060    0.940


====== Spectral Analysis Summary =====================================

Model      : spectral model: simple power-law (PL) and cutoff power-law (CPL)
Ph_index   : photon index: E^{Ph_index}
Ph_90err   : 90% error of the photon index
Epeak      : Epeak in keV
Epeak_90err: 90% error of Epeak
Norm       : normalization at 50 keV in both the PL model and CPL model
Nomr_90err : 90% error of the normalization
chi2       : Chi-Squared
dof        : degree of freedo

=== Time-averaged spectral analysis ===
(Best model with acceptable fit: CPL)

Model Ph_index Ph_90err_low Ph_90err_hi  Epeak  Epeak_90err_low  Epeak_90err_hi  Norm       Nomr_90err_low    Norm_90err_hi    chi2    dof
PL      -1.730    -0.058      0.058       -           -               -         4.32e-03     -1.44e-04          1.43e-04      62.970   57
CPL     -0.978    -0.264      0.281       68.865      -6.893        11.594      1.01e-02     -2.57e-03          3.72e-03      36.770   56


=== 1-s peak spectral analysis ===
(Best model with acceptable fit: N/A)

Model Ph_index Ph_90err_low Ph_90err_hi  Epeak  Epeak_90err_low  Epeak_90err_hi  Norm       Nomr_90err_low    Norm_90err_hi    chi2    dof
PL      -1.260     -0.157     0.158       -           -               -         2.48e-02     -2.44e-03          2.43e-03      74.400   57
CPL     -0.698     -0.613     0.725      129.138     -44.447      -129.138      4.54e-02     -2.14e-02          5.05e-02      72.080   56


=== Fluence/Peak Flux Summary ===

              Model    Band1     Band2     Band3     Band4     Band5     Total
                       15-25     25-50    50-100    100-350    15-150    15-350    keV
Fluence         PL   1.54e-06  2.47e-06  2.97e-06  7.01e-06  9.00e-06  1.40e-05   erg/cm2
      90%_error_low -8.86e-08 -8.63e-08 -1.26e-07 -6.20e-07 -3.07e-07 -7.18e-07   erg/cm2
      90%_error_hi   9.02e-08  8.62e-08  1.26e-07  6.57e-07  3.08e-07  7.45e-07   erg/cm2
Peak flux       PL   8.11e-01  9.42e-01  7.86e-01  1.11e+00  2.94e+00  3.65e+00   ph/cm2/s
      90%_error_low -1.43e-01 -1.08e-01 -8.74e-02 -2.31e-01 -3.00e-01 -3.66e-01   ph/cm2/s
      90%_error_hi   1.50e-01  1.07e-01  8.65e-02  2.63e-01  3.00e-01  3.69e-01   ph/cm2/s

Fluence        CPL   1.33e-06  2.62e-06  3.10e-06  2.80e-06  8.55e-06  9.85e-06   erg/cm2
      90%_error_low -1.09e-07 -1.03e-07 -1.42e-07 -6.82e-07 -3.44e-07 -7.57e-07   erg/cm2
      90%_error_hi   1.11e-07  1.04e-07  1.43e-07  9.40e-07  3.44e-07  9.79e-07   erg/cm2
Peak flux      CPL   7.15e-01  9.85e-01  8.47e-01  6.67e-01  2.90e+00  3.21e+00   ph/cm2/s
      90%_error_low -1.74e-01 -1.21e-01 -1.10e-01 -2.82e-01 -3.04e-01 -4.25e-01   ph/cm2/s
      90%_error_hi   1.82e-01  1.24e-01  1.13e-01  5.32e-01  3.04e-01  5.77e-01   ph/cm2/s

======================================================================
Image
Pre-slew 15.0-350.0 keV image (Event data)
#   RAcent    DECcent   POSerr    Theta     Phi              Peak Cts       SNR   Name
   56.1934    -6.6623   0.0169    40.1667    35.6071        14.1896232     11.419 TRIG_00100703

Foreground time interval of the image:
-110.652  80.622 (delta_t = 191.274 [sec])
 81.976 116.272 (delta_t =  34.296 [sec])
Background time interval of the image:
-119.523 -110.652 (delta_t =   8.871 [sec])
Light Curves
Note: The mask-weighted lightcurves have units of either count/det or counts/sec/det, where a det is 0.4 x 0.4 = 0.16 sq cm.
Full-time range; 1 s binning
Other quick-look light curves:
- 64 ms binning (zoomed)
- 16 ms binning (zoomed)
- 8 ms binning (zoomed)
- 2 ms binning (zoomed)
- SN=5 or 10 s binning (full-time range)
- Raw light curve
Spectra
- 64 ms binning (zoomed)
- 16 ms binning (zoomed)
- 8 ms binning (zoomed)
- 2 ms binning (zoomed)
- SN=5 or 10 s binning (full-time range)
- Raw light curve
Spectra
Notes:
- 1) The fitting includes the systematic errors.
- 2) When the burst includes telescope slew time periods, the fitting uses an average response file made from multiple 5-s response files through out the slew time plus single time preiod for the non-slew times, and weighted by the total counts in the corresponding time period using addrmf. An average response file is needed becuase a spectral fit using the pre-slew DRM will introduce some errors in both a spectral shape and a normalization if the PHA file contains a lot of the slew/post-slew time interval.
- 3) For fits to more complicated models (e.g. a power-law over a cutoff power-law), the BAT team has decided to require a chi-square improvement of more than 6 for each extra dof.
Time averaged spectrum fit using the average DRM
Power-law model
Multiple GTIs in the spectrum
tstart tstop
-110.652000 80.622000
81.976000 116.272000

Spectral model in power-law:
------------------------------------------------------------
Parameters  : value       lower 90%   higher 90%
Photon index: -1.7301     ( -0.0580438   0.0577769 )
Norm@50keV  : 4.31580E-03    ( -0.000143515   0.000143351 )
------------------------------------------------------------
#Fit statistic : Chi-Squared =          62.97 using 59 PHA bins.
# Reduced chi-squared =          1.105 for     57 degrees of freedom
# Null hypothesis probability =   2.733442e-01

Photon flux (15-150 keV)    in 225.6 sec: 0.579374 ( -0.020573  0.020628 ) ph/cm2/s
Energy fluence (15-150 keV)             : 8.99661e-06 ( -3.07425e-07  3.07804e-07 ) ergs/cm2
Cutoff power-law model
Multiple GTIs in the spectrum
tstart tstop
-110.652000 80.622000
81.976000 116.272000
Spectral model in the cutoff power-law:
------------------------------------------------------------
Parameters  : value       lower 90%   higher 90%
Photon index: -0.977789     ( -0.264233   0.281082 )
Epeak [keV] : 68.8655      ( -6.89309 11.5944 )
Norm@50keV  : 1.01353E-02    ( -0.00257381   0.00372491 )
------------------------------------------------------------
#Fit statistic : Chi-Squared =          36.77 using 59 PHA bins.
# Reduced chi-squared =         0.6567 for     56 degrees of freedom
# Null hypothesis probability =   9.780264e-01

Photon flux (15-150 keV)    in 225.6 sec: 0.553113 ( -0.022166  0.022245 ) ph/cm2/s
Energy fluence (15-150 keV)             : 8.55065e-06 ( -3.43747e-07  3.436e-07 ) ergs/cm2
1-s peak spectrum fit
Power-law model
Time interval is from   -0.060 sec. to    0.940 sec.

Spectral model in power-law:
------------------------------------------------------------
Parameters  : value       lower 90%   higher 90%
Photon index: -1.25991     ( -0.157358   0.15849 )
Norm@50keV  : 2.47986E-02    ( -0.0024352   0.002435 )
------------------------------------------------------------
#Fit statistic : Chi-Squared =          74.40 using 59 PHA bins.
# Reduced chi-squared =          1.305 for     57 degrees of freedom
# Null hypothesis probability =   6.067524e-02

Photon flux (15-150 keV)    in 1 sec: 2.93782 ( -0.29988  0.3004 ) ph/cm2/s
Energy fluence (15-150 keV)             : 2.47571e-07 ( -2.60831e-08  2.61449e-08 ) ergs/cm2
Cutoff power-law model
Time interval is from   -0.060 sec. to    0.940 sec.
Spectral model in the cutoff power-law:
------------------------------------------------------------
Parameters  : value       lower 90%   higher 90%
Photon index: -0.69835     ( -0.613336   0.725181 )
Epeak [keV] : 129.138      ( -44.4468 -129.138 )
Norm@50keV  : 4.53865E-02    ( -0.0213979   0.0504944 )
------------------------------------------------------------
#Fit statistic : Chi-Squared =          72.08 using 59 PHA bins.
# Reduced chi-squared =          1.287 for     56 degrees of freedom
# Null hypothesis probability =   7.271384e-02

Photon flux (15-150 keV)    in 1 sec: 2.89687 ( -0.30393  0.30421 ) ph/cm2/s
Energy fluence (15-150 keV)             : 2.43775e-07 ( -2.70445e-08  2.68762e-08 ) ergs/cm2
Time-resolved spectra
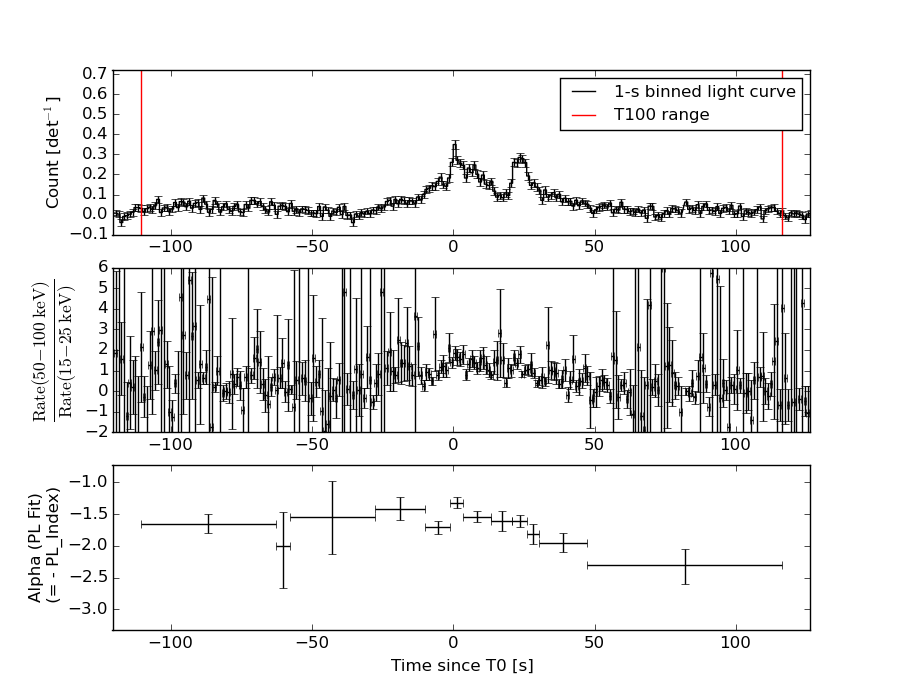
Distribution
T90 vs. Hardness ratio plot
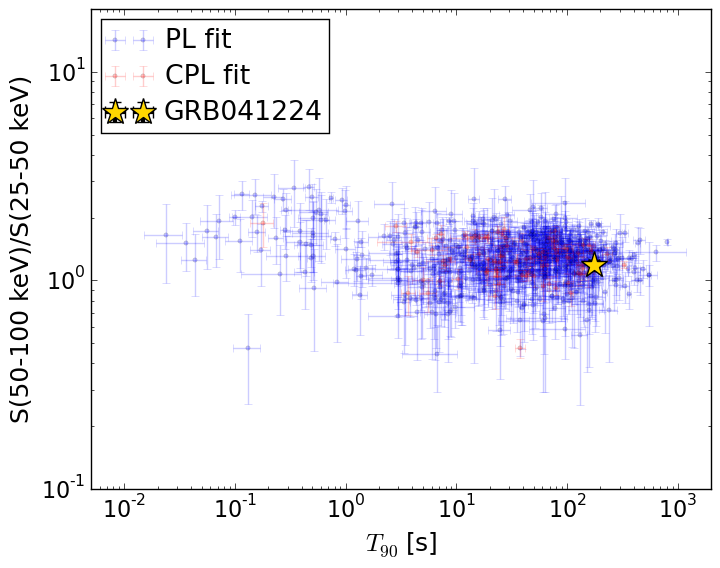
T90                                   = 177.564 sec.
Hardness ratio (energy fluence ratio) = 1.18364126386
S(15-50 keV) vs. S(50-150 keV) plot
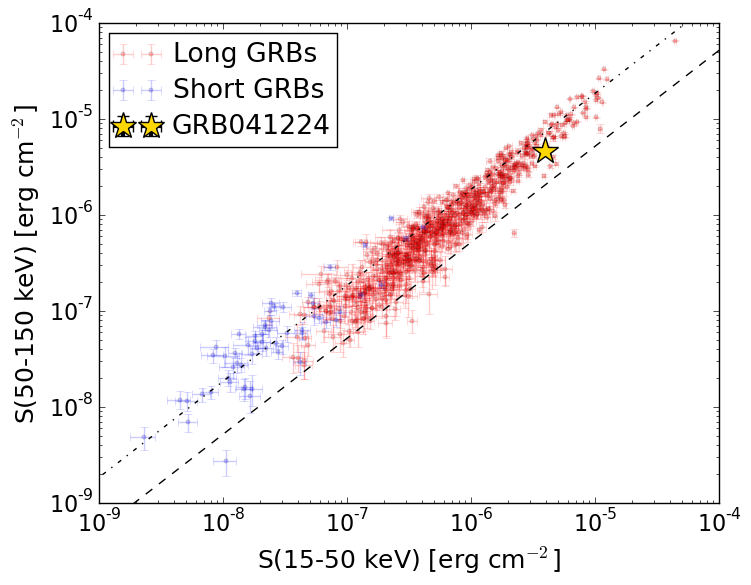
S(15-50 keV)  = 3.95482e-06
S(50-150 keV) = 4.595785e-06
The dash-dotted line and the dashed line traces the fluences calculated from the Band function with Epeak = 15 and 150 keV, respectively. Both lines assume a canonical values of alpha = -1 and beta = -2.5.
Mask shadow pattern
IMX = 6.862540828690745E-01, IMY = -4.914374216376731E-01
Spacecraft aspect plot
Bright source in the pre-burst/pre-slew/post-slew images
Pre-burst image of 15-350 keV band
Time interval of the image:
-119.523410 -110.652000

# RAcent  DECcent POSerr Theta    Phi  PeakCts   SNR AngSep     Name
#  [deg]    [deg]    ['] [deg]  [deg]                   [']
135.3878 -40.4758    5.6  37.4 -148.8   0.0647   2.1    8.0	Vela X-1
139.4992 -34.6510    2.1  41.2 -157.5   0.1869   5.5 ------	UNKNOWN
138.7935 -41.1302    2.2  39.9 -147.6   0.1798   5.2 ------	UNKNOWN
156.4968 -27.3626    2.1  57.2 -161.4   0.6058   5.4 ------	UNKNOWN
151.1890 -53.4757    2.1  48.3 -129.9   0.5718   5.5 ------	UNKNOWN
Pre-slew background subtracted image of 15-350 keV band
Time interval of the image:
-110.652000 80.622000
81.976000 116.272000

# RAcent  DECcent POSerr Theta    Phi  PeakCts   SNR AngSep     Name
#  [deg]    [deg]    ['] [deg]  [deg]                   [']
135.6790 -40.5656    4.2  37.6 -148.7   2.3091   2.8    6.9	Vela X-1
 56.1934  -6.6624    1.0  40.2   35.6  14.1909  11.4 ------	UNKNOWN
 25.9485 -57.3659    2.2  50.0  -46.3  15.3902   5.3 ------	UNKNOWN
Post-slew image of 15-350 keV band
Time interval of the image:
-299.024000 80.622000
81.976000 302.981200

# RAcent  DECcent POSerr Theta    Phi  PeakCts   SNR AngSep     Name
#  [deg]    [deg]    ['] [deg]  [deg]                   [']
135.5388 -40.5333    1.4  37.5 -148.7   3.3914   8.0    1.4	Vela X-1
 56.1982  -6.6633    0.4  40.2   35.6  15.2135  29.2 ------	UNKNOWN
132.8856 -12.1412    2.7  44.0  168.0   2.1457   4.3 ------	UNKNOWN
 33.7179 -46.0780    3.5  45.1  -31.1   1.6770   3.3 ------	UNKNOWN
151.5337 -53.2144    4.5  48.5 -130.2   3.5988   2.5 ------	UNKNOWN