Analysis Summary
Notes:
- 1) No attempt has been made to eliminate the non-significant decimal places.
- 2) This batgrbproduct analysis is done using the HEASARC data.
- 3) This batgrbproduct analysis is using the flight position for the mask-weighting calculation.
======================================================================
BAT GRB EVENT DATA PROCESSING REPORT
Process Script Ver: batgrbproduct v2.46
Process Start Time: Wed Jan 22 23:20:41 EST 2014
Host Name: batevent1
Current Working Dir: /local/data/batevent/batevent_reproc/trigger100970
======================================================================
Trigger: 00100970 Segment: 000
BAT Trigger Time: 125923753.472 [s; MET]
Trigger Stop: 125923769.856 [s; MET]
UTC: 2004-12-28T10:49:14.142460 [includes UTCF correction]
Where From?: TDRSS position message
BAT
RA: 336.648289388184 Dec: 5.03633072641599 [deg; J2000]
Catalogged Source?: NO
Point Source?: YES
GRB Indicated?: YES [ by BAT flight software ]
Image S/N Ratio: 16
Image Trigger?: NO
Rate S/N Ratio: 26.7955220139485 [ if not an image trigger ]
Image S/N Ratio: 16
Analysis Position: [ source = BAT ]
RA: 336.648289388184 Dec: 5.03633072641599 [deg; J2000]
Refined Position: [ source = BAT pre-slew burst ]
RA: 336.649614099292 Dec: 5.02731446088863 [deg; J2000]
{ 22h 26m 35.9s , +05d 01' 38.3" }
+/- 0.887651757061631 [arcmin] (estimated 90% radius based on SNR)
+/- 0.30589196498394 [arcmin] (formal 1-sigma fit error)
SNR: 36.0626385020167
Angular difference between the analysis and refined position is 0.546739 arcmin
Partial Coding Fraction: 0.4257812 [ including projection effects ]
Duration
T90: 56.3000000119209 +/- 7.78277277125783
Measured from: 1.33599999547005
to: 57.636000007391 [s; relative to TRIGTIME]
T50: 20.0840000212193 +/- 2.05039019772188
Measured from: 10.3559999912977
to: 30.440000012517 [s; relative to TRIGTIME]
Fluence
Peak Flux (peak 1 second)
Measured from: 22.027999997139
to: 23.027999997139 [s; relative to TRIGTIME]
Total Fluence
Measured from: -2.73600000143051
to: 70.7000000029802 [s; relative to TRIGTIME]
Band 1 Band 2 Band 3 Band 4
15-25 25-50 50-100 100-350 keV
Total 1.523095 1.943263 1.538650 0.442768
0.071782 0.072893 0.062870 0.054898 [error]
Peak 0.062506 0.056563 0.048736 0.018513
0.008703 0.009098 0.007731 0.006410 [error]
[ fluence units of on-axis counts / fully illuminated detector ]
======================================================================
====== Table of the duration information =============================
Value tstart tstop
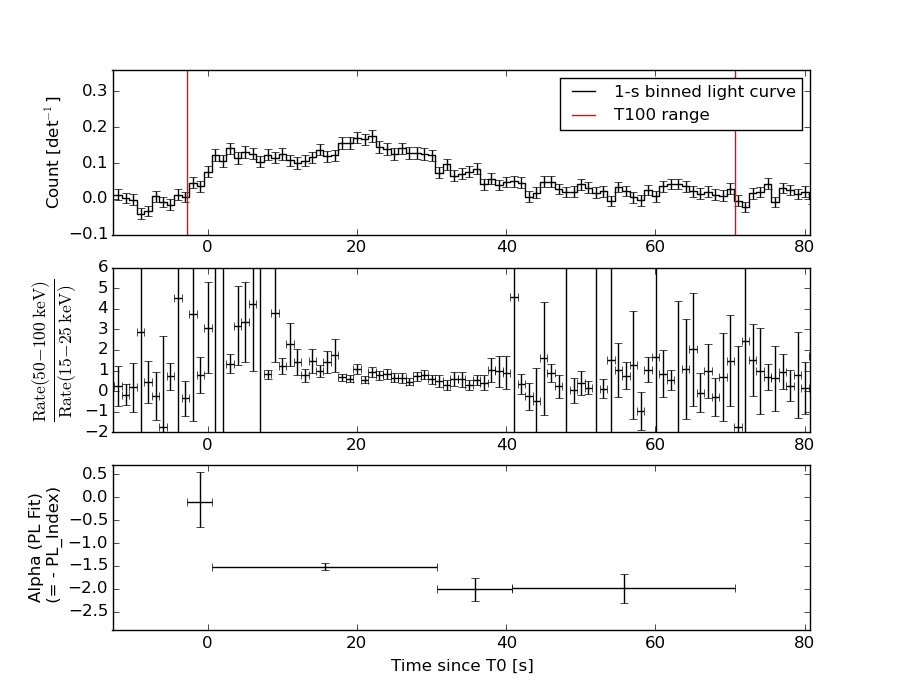
T100 73.436 -2.736 70.700
T90 56.300 1.336 57.636
T50 20.084 10.356 30.440
Peak 1.000 22.028 23.028
====== Spectral Analysis Summary =====================================
Model : spectral model: simple power-law (PL) and cutoff power-law (CPL)
Ph_index : photon index: E^{Ph_index}
Ph_90err : 90% error of the photon index
Epeak : Epeak in keV
Epeak_90err: 90% error of Epeak
Norm : normalization at 50 keV in both the PL model and CPL model
Nomr_90err : 90% error of the normalization
chi2 : Chi-Squared
dof : degree of freedo
=== Time-averaged spectral analysis ===
(Best model with acceptable fit: PL)
Model Ph_index Ph_90err_low Ph_90err_hi Epeak Epeak_90err_low Epeak_90err_hi Norm Nomr_90err_low Norm_90err_hi chi2 dof
PL -1.588 -0.079 0.079 - - - 5.18e-03 -2.15e-04 2.14e-04 63.600 57
CPL -1.586 -0.080 0.146 9999.360 -9999.360 -9999.360 5.19e-03 -2.15e-04 9.82e-04 63.630 56
=== 1-s peak spectral analysis ===
(Best model with acceptable fit: PL)
Model Ph_index Ph_90err_low Ph_90err_hi Epeak Epeak_90err_low Epeak_90err_hi Norm Nomr_90err_low Norm_90err_hi chi2 dof
PL -1.702 -0.267 0.259 - - - 1.22e-02 -1.87e-03 1.84e-03 48.070 57
CPL -1.707 -0.263 0.267 9999.270 -9999.260 -9999.270 1.22e-02 -1.84e-03 1.52e-02 48.070 56
=== Fluence/Peak Flux Summary ===
Model Band1 Band2 Band3 Band4 Band5 Total
15-25 25-50 50-100 100-350 15-150 15-350 keV
Fluence PL 5.28e-07 9.18e-07 1.22e-06 3.32e-06 3.56e-06 5.99e-06 erg/cm2
90%_error_low -4.26e-08 -4.35e-08 -6.37e-08 -3.78e-07 -1.54e-07 -4.16e-07 erg/cm2
90%_error_hi 4.39e-08 4.33e-08 6.34e-08 4.10e-07 1.54e-07 4.40e-07 erg/cm2
Peak flux PL 6.10e-01 5.45e-01 3.35e-01 3.12e-01 1.62e+00 1.80e+00 ph/cm2/s
90%_error_low -1.46e-01 -8.37e-02 -6.58e-02 -1.09e-01 -2.43e-01 -2.60e-01 ph/cm2/s
90%_error_hi 1.56e-01 8.26e-02 6.44e-02 1.38e-01 2.44e-01 2.60e-01 ph/cm2/s
Fluence CPL 5.33e-07 9.15e-07 1.22e-06 3.47e-06 3.57e-06 5.87e-06 erg/cm2
90%_error_low N/A -5.65e-08 -8.12e-08 -8.58e-07 -2.23e-07 -6.52e-07 erg/cm2
90%_error_hi N/A 6.32e-08 9.28e-08 3.49e-08 2.02e-07 5.42e-07 erg/cm2
Peak flux CPL 6.10e-01 5.39e-01 3.32e-01 3.12e-01 1.62e+00 1.84e+00 ph/cm2/s
90%_error_low N/A N/A N/A N/A -2.44e-01 -3.78e-01 ph/cm2/s
90%_error_hi N/A N/A N/A N/A 2.44e-01 2.46e-01 ph/cm2/s
======================================================================
Image
Pre-slew 15.0-350.0 keV image (Event data)
#   RAcent    DECcent   POSerr    Theta     Phi              Peak Cts       SNR   Name
  336.6496     5.0273   0.0053    45.5732  -169.4404         5.8297083     36.063 TRIG_00100970

Foreground time interval of the image:
 -2.736  70.700 (delta_t =  73.436 [sec])
Background time interval of the image:
-299.472  -2.736 (delta_t = 296.736 [sec])
Light Curves
Note: The mask-weighted lightcurves have units of either count/det or counts/sec/det, where a det is 0.4 x 0.4 = 0.16 sq cm.
Full-time range; 1 s binning
Other quick-look light curves:
- 64 ms binning (zoomed)
- 16 ms binning (zoomed)
- 8 ms binning (zoomed)
- 2 ms binning (zoomed)
- SN=5 or 10 s binning (full-time range)
- Raw light curve
Spectra
- 64 ms binning (zoomed)
- 16 ms binning (zoomed)
- 8 ms binning (zoomed)
- 2 ms binning (zoomed)
- SN=5 or 10 s binning (full-time range)
- Raw light curve
Spectra
Notes:
- 1) The fitting includes the systematic errors.
- 2) When the burst includes telescope slew time periods, the fitting uses an average response file made from multiple 5-s response files through out the slew time plus single time preiod for the non-slew times, and weighted by the total counts in the corresponding time period using addrmf. An average response file is needed becuase a spectral fit using the pre-slew DRM will introduce some errors in both a spectral shape and a normalization if the PHA file contains a lot of the slew/post-slew time interval.
- 3) For fits to more complicated models (e.g. a power-law over a cutoff power-law), the BAT team has decided to require a chi-square improvement of more than 6 for each extra dof.
Time averaged spectrum fit using the average DRM
Power-law model

Time interval is from   -2.736 sec. to   70.700 sec.

Spectral model in power-law:
------------------------------------------------------------
Parameters  : value       lower 90%   higher 90%
Photon index: -1.58832     ( -0.0787919   0.0787535 )
Norm@50keV  : 5.17769E-03    ( -0.000214594   0.000214501 )
------------------------------------------------------------
#Fit statistic : Chi-Squared =          63.60 using 59 PHA bins.
# Reduced chi-squared =          1.116 for     57 degrees of freedom
# Null hypothesis probability =   2.553776e-01

Photon flux (15-150 keV)    in 73.44 sec: 0.662994 ( -0.030646  0.030778 ) ph/cm2/s
Energy fluence (15-150 keV)             : 3.56174e-06 ( -1.54035e-07  1.544e-07 ) ergs/cm2
Cutoff power-law model

Time interval is from   -2.736 sec. to   70.700 sec.
Spectral model in the cutoff power-law:
------------------------------------------------------------
Parameters  : value       lower 90%   higher 90%
Photon index: -1.58558     ( -0.0797529   0.146019 )
Epeak [keV] : 9999.36      ( -9999.36 -9999.36 )
Norm@50keV  : 5.19054E-03    ( -0.000215071   0.000981749 )
------------------------------------------------------------
#Fit statistic : Chi-Squared =          63.63 using 59 PHA bins.
# Reduced chi-squared =          1.136 for     56 degrees of freedom
# Null hypothesis probability =   2.258059e-01

Photon flux (15-150 keV)    in 73.44 sec: 0.662907 ( -0.030653  0.030782 ) ph/cm2/s
Energy fluence (15-150 keV)             : 3.57431e-06 ( -2.22552e-07  2.01783e-07 ) ergs/cm2
1-s peak spectrum fit
Power-law model

Time interval is from   22.028 sec. to   23.028 sec.

Spectral model in power-law:
------------------------------------------------------------
Parameters  : value       lower 90%   higher 90%
Photon index: -1.70232     ( -0.267409   0.25856 )
Norm@50keV  : 1.21977E-02    ( -0.00187253   0.00184137 )
------------------------------------------------------------
#Fit statistic : Chi-Squared =          48.07 using 59 PHA bins.
# Reduced chi-squared =         0.8433 for     57 degrees of freedom
# Null hypothesis probability =   7.942636e-01

Photon flux (15-150 keV)    in 1 sec: 1.62138 ( -0.24323  0.24445 ) ph/cm2/s
Energy fluence (15-150 keV)             : 1.12933e-07 ( -1.79338e-08  1.80545e-08 ) ergs/cm2
Cutoff power-law model
Time interval is from   22.028 sec. to   23.028 sec.
Spectral model in the cutoff power-law:
------------------------------------------------------------
Parameters  : value       lower 90%   higher 90%
Photon index: -1.70717     ( -0.264282   0.265099 )
Epeak [keV] : 9999.27      ( -9999.35 -9999.36 )
Norm@50keV  : 1.21775E-02    ( -0.00187313   0.0152151 )
------------------------------------------------------------
#Fit statistic : Chi-Squared =          48.07 using 59 PHA bins.
# Reduced chi-squared =         0.8585 for     56 degrees of freedom
# Null hypothesis probability =   7.653809e-01

Photon flux (15-150 keV)    in 1 sec: 1.62136 ( -0.24373  0.24421 ) ph/cm2/s
Energy fluence (15-150 keV)             : 8.26095e-08 ( -2.51066e-08  1.55789e-08 ) ergs/cm2
Time-resolved spectra
Distribution
T90 vs. Hardness ratio plot
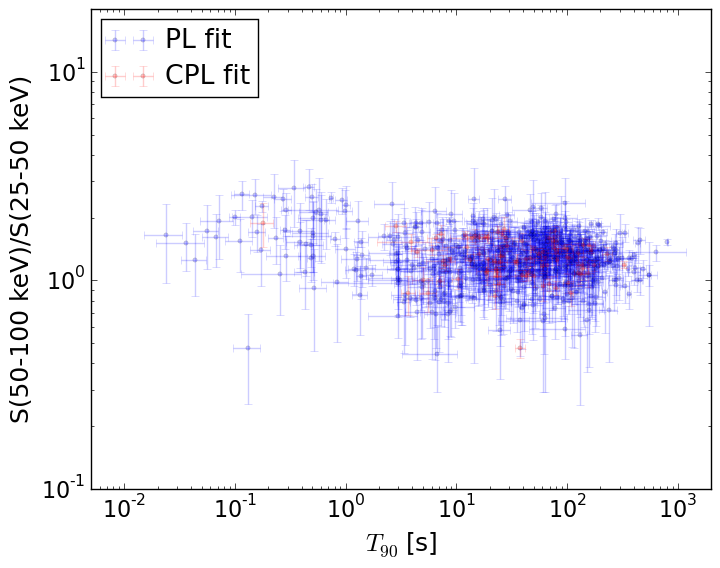
T90                                   = N/A sec.
Hardness ratio (energy fluence ratio) = N/A
S(15-50 keV) vs. S(50-150 keV) plot
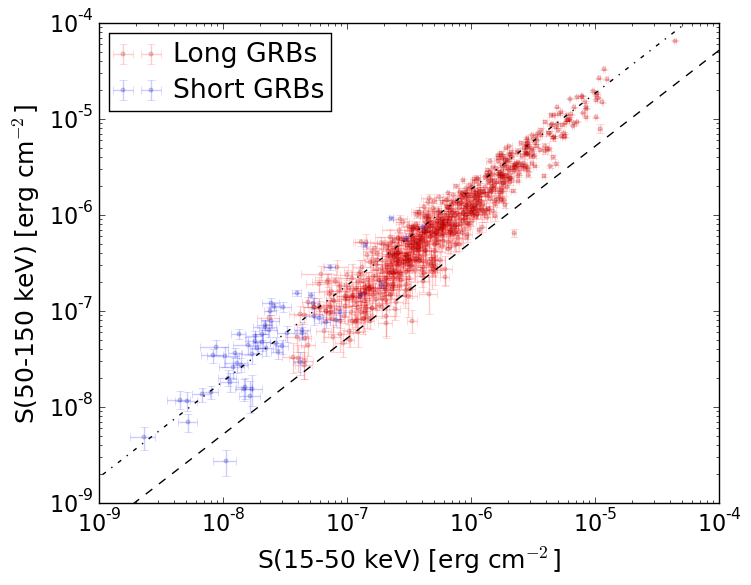
S(15-50 keV)  = N/A
S(50-150 keV) = N/A
The dash-dotted line and the dashed line traces the fluences calculated from the Band function with Epeak = 15 and 150 keV, respectively. Both lines assume a canonical values of alpha = -1 and beta = -2.5.
Mask shadow pattern
IMX = -1.002932845507641E+00, IMY = 1.869627766153752E-01
Spacecraft aspect plot
Bright source in the pre-burst/pre-slew/post-slew images
Pre-burst image of 15-350 keV band
Time interval of the image:
-299.472000 -2.736000

# RAcent  DECcent POSerr Theta    Phi  PeakCts   SNR AngSep     Name
#  [deg]    [deg]    ['] [deg]  [deg]                   [']
254.4278  35.3371    1.1  36.5   -8.5   2.4872  10.6    1.5	Her X-1
288.9045  11.0692    4.7  26.0  -87.7   0.6259   2.5    9.7	GRS 1915+105
299.5891  35.2019    0.3   0.0 -173.6   7.3392  42.1    0.1	Cyg X-1
308.0488  40.9555    1.2   8.8  114.4   1.7059   9.5    2.8	Cyg X-3
326.0411  38.4291    5.3  21.4  141.3   0.4447   2.2    8.9	Cyg X-2
352.5816  53.7612    2.7  40.9  113.9   3.0892   4.4 ------	UNKNOWN
238.8738  55.2426    2.8  45.4   23.5   1.7006   4.2 ------	UNKNOWN
245.1100  27.6905    2.5  46.5  -15.6   1.5248   4.6 ------	UNKNOWN
269.1387  11.9819    2.3  36.0  -54.8   1.4170   4.9 ------	UNKNOWN
Pre-slew background subtracted image of 15-350 keV band
Time interval of the image:
-2.736000 70.700000

# RAcent  DECcent POSerr Theta    Phi  PeakCts   SNR AngSep     Name
#  [deg]    [deg]    ['] [deg]  [deg]                   [']
254.2945  35.2148    4.0  36.7   -8.7  -0.3577  -2.9   11.1	Her X-1
288.9571  10.9910   24.3  26.1  -87.9  -0.0578  -0.5    9.7	GRS 1915+105
299.5671  35.1501    4.4   0.1  -99.2   0.2265   2.6    3.3	Cyg X-1
308.1317  40.9570 1040.3   8.8  114.7   0.0010   0.0    1.0	Cyg X-3
326.1161  38.5089    7.5  21.4  141.0  -0.1539  -1.5   11.5	Cyg X-2
336.3077  44.5708    2.1  29.4  128.0   0.7199   5.5 ------	UNKNOWN
312.9670  36.3946    2.6  10.9  147.6   0.3862   4.4 ------	UNKNOWN
333.6013  20.8822    2.6  33.0  174.3   0.4952   4.5 ------	UNKNOWN
342.9183   6.1677    2.0  49.2 -176.5   1.1387   5.7 ------	UNKNOWN
336.6496   5.0273    0.3  45.6 -169.4   5.8294  36.1 ------	UNKNOWN
Post-slew image of 15-350 keV band
Time interval of the image:
-299.472000 302.601300

# RAcent  DECcent POSerr Theta    Phi  PeakCts   SNR AngSep     Name
#  [deg]    [deg]    ['] [deg]  [deg]                   [']
254.4364  35.3609    1.0  36.5   -8.5   4.5508  11.0    1.5	Her X-1
288.9138  11.0663    3.9  26.0  -87.7   1.2570   3.0    9.9	GRS 1915+105
299.5888  35.2001    0.2   0.0 -159.7  15.4375  52.4    0.1	Cyg X-1
308.0990  40.9499    0.9   8.8  114.6   3.6541  12.2    0.5	Cyg X-3
326.1398  38.3613    3.7  21.4  141.4   1.0158   3.1    2.8	Cyg X-2
276.2867  65.5462    2.7  33.3   50.4   2.0204   4.3 ------	UNKNOWN
308.1311  37.6061    1.9   7.3  136.0   1.8487   6.1 ------	UNKNOWN
344.6697  11.2783    2.7  47.3  176.8   2.7520   4.2 ------	UNKNOWN
336.6689   5.0418    0.9  45.6 -169.5   6.7335  12.6 ------	UNKNOWN
288.5513   9.8278    2.0  27.3  -87.9   2.5169   5.7 ------	UNKNOWN
269.1397  11.9665    2.4  36.0  -54.8   2.4347   4.8 ------	UNKNOWN