Analysis Summary
Notes:
- 1) No attempt has been made to eliminate the non-significant decimal places.
- 2) This batgrbproduct analysis is done using the HEASARC data.
- 3) This batgrbproduct analysis is using the flight position for the mask-weighting calculation.
======================================================================
                  BAT GRB EVENT DATA PROCESSING REPORT
    Process Script Ver: batgrbproduct v2.46
    Process Start Time: Wed Jan 22 23:17:47 EST 2014
             Host Name: batevent1
   Current Working Dir: /local/data/batevent/batevent_reproc/trigger102861
======================================================================

  Trigger: 00102861      Segment: 000

  BAT Trigger Time: 127659155.392   [s; MET]
      Trigger Stop: 127659171.776   [s; MET]
               UTC: 2005-01-17T12:52:36.037100    [includes UTCF correction]
       Where From?: TDRSS position message

  BAT
    RA: 358.427357392695   Dec: 65.9453839266471  [deg; J2000]

     Catalogged Source?: NO
     Point Source?:      YES
     GRB Indicated?:     YES    [ by BAT flight software ]
     Image S/N Ratio:    6
     Image Trigger?:     NO
     Rate S/N Ratio:     33.9263909073747  [ if not an image trigger ]
     Image S/N Ratio:    6

  Analysis Position:   [ source = BAT ]
    RA: 358.427357392695   Dec: 65.9453839266471  [deg; J2000]

  Refined Position:   [ source = BAT pre-slew burst ]
    RA: 358.490286069384   Dec: 65.9338660392475  [deg; J2000]
        { 23h 53m 57.7s , +65d 56' 01.9" }
         +/- 0.671053534954678 [arcmin] (estimated 90% radius based on SNR)
         +/- 0.194823836335101 [arcmin] (formal 1-sigma fit error)
    SNR: 53.7784324740875

  Angular difference between the analysis and refined position is 1.687366 arcmin

  Partial Coding Fraction: 0.765625    [ including projection effects ]

  Duration
     T90: 166.648000016809 +/- 2.42293045750855
        Measured from: 27.8119999915361
                   to: 194.460000008345     [s; relative to TRIGTIME]
     T50: 83.5160000026226 +/- 2.0175430593528
        Measured from: 57.1920000016689
                   to: 140.708000004292     [s; relative to TRIGTIME]


  Fluence
     Peak Flux  (peak 1 second)
        Measured from: 87.2199999988079
                   to: 88.2199999988079     [s; relative to TRIGTIME]
     Total Fluence
        Measured from: 4.2880000025034
                   to: 215.859999999404     [s; relative to TRIGTIME]

             Band 1     Band 2     Band 3     Band 4
              15-25      25-50     50-100    100-350     keV
 Total     3.883112   5.342257   4.082423   0.818316
           0.073847   0.080249   0.074694   0.071400 [error]
 Peak      0.051677   0.099243   0.111561   0.028039
           0.006131   0.006915   0.006913   0.006128 [error]

     [ fluence units of on-axis counts / fully illuminated detector ]

======================================================================


====== Table of the duration information =============================

        Value   tstart    tstop
T100  211.572    4.288  215.860
T90   166.648   27.812  194.460
T50    83.516   57.192  140.708
Peak    1.000   87.220   88.220


====== Spectral Analysis Summary =====================================

Model      : spectral model: simple power-law (PL) and cutoff power-law (CPL)
Ph_index   : photon index: E^{Ph_index}
Ph_90err   : 90% error of the photon index
Epeak      : Epeak in keV
Epeak_90err: 90% error of Epeak
Norm       : normalization at 50 keV in both the PL model and CPL model
Nomr_90err : 90% error of the normalization
chi2       : Chi-Squared
dof        : degree of freedo

=== Time-averaged spectral analysis ===
(Best model with acceptable fit: CPL)

Model Ph_index Ph_90err_low Ph_90err_hi  Epeak  Epeak_90err_low  Epeak_90err_hi  Norm       Nomr_90err_low    Norm_90err_hi    chi2    dof
PL      -1.519    -0.042      0.042       -           -               -         4.45e-03     -9.43e-05          9.43e-05      44.490   57
CPL     -1.170    -0.173      0.180      129.986     -26.370        71.523      6.41e-03     -1.04e-03          1.30e-03      32.290   56


=== 1-s peak spectral analysis ===
(Best model with acceptable fit: PL)

Model Ph_index Ph_90err_low Ph_90err_hi  Epeak  Epeak_90err_low  Epeak_90err_hi  Norm       Nomr_90err_low    Norm_90err_hi    chi2    dof
PL      -0.994     -0.122     0.124       -           -               -         2.02e-02     -1.42e-03          1.42e-03      57.950   57
CPL     -0.554     -0.473     0.537      184.810     -71.910      -184.810      3.20e-02     -1.20e-02          2.28e-02      55.460   56


=== Fluence/Peak Flux Summary ===

              Model    Band1     Band2     Band3     Band4     Band5     Total
                       15-25     25-50    50-100    100-350    15-150    15-350    keV
Fluence         PL   1.22e-06  2.22e-06  3.10e-06  9.05e-06  8.90e-06  1.56e-05   erg/cm2
      90%_error_low -5.30e-08 -5.51e-08 -8.24e-08 -5.49e-07 -1.99e-07 -5.91e-07   erg/cm2
      90%_error_hi   5.40e-08  5.50e-08  8.22e-08  5.73e-07  2.00e-07  6.11e-07   erg/cm2
Peak flux       PL   5.12e-01  6.97e-01  7.00e-01  1.27e+00  2.32e+00  3.18e+00   ph/cm2/s
      90%_error_low -7.13e-02 -6.06e-02 -5.48e-02 -2.04e-01 -1.66e-01 -2.50e-01   ph/cm2/s
      90%_error_hi   7.49e-02  6.00e-02  5.45e-02  2.28e-01  1.66e-01  2.57e-01   ph/cm2/s

Fluence        CPL   1.12e-06  2.26e-06  3.18e-06  5.76e-06  8.66e-06  1.23e-05   erg/cm2
      90%_error_low -7.00e-08 -5.91e-08 -9.15e-08 -1.08e-06 -2.31e-07 -1.10e-06   erg/cm2
      90%_error_hi   7.15e-08  5.94e-08  9.21e-08  1.39e-06  2.30e-07  1.40e-06   erg/cm2
Peak flux      CPL   4.59e-01  7.16e-01  7.35e-01  8.14e-01  2.28e+00  2.72e+00   ph/cm2/s
      90%_error_low -8.91e-02 -6.58e-02 -6.65e-02 -2.97e-01 -1.72e-01 -3.47e-01   ph/cm2/s
      90%_error_hi   9.27e-02  6.66e-02  6.78e-02  4.79e-01  1.72e-01  6.85e-01   ph/cm2/s

======================================================================
Image
Pre-slew 15.0-350.0 keV image (Event data)
#   RAcent    DECcent   POSerr    Theta     Phi              Peak Cts       SNR   Name
  358.4903    65.9339   0.0036    25.2695   153.6072         8.2747609     53.778 TRIG_00102861

Foreground time interval of the image:
  4.288 117.709 (delta_t = 113.421 [sec])
Background time interval of the image:
-299.392   4.288 (delta_t = 303.680 [sec])
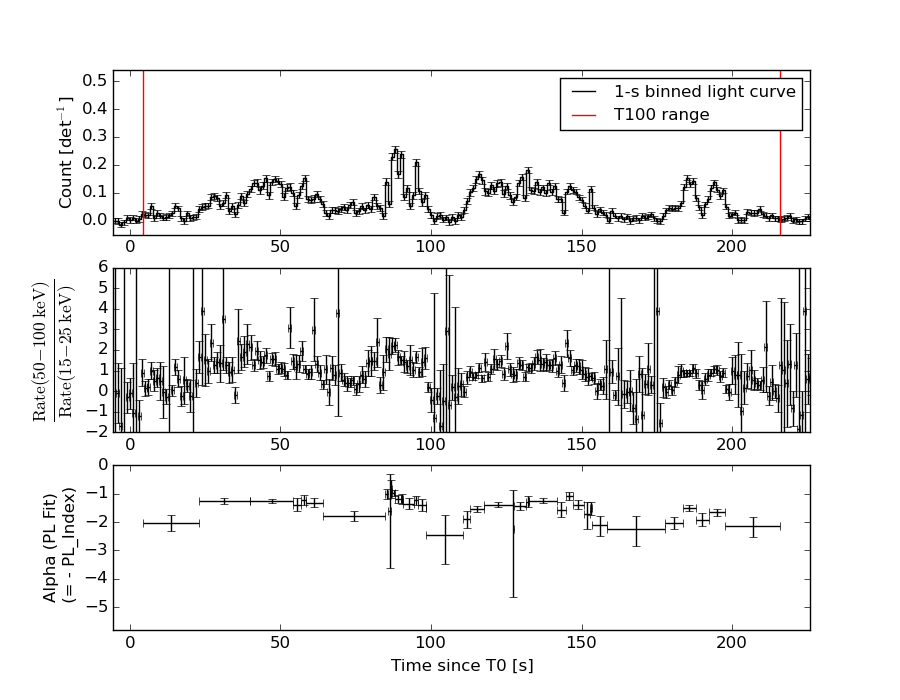
Light Curves
Note: The mask-weighted lightcurves have units of either count/det or counts/sec/det, where a det is 0.4 x 0.4 = 0.16 sq cm.
Full-time range; 1 s binning
Other quick-look light curves:
- 64 ms binning (zoomed)
- 16 ms binning (zoomed)
- 8 ms binning (zoomed)
- 2 ms binning (zoomed)
- SN=5 or 10 s binning (full-time range)
- Raw light curve
Spectra
- 64 ms binning (zoomed)
- 16 ms binning (zoomed)
- 8 ms binning (zoomed)
- 2 ms binning (zoomed)
- SN=5 or 10 s binning (full-time range)
- Raw light curve
Spectra
Notes:
- 1) The fitting includes the systematic errors.
- 2) When the burst includes telescope slew time periods, the fitting uses an average response file made from multiple 5-s response files through out the slew time plus single time preiod for the non-slew times, and weighted by the total counts in the corresponding time period using addrmf. An average response file is needed becuase a spectral fit using the pre-slew DRM will introduce some errors in both a spectral shape and a normalization if the PHA file contains a lot of the slew/post-slew time interval.
- 3) For fits to more complicated models (e.g. a power-law over a cutoff power-law), the BAT team has decided to require a chi-square improvement of more than 6 for each extra dof.
Time averaged spectrum fit using the average DRM
Power-law model
Time interval is from    4.288 sec. to  215.860 sec.

Spectral model in power-law:
------------------------------------------------------------
Parameters  : value       lower 90%   higher 90%
Photon index: -1.51866     ( -0.0416417   0.0416085 )
Norm@50keV  : 4.44597E-03    ( -9.43075e-05   9.43046e-05 )
------------------------------------------------------------
#Fit statistic : Chi-Squared =          44.49 using 59 PHA bins.
# Reduced chi-squared =         0.7805 for     57 degrees of freedom
# Null hypothesis probability =   8.862311e-01

Photon flux (15-150 keV)    in 211.6 sec: 0.557878 ( -0.013236  0.013279 ) ph/cm2/s
Energy fluence (15-150 keV)             : 8.89909e-06 ( -1.99164e-07  1.99531e-07 ) ergs/cm2
Cutoff power-law model
Time interval is from    4.288 sec. to  215.860 sec.
Spectral model in the cutoff power-law:
------------------------------------------------------------
Parameters  : value       lower 90%   higher 90%
Photon index: -1.16954     ( -0.173427   0.180318 )
Epeak [keV] : 129.986      ( -26.3697 71.5235 )
Norm@50keV  : 6.40986E-03    ( -0.00104096   0.00129822 )
------------------------------------------------------------
#Fit statistic : Chi-Squared =          32.29 using 59 PHA bins.
# Reduced chi-squared =         0.5766 for     56 degrees of freedom
# Null hypothesis probability =   9.953821e-01

Photon flux (15-150 keV)    in 211.6 sec: 0.541764 ( -0.015151  0.015229 ) ph/cm2/s
Energy fluence (15-150 keV)             : 8.66295e-06 ( -2.30655e-07  2.30001e-07 ) ergs/cm2
1-s peak spectrum fit
Power-law model
Time interval is from   87.220 sec. to   88.220 sec.

Spectral model in power-law:
------------------------------------------------------------
Parameters  : value       lower 90%   higher 90%
Photon index: -0.994284     ( -0.122169   0.124159 )
Norm@50keV  : 2.01576E-02    ( -0.00142358   0.00142113 )
------------------------------------------------------------
#Fit statistic : Chi-Squared =          57.95 using 59 PHA bins.
# Reduced chi-squared =          1.017 for     57 degrees of freedom
# Null hypothesis probability =   4.400011e-01

Photon flux (15-150 keV)    in 1 sec: 2.32003 ( -0.1658  0.16597 ) ph/cm2/s
Energy fluence (15-150 keV)             : 2.18439e-07 ( -1.7099e-08  1.72124e-08 ) ergs/cm2
Cutoff power-law model
Time interval is from   87.220 sec. to   88.220 sec.
Spectral model in the cutoff power-law:
------------------------------------------------------------
Parameters  : value       lower 90%   higher 90%
Photon index: -0.553815     ( -0.472915   0.537163 )
Epeak [keV] : 184.810      ( -71.9102 -184.81 )
Norm@50keV  : 3.19506E-02    ( -0.0120353   0.022774 )
------------------------------------------------------------
#Fit statistic : Chi-Squared =          55.46 using 59 PHA bins.
# Reduced chi-squared =         0.9903 for     56 degrees of freedom
# Null hypothesis probability =   4.953870e-01

Photon flux (15-150 keV)    in 1 sec: 2.27863 ( -0.17209  0.17189 ) ph/cm2/s
Energy fluence (15-150 keV)             : 2.13025e-07 ( -1.84308e-08  1.83359e-08 ) ergs/cm2
Time-resolved spectra
Distribution
T90 vs. Hardness ratio plot
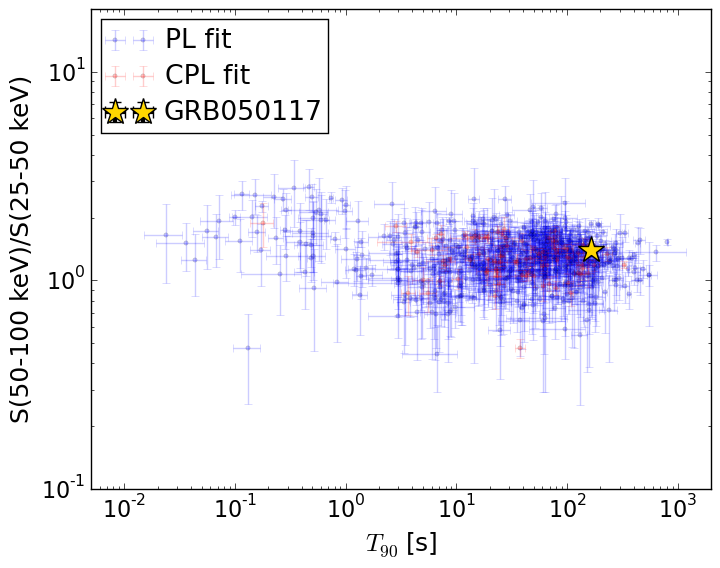
T90                                   = 166.648 sec.
Hardness ratio (energy fluence ratio) = 1.40607936107
S(15-50 keV) vs. S(50-150 keV) plot
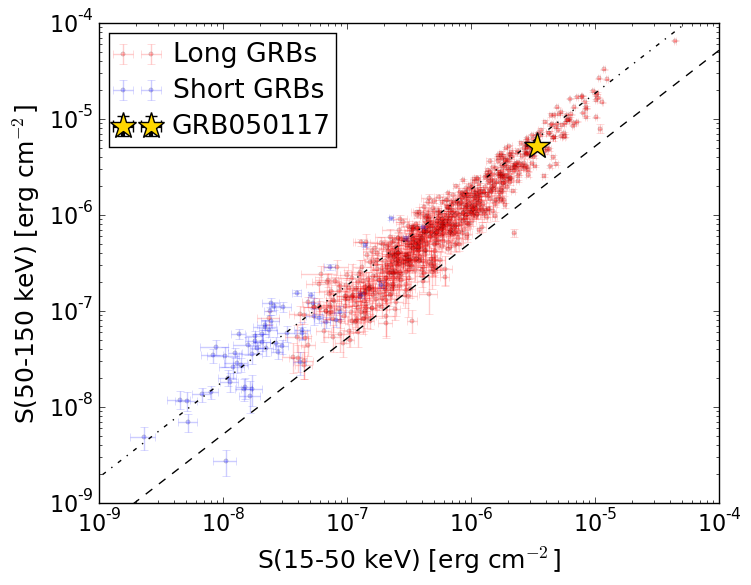
S(15-50 keV)  = 3.378758e-06
S(50-150 keV) = 5.28416e-06
The dash-dotted line and the dashed line traces the fluences calculated from the Band function with Epeak = 15 and 150 keV, respectively. Both lines assume a canonical values of alpha = -1 and beta = -2.5.
Mask shadow pattern

IMX = -4.228447235908394E-01, IMY = -2.098357256255445E-01
Spacecraft aspect plot
Bright source in the pre-burst/pre-slew/post-slew images
Pre-burst image of 15-350 keV band
Time interval of the image:
-299.392000 4.288000

# RAcent  DECcent POSerr Theta    Phi  PeakCts   SNR AngSep     Name
#  [deg]    [deg]    ['] [deg]  [deg]                   [']
254.4590  35.3065    3.4  38.2  -26.1   0.8892   3.4    2.2	Her X-1
299.5950  35.2006    0.3  29.9  -92.7  11.7362  39.9    0.2	Cyg X-1
308.2012  40.9257    2.2  25.2 -109.1   1.1847   5.2    4.4	Cyg X-3
326.3468  38.3251    2.9  32.3 -135.0   0.8724   4.0    8.2	Cyg X-2
241.3418  43.9171    2.9  36.0   -4.3   0.8887   4.0 ------	UNKNOWN
278.1359  59.6893    3.0   9.4  -21.6   0.6306   3.9 ------	UNKNOWN
338.4175  24.8380    2.4  48.8 -141.2   2.4543   4.7 ------	UNKNOWN
293.6725  24.0881    2.4  40.9  -83.3   3.4830   4.7 ------	UNKNOWN
270.2844  20.6117    2.9  47.3  -53.0   3.4587   4.1 ------	UNKNOWN
Pre-slew background subtracted image of 15-350 keV band
Time interval of the image:
4.288000 117.708590

# RAcent  DECcent POSerr Theta    Phi  PeakCts   SNR AngSep     Name
#  [deg]    [deg]    ['] [deg]  [deg]                   [']
254.3783  35.4179    5.6  38.1  -25.9  -0.3788  -2.1    6.0	Her X-1
299.6049  35.2033   13.0  29.9  -92.8  -0.1972  -0.9    0.7	Cyg X-1
308.1191  41.0665    6.4  25.1 -109.0  -0.3107  -1.8    6.8	Cyg X-3
326.0874  38.2325    3.7  32.3 -134.6   0.5263   3.1    6.7	Cyg X-2
358.4903  65.9339    0.2  25.3  153.6   8.2749  53.8 ------	UNKNOWN
234.4756  40.7647    3.1  41.5   -0.5   0.7468   3.8 ------	UNKNOWN
306.7369  33.9491    2.6  31.8 -103.8   0.9773   4.5 ------	UNKNOWN
310.0259  24.1834    2.7  41.9 -105.9   2.5199   4.4 ------	UNKNOWN
Post-slew image of 15-350 keV band
Time interval of the image:
162.508600 302.662400

# RAcent  DECcent POSerr Theta    Phi  PeakCts   SNR AngSep     Name
#  [deg]    [deg]    ['] [deg]  [deg]                   [']
308.1802  41.0904    3.8  37.2  -70.3   0.9305   3.0    8.9	Cyg X-3
326.0632  38.1967    6.8  33.3  -93.9  -0.4456  -1.7    9.1	Cyg X-2
157.2989  75.2305    2.5  38.2   44.8   1.3995   4.6 ------	UNKNOWN
 53.7256  53.1764    0.9  29.6  124.5   2.6551  12.1 ------	UNKNOWN
 28.8242  48.8436    3.0  23.3  158.6   0.5898   3.8 ------	UNKNOWN
 30.6657  16.1871    3.6  54.2  177.0   1.7669   3.2 ------	UNKNOWN
358.4589  65.9543    0.7   0.0  107.4   2.2767  17.3 ------	UNKNOWN
 22.8678  30.9563    3.2  38.0 -179.0   0.7488   3.6 ------	UNKNOWN