Analysis Summary
Notes:
- 1) No attempt has been made to eliminate the non-significant decimal places.
- 2) This batgrbproduct analysis is done using the HEASARC data.
- 3) This batgrbproduct analysis is using the flight position for the mask-weighting calculation.
======================================================================
                  BAT GRB EVENT DATA PROCESSING REPORT
    Process Script Ver: batgrbproduct v2.46
    Process Start Time: Wed Jan 22 23:13:56 EST 2014
             Host Name: batevent1
   Current Working Dir: /local/data/batevent/batevent_reproc/trigger103647
======================================================================

  Trigger: 00103647      Segment: 000

  BAT Trigger Time: 128259002.24   [s; MET]
      Trigger Stop: 128259002.752   [s; MET]
               UTC: 2005-01-24T11:30:02.876080    [includes UTCF correction]
       Where From?: TDRSS position message

  BAT
    RA: 192.87863931207   Dec: 13.0264315169755  [deg; J2000]

     Catalogged Source?: NO
     Point Source?:      YES
     GRB Indicated?:     YES    [ by BAT flight software ]
     Image S/N Ratio:    17
     Image Trigger?:     NO
     Rate S/N Ratio:     42.2729227756965  [ if not an image trigger ]
     Image S/N Ratio:    17

  Analysis Position:   [ source = BAT ]
    RA: 192.87863931207   Dec: 13.0264315169755  [deg; J2000]

  Refined Position:   [ source = BAT pre-slew burst ]
    RA: 192.875882681784   Dec: 13.0408194360131  [deg; J2000]
        { 12h 51m 30.2s , +13d 02' 26.9" }
         +/- 0.905662046806876 [arcmin] (estimated 90% radius based on SNR)
         +/- 0.308762029304607 [arcmin] (formal 1-sigma fit error)
    SNR: 35.0425161666131

  Angular difference between the analysis and refined position is 0.878185 arcmin

  Partial Coding Fraction: 0.3007812    [ including projection effects ]

  Duration
     T90: 3.9360000193119 +/- 2.01171369047144
        Measured from: -1.13199999928474
                   to: 2.80400002002716     [s; relative to TRIGTIME]
     T50: 1.88400000333786 +/- 0.384187448567675
        Measured from: 0.204000011086464
                   to: 2.08800001442432     [s; relative to TRIGTIME]


  Fluence
     Peak Flux  (peak 1 second)
        Measured from: -0.096000000834465
                   to: 0.903999999165535     [s; relative to TRIGTIME]
     Total Fluence
        Measured from: -3.89599999785423
                   to: 3.06800000369549     [s; relative to TRIGTIME]

             Band 1     Band 2     Band 3     Band 4
              15-25      25-50     50-100    100-350     keV
 Total     0.388205   0.626275   0.573996   0.138226
           0.028062   0.030724   0.027313   0.019497 [error]
 Peak      0.121458   0.263133   0.230848   0.053804
           0.012221   0.014354   0.013864   0.008869 [error]

     [ fluence units of on-axis counts / fully illuminated detector ]

======================================================================


====== Table of the duration information =============================

        Value   tstart    tstop
T100    6.964   -3.896    3.068
T90     3.936   -1.132    2.804
T50     1.884    0.204    2.088
Peak    1.000   -0.096    0.904


====== Spectral Analysis Summary =====================================

Model      : spectral model: simple power-law (PL) and cutoff power-law (CPL)
Ph_index   : photon index: E^{Ph_index}
Ph_90err   : 90% error of the photon index
Epeak      : Epeak in keV
Epeak_90err: 90% error of Epeak
Norm       : normalization at 50 keV in both the PL model and CPL model
Nomr_90err : 90% error of the normalization
chi2       : Chi-Squared
dof        : degree of freedo

=== Time-averaged spectral analysis ===
(Best model with acceptable fit: CPL)

Model Ph_index Ph_90err_low Ph_90err_hi  Epeak  Epeak_90err_low  Epeak_90err_hi  Norm       Nomr_90err_low    Norm_90err_hi    chi2    dof
PL      -1.410    -0.085      0.085       -           -               -         1.81e-02     -9.23e-04          9.23e-04      55.630   57
CPL     -0.694    -0.370      0.403      100.174     -18.189        47.820      3.90e-02     -1.25e-02          2.03e-02      43.840   56


=== 1-s peak spectral analysis ===
(Best model with acceptable fit: CPL)

Model Ph_index Ph_90err_low Ph_90err_hi  Epeak  Epeak_90err_low  Epeak_90err_hi  Norm       Nomr_90err_low    Norm_90err_hi    chi2    dof
PL      -1.313     -0.096     0.096       -           -               -         4.88e-02     -3.02e-03          3.02e-03      78.420   57
CPL     -0.281     -0.437     0.485       91.054     -13.899        28.152      1.50e-01     -5.54e-02          9.97e-02      60.060   56


=== Fluence/Peak Flux Summary ===

              Model    Band1     Band2     Band3     Band4     Band5     Total
                       15-25     25-50    50-100    100-350    15-150    15-350    keV
Fluence         PL   1.48e-07  2.87e-07  4.32e-07  1.41e-06  1.22e-06  2.28e-06   erg/cm2
      90%_error_low -1.37e-08 -1.66e-08 -2.59e-08 -1.74e-07 -6.52e-08 -1.93e-07   erg/cm2
      90%_error_hi   1.41e-08  1.66e-08  2.58e-08  1.89e-07  6.54e-08  2.04e-07   erg/cm2
Peak flux       PL   1.68e+00  1.89e+00  1.52e+00  2.04e+00  5.83e+00  7.12e+00   ph/cm2/s
      90%_error_low -1.81e-01 -1.33e-01 -1.07e-01 -2.72e-01 -3.74e-01 -4.49e-01   ph/cm2/s
      90%_error_hi   1.87e-01  1.32e-01  1.07e-01  2.94e-01  3.75e-01  4.50e-01   ph/cm2/s

Fluence        CPL   1.26e-07  3.04e-07  4.65e-07  6.23e-07  1.18e-06  1.52e-06   erg/cm2
      90%_error_low -1.69e-08 -1.93e-08 -3.12e-08 -1.92e-07 -6.89e-08 -1.99e-07   erg/cm2
      90%_error_hi   1.74e-08  1.96e-08  3.16e-08  2.99e-07  6.87e-08  2.97e-07   erg/cm2
Peak flux      CPL   1.34e+00  2.05e+00  1.72e+00  8.86e-01  5.68e+00  5.99e+00   ph/cm2/s
      90%_error_low -2.16e-01 -1.57e-01 -1.37e-01 -2.51e-01 -3.79e-01 -4.57e-01   ph/cm2/s
      90%_error_hi   2.25e-01  1.59e-01  1.40e-01  3.46e-01  3.80e-01  4.92e-01   ph/cm2/s

======================================================================
Image
Pre-slew 15.0-350.0 keV image (Event data)
#   RAcent    DECcent   POSerr    Theta     Phi              Peak Cts       SNR   Name
  192.8759    13.0408   0.0055    43.6231    16.8663         1.8252572     35.043 TRIG_00103647

Foreground time interval of the image:
 -3.896   3.068 (delta_t =   6.964 [sec])
Background time interval of the image:
-247.139  -3.896 (delta_t = 243.243 [sec])
Light Curves
Note: The mask-weighted lightcurves have units of either count/det or counts/sec/det, where a det is 0.4 x 0.4 = 0.16 sq cm.
Full-time range; 1 s binning
Other quick-look light curves:
- 64 ms binning (zoomed)
- 16 ms binning (zoomed)
- 8 ms binning (zoomed)
- 2 ms binning (zoomed)
- SN=5 or 10 s binning (full-time range)
- Raw light curve
Spectra
- 64 ms binning (zoomed)
- 16 ms binning (zoomed)
- 8 ms binning (zoomed)
- 2 ms binning (zoomed)
- SN=5 or 10 s binning (full-time range)
- Raw light curve
Spectra
Notes:
- 1) The fitting includes the systematic errors.
- 2) When the burst includes telescope slew time periods, the fitting uses an average response file made from multiple 5-s response files through out the slew time plus single time preiod for the non-slew times, and weighted by the total counts in the corresponding time period using addrmf. An average response file is needed becuase a spectral fit using the pre-slew DRM will introduce some errors in both a spectral shape and a normalization if the PHA file contains a lot of the slew/post-slew time interval.
- 3) For fits to more complicated models (e.g. a power-law over a cutoff power-law), the BAT team has decided to require a chi-square improvement of more than 6 for each extra dof.
Time averaged spectrum fit using the average DRM
Power-law model
Time interval is from   -3.896 sec. to    3.068 sec.

Spectral model in power-law:
------------------------------------------------------------
Parameters  : value       lower 90%   higher 90%
Photon index: -1.41049     ( -0.0847294   0.0849033 )
Norm@50keV  : 1.80959E-02    ( -0.000922653   0.000922652 )
------------------------------------------------------------
#Fit statistic : Chi-Squared =          55.63 using 59 PHA bins.
# Reduced chi-squared =         0.9760 for     57 degrees of freedom
# Null hypothesis probability =   5.264888e-01

Photon flux (15-150 keV)    in 6.964 sec: 2.20909 ( -0.12045  0.12073 ) ph/cm2/s
Energy fluence (15-150 keV)             : 1.21526e-06 ( -6.52309e-08  6.53852e-08 ) ergs/cm2
Cutoff power-law model
Time interval is from   -3.896 sec. to    3.068 sec.
Spectral model in the cutoff power-law:
------------------------------------------------------------
Parameters  : value       lower 90%   higher 90%
Photon index: -0.693617     ( -0.369504   0.403418 )
Epeak [keV] : 100.174      ( -18.1893 47.8201 )
Norm@50keV  : 3.90350E-02    ( -0.012499   0.0203288 )
------------------------------------------------------------
#Fit statistic : Chi-Squared =          43.84 using 59 PHA bins.
# Reduced chi-squared =         0.7829 for     56 degrees of freedom
# Null hypothesis probability =   8.810508e-01

Photon flux (15-150 keV)    in 6.964 sec: 2.14080 ( -0.12502  0.12539 ) ph/cm2/s
Energy fluence (15-150 keV)             : 1.18007e-06 ( -6.89307e-08  6.87462e-08 ) ergs/cm2
1-s peak spectrum fit
Power-law model
Time interval is from   -0.096 sec. to    0.904 sec.

Spectral model in power-law:
------------------------------------------------------------
Parameters  : value       lower 90%   higher 90%
Photon index: -1.31272     ( -0.096371   0.0964218 )
Norm@50keV  : 4.87874E-02    ( -0.00301808   0.003018 )
------------------------------------------------------------
#Fit statistic : Chi-Squared =          78.42 using 59 PHA bins.
# Reduced chi-squared =          1.376 for     57 degrees of freedom
# Null hypothesis probability =   3.149402e-02

Photon flux (15-150 keV)    in 1 sec: 5.83441 ( -0.37403  0.37452 ) ph/cm2/s
Energy fluence (15-150 keV)             : 4.80684e-07 ( -3.18559e-08  3.19531e-08 ) ergs/cm2
Cutoff power-law model

Time interval is from   -0.096 sec. to    0.904 sec.
Spectral model in the cutoff power-law:
------------------------------------------------------------
Parameters  : value       lower 90%   higher 90%
Photon index: -0.281032     ( -0.437056   0.48531 )
Epeak [keV] : 91.0542      ( -13.8988 28.1522 )
Norm@50keV  : 0.149767    ( -0.0554464   0.0997169 )
------------------------------------------------------------
#Fit statistic : Chi-Squared =          60.06 using 59 PHA bins.
# Reduced chi-squared =          1.073 for     56 degrees of freedom
# Null hypothesis probability =   3.307577e-01

Photon flux (15-150 keV)    in 1 sec: 5.67960 ( -0.37903  0.37963 ) ph/cm2/s
Energy fluence (15-150 keV)             : 4.65532e-07 ( -3.35059e-08  3.34444e-08 ) ergs/cm2
Time-resolved spectra
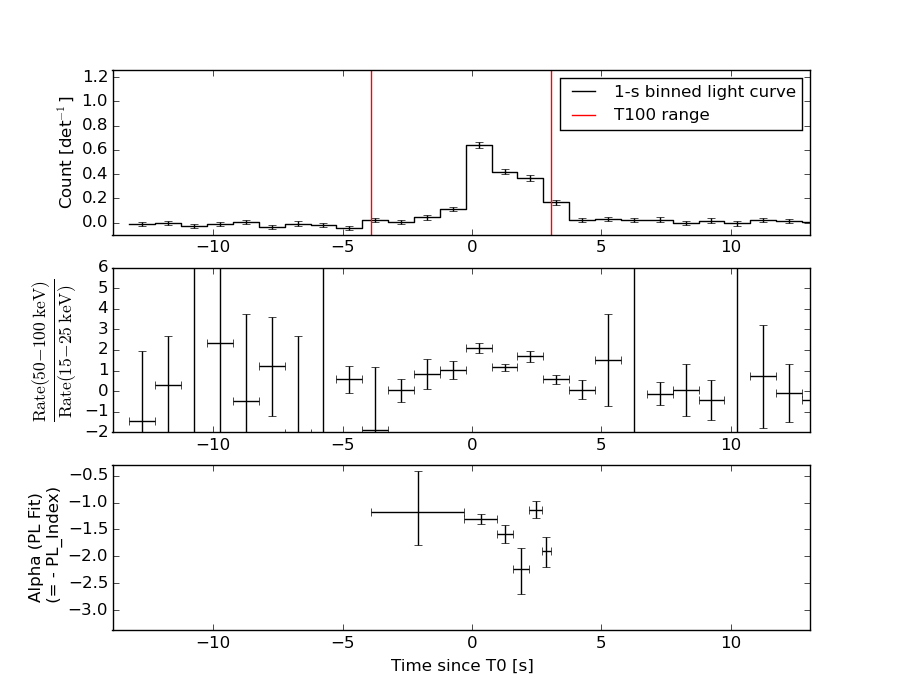
Distribution
T90 vs. Hardness ratio plot
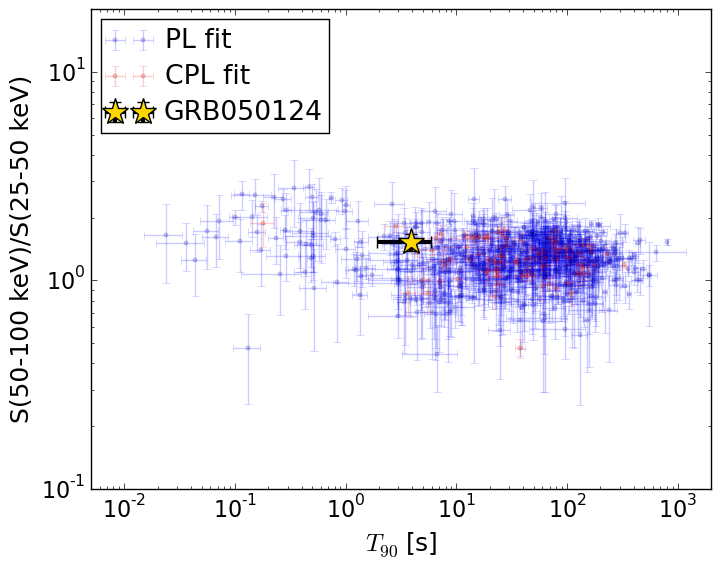
T90                                   = 3.936 sec.
Hardness ratio (energy fluence ratio) = 1.52812900433
S(15-50 keV) vs. S(50-150 keV) plot
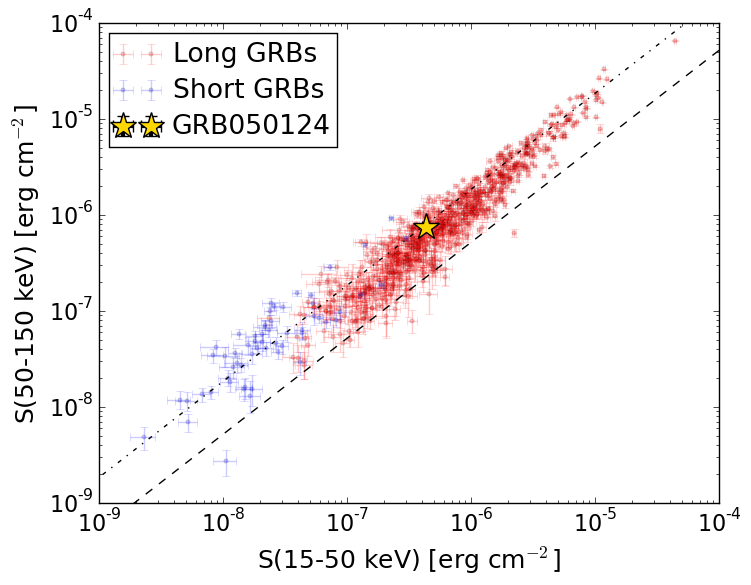
S(15-50 keV)  = 4.303443e-07
S(50-150 keV) = 7.497351e-07
The dash-dotted line and the dashed line traces the fluences calculated from the Band function with Epeak = 15 and 150 keV, respectively. Both lines assume a canonical values of alpha = -1 and beta = -2.5.
Mask shadow pattern
IMX = 9.120613952192284E-01, IMY = -2.765190724908820E-01
Spacecraft aspect plot
Bright source in the pre-burst/pre-slew/post-slew images
Pre-burst image of 15-350 keV band
Time interval of the image:
-247.139400 -3.896000

# RAcent  DECcent POSerr Theta    Phi  PeakCts   SNR AngSep     Name
#  [deg]    [deg]    ['] [deg]  [deg]                   [']
254.4970  35.1569    9.8  35.6  -84.6   0.5275   1.2   11.3	Her X-1
168.7449  65.5074    3.0  23.3  126.4   0.6618   3.9 ------	UNKNOWN
279.6693  64.7972    3.0  34.5 -144.4   0.7772   3.8 ------	UNKNOWN
Pre-slew background subtracted image of 15-350 keV band
Time interval of the image:
-3.896000 3.068000

# RAcent  DECcent POSerr Theta    Phi  PeakCts   SNR AngSep     Name
#  [deg]    [deg]    ['] [deg]  [deg]                   [']
254.2839  35.3620    7.6  35.4  -84.6   0.0840   1.5    8.6	Her X-1
104.7018  66.3484    2.3  47.2  139.4   0.5187   5.0 ------	UNKNOWN
192.8759  13.0408    0.3  43.6   16.9   1.8252  35.0 ------	UNKNOWN
 23.7566  68.7176    2.5  56.9  174.1   0.7145   4.6 ------	UNKNOWN
259.0330  49.4821    2.1  29.5 -109.7   0.2063   5.5 ------	UNKNOWN
Post-slew image of 15-350 keV band
Time interval of the image:
-299.240000 302.840000

# RAcent  DECcent POSerr Theta    Phi  PeakCts   SNR AngSep     Name
#  [deg]    [deg]    ['] [deg]  [deg]                   [']
254.4458  35.1916   18.9  35.6  -84.6   0.6207   0.6    9.1	Her X-1
151.5641  49.0652    2.5  36.0   97.7   3.3146   4.7 ------	UNKNOWN