Analysis Summary
Notes:
- 1) No attempt has been made to eliminate the non-significant decimal places.
- 2) This batgrbproduct analysis is done using the HEASARC data.
- 3) This batgrbproduct analysis is using the flight position for the mask-weighting calculation.
======================================================================
                  BAT GRB EVENT DATA PROCESSING REPORT
    Process Script Ver: batgrbproduct v2.46
    Process Start Time: Wed Jan 22 23:11:40 EST 2014
             Host Name: batevent1
   Current Working Dir: /local/data/batevent/batevent_reproc/trigger103780
======================================================================

  Trigger: 00103780      Segment: 000

  BAT Trigger Time: 128433653.44   [s; MET]
      Trigger Stop: 128433661.632   [s; MET]
               UTC: 2005-01-26T12:00:54.073440    [includes UTCF correction]
       Where From?: TDRSS position message

  BAT
    RA: 278.10963730402   Dec: 42.3890098675932  [deg; J2000]

     Catalogged Source?: NO
     Point Source?:      YES
     GRB Indicated?:     YES    [ by BAT flight software ]
     Image S/N Ratio:    12
     Image Trigger?:     NO
     Rate S/N Ratio:     12.8062484748657  [ if not an image trigger ]
     Image S/N Ratio:    12

  Analysis Position:   [ source = BAT ]
    RA: 278.10963730402   Dec: 42.3890098675932  [deg; J2000]

  Refined Position:   [ source = BAT pre-slew burst ]
    RA: 278.133001642437   Dec: 42.3940656811327  [deg; J2000]
        { 18h 32m 31.9s , +42d 23' 38.6" }
         +/- 1.625895050218 [arcmin] (estimated 90% radius based on SNR)
         +/- 0.720063313996255 [arcmin] (formal 1-sigma fit error)
    SNR: 15.1899957712221

  Angular difference between the analysis and refined position is 1.078875 arcmin

  Partial Coding Fraction: 0.421875    [ including projection effects ]

  Duration
     T90: 48 +/- 22.6274169979695
        Measured from: -11.4399999976158
                   to: 36.5600000023842     [s; relative to TRIGTIME]
     T50: 16 +/- 16
        Measured from: 4.56000000238419
                   to: 20.5600000023842     [s; relative to TRIGTIME]


  Fluence
     Peak Flux  (peak 1 second)
        Measured from: 12.0600000023842
                   to: 13.0600000023842     [s; relative to TRIGTIME]
     Total Fluence
        Measured from: -11.4399999976158
                   to: 36.5600000023842     [s; relative to TRIGTIME]

             Band 1     Band 2     Band 3     Band 4
              15-25      25-50     50-100    100-350     keV
 Total     0.239909   0.571178   0.416573   0.103568
           0.045804   0.048169   0.042418   0.035185 [error]
 Peak      0.013804   0.005300   0.017414   0.006280
           0.006629   0.007100   0.006165   0.004816 [error]

     [ fluence units of on-axis counts / fully illuminated detector ]

======================================================================


====== Table of the duration information =============================

        Value   tstart    tstop
T100   48.000  -11.440   36.560
T90    48.000  -11.440   36.560
T50    16.000    4.560   20.560
Peak    1.000   12.060   13.060


====== Spectral Analysis Summary =====================================

Model      : spectral model: simple power-law (PL) and cutoff power-law (CPL)
Ph_index   : photon index: E^{Ph_index}
Ph_90err   : 90% error of the photon index
Epeak      : Epeak in keV
Epeak_90err: 90% error of Epeak
Norm       : normalization at 50 keV in both the PL model and CPL model
Nomr_90err : 90% error of the normalization
chi2       : Chi-Squared
dof        : degree of freedo

=== Time-averaged spectral analysis ===
(Best model with acceptable fit: N/A)

Model Ph_index Ph_90err_low Ph_90err_hi  Epeak  Epeak_90err_low  Epeak_90err_hi  Norm       Nomr_90err_low    Norm_90err_hi    chi2    dof
PL      -1.352    -0.168      0.169       -           -               -         1.89e-03     -1.94e-04          1.94e-04      73.370   57
CPL     -0.592    -0.660      0.779       93.756     -26.125       231.264      4.55e-03     -2.38e-03          6.40e-03      69.400   56


=== 1-s peak spectral analysis ===
(Best model with acceptable fit: N/A)

Model Ph_index Ph_90err_low Ph_90err_hi  Epeak  Epeak_90err_low  Epeak_90err_hi  Norm       Nomr_90err_low    Norm_90err_hi    chi2    dof
PL      -1.156     -1.562     1.156       -           -               -         2.64e-03     -2.64e-03          1.32e-03      66.080   57
CPL     -1.202     -1.530     2.510     9999.350    -9999.350      -9999.350      2.66e-03        N/A               N/A         66.100   56


=== Fluence/Peak Flux Summary ===

              Model    Band1     Band2     Band3     Band4     Band5     Total
                       15-25     25-50    50-100    100-350    15-150    15-350    keV
Fluence         PL   1.01e-07  2.03e-07  3.18e-07  1.10e-06  8.85e-07  1.72e-06   erg/cm2
      90%_error_low -1.75e-08 -2.25e-08 -4.01e-08 -2.68e-07 -9.96e-08 -3.02e-07   erg/cm2
      90%_error_hi   1.83e-08  2.24e-08  3.98e-08  3.21e-07  1.00e-07  3.45e-07   erg/cm2
Peak flux       PL   7.70e-02  9.59e-02  8.69e-02  1.37e-01  3.07e-01  3.96e-01   ph/cm2/s
      90%_error_low -7.70e-02 -9.59e-02 -8.69e-02 -1.37e-01 -3.07e-01 -2.01e-01   ph/cm2/s
      90%_error_hi   1.28e-01  6.41e-02  4.71e-02  1.16e+00  1.73e-01  9.35e-01   ph/cm2/s

Fluence        CPL   8.87e-08  2.20e-07  3.35e-07  4.03e-07  8.40e-07  1.05e-06   erg/cm2
      90%_error_low -2.02e-08 -2.74e-08 -4.51e-08 -2.20e-07 -1.08e-07 -2.43e-07   erg/cm2
      90%_error_hi   2.09e-08  2.85e-08  4.59e-08  5.44e-07  1.09e-07  5.37e-07   erg/cm2
Peak flux      CPL     N/A      N/A      N/A      N/A      N/A      N/A     ph/cm2/s
      90%_error_low -7.70e-02 -9.59e-02 -8.69e-02 -1.37e-01 -3.07e-01 -2.01e-01   ph/cm2/s
      90%_error_hi   1.28e-01  6.41e-02  4.71e-02  1.16e+00  1.73e-01  9.35e-01   ph/cm2/s

======================================================================
Image
Pre-slew 15.0-350.0 keV image (Event data)
#   RAcent    DECcent   POSerr    Theta     Phi              Peak Cts       SNR   Name
  278.1330    42.3941   0.0127    30.2098   -77.9318         1.4217865     15.190 TRIG_00103780

Foreground time interval of the image:
-11.440  36.560 (delta_t =  48.000 [sec])
Background time interval of the image:
-299.440 -11.440 (delta_t = 288.000 [sec])
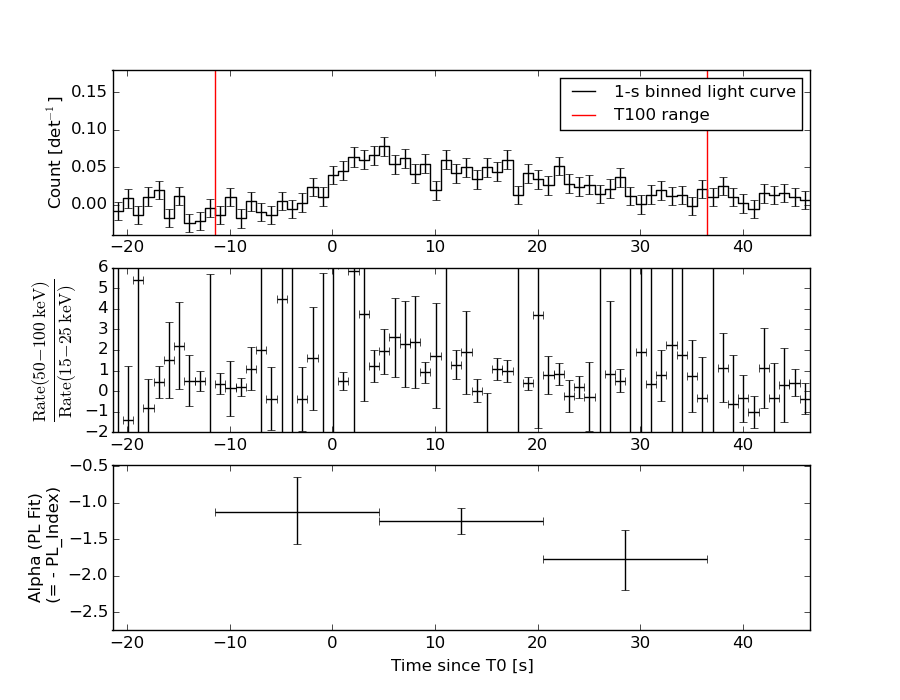
Light Curves
Note: The mask-weighted lightcurves have units of either count/det or counts/sec/det, where a det is 0.4 x 0.4 = 0.16 sq cm.
Full-time range; 1 s binning
Other quick-look light curves:
- 64 ms binning (zoomed)
- 16 ms binning (zoomed)
- 8 ms binning (zoomed)
- 2 ms binning (zoomed)
- SN=5 or 10 s binning (full-time range)
- Raw light curve
Spectra
- 64 ms binning (zoomed)
- 16 ms binning (zoomed)
- 8 ms binning (zoomed)
- 2 ms binning (zoomed)
- SN=5 or 10 s binning (full-time range)
- Raw light curve
Spectra
Notes:
- 1) The fitting includes the systematic errors.
- 2) When the burst includes telescope slew time periods, the fitting uses an average response file made from multiple 5-s response files through out the slew time plus single time preiod for the non-slew times, and weighted by the total counts in the corresponding time period using addrmf. An average response file is needed becuase a spectral fit using the pre-slew DRM will introduce some errors in both a spectral shape and a normalization if the PHA file contains a lot of the slew/post-slew time interval.
- 3) For fits to more complicated models (e.g. a power-law over a cutoff power-law), the BAT team has decided to require a chi-square improvement of more than 6 for each extra dof.
Time averaged spectrum fit using the average DRM
Power-law model
Time interval is from  -11.440 sec. to   36.560 sec.

Spectral model in power-law:
------------------------------------------------------------
Parameters  : value       lower 90%   higher 90%
Photon index: -1.35229     ( -0.168298   0.169232 )
Norm@50keV  : 1.88907E-03    ( -0.000193957   0.000193757 )
------------------------------------------------------------
#Fit statistic : Chi-Squared =          73.37 using 59 PHA bins.
# Reduced chi-squared =          1.287 for     57 degrees of freedom
# Null hypothesis probability =   7.108824e-02

Photon flux (15-150 keV)    in 48 sec: 0.227689 ( -0.023822  0.023864 ) ph/cm2/s
Energy fluence (15-150 keV)             : 8.85259e-07 ( -9.9587e-08  1.00342e-07 ) ergs/cm2
Cutoff power-law model
Time interval is from  -11.440 sec. to   36.560 sec.
Spectral model in the cutoff power-law:
------------------------------------------------------------
Parameters  : value       lower 90%   higher 90%
Photon index: -0.592022     ( -0.660261   0.779252 )
Epeak [keV] : 93.7560      ( -26.125 231.263 )
Norm@50keV  : 4.54699E-03    ( -0.00238429   0.0063992 )
------------------------------------------------------------
#Fit statistic : Chi-Squared =          69.40 using 59 PHA bins.
# Reduced chi-squared =          1.239 for     56 degrees of freedom
# Null hypothesis probability =   1.076582e-01

Photon flux (15-150 keV)    in 48 sec: 0.221539 ( -0.024402  0.024441 ) ph/cm2/s
Energy fluence (15-150 keV)             : 8.39947e-07 ( -1.08419e-07  1.08605e-07 ) ergs/cm2
1-s peak spectrum fit
Power-law model
Time interval is from   12.060 sec. to   13.060 sec.

Spectral model in power-law:
------------------------------------------------------------
Parameters  : value       lower 90%   higher 90%
Photon index: -1.15602     ( -1.56825   1.14943 )
Norm@50keV  : 2.63713E-03    ( -0.00263425   0.00132485 )
------------------------------------------------------------
#Fit statistic : Chi-Squared =          66.08 using 59 PHA bins.
# Reduced chi-squared =          1.159 for     57 degrees of freedom
# Null hypothesis probability =   1.918645e-01

Photon flux (15-150 keV)    in 1 sec: 0.306776 ( -0.306776  0.172651 ) ph/cm2/s
Energy fluence (15-150 keV)             : 2.71819e-08 ( -1.59364e-08  1.49005e-08 ) ergs/cm2
Cutoff power-law model
Time interval is from   12.060 sec. to   13.060 sec.
Spectral model in the cutoff power-law:
------------------------------------------------------------
Parameters  : value       lower 90%   higher 90%
Photon index: -4.3119     ( -1.53133   2.50862 )
Epeak [keV] : 506.120      ( -9999.36 -9999.36 )
Norm@50keV  : 1.31233E-04    (     )
------------------------------------------------------------
#Fit statistic : Chi-Squared =          64.39 using 59 PHA bins.
# Reduced chi-squared =          1.150 for     56 degrees of freedom
# Null hypothesis probability =   2.063795e-01

Photon flux (15-150 keV)    in 1 sec:  (    ) ph/cm2/s
Energy fluence (15-150 keV)             : 1.04313e-08 ( 0  0 ) ergs/cm2
Time-resolved spectra
Distribution
T90 vs. Hardness ratio plot
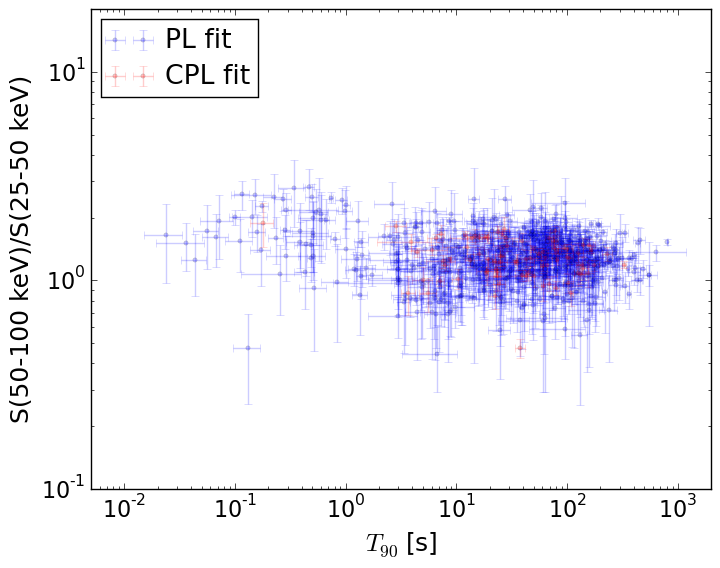
T90                                   = N/A sec.
Hardness ratio (energy fluence ratio) = N/A
S(15-50 keV) vs. S(50-150 keV) plot
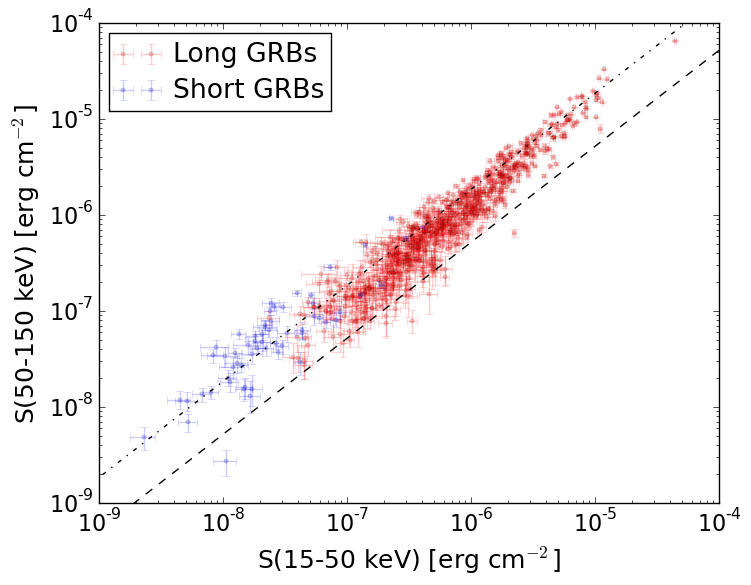
S(15-50 keV)  = N/A
S(50-150 keV) = N/A
The dash-dotted line and the dashed line traces the fluences calculated from the Band function with Epeak = 15 and 150 keV, respectively. Both lines assume a canonical values of alpha = -1 and beta = -2.5.
Mask shadow pattern
IMX = 1.217331865104005E-01, IMY = 5.693753405969912E-01
Spacecraft aspect plot
Bright source in the pre-burst/pre-slew/post-slew images
Pre-burst image of 15-350 keV band
Time interval of the image:
-299.440000 -11.440000

# RAcent  DECcent POSerr Theta    Phi  PeakCts   SNR AngSep     Name
#  [deg]    [deg]    ['] [deg]  [deg]                   [']
254.3780  35.4910    4.1  30.9  -38.8   0.5514   2.8    9.7	Her X-1
177.6491  44.5581    4.3  40.5   70.7   1.7158   2.7 ------	UNKNOWN
190.5708  33.7167    2.6  44.6   49.7   2.7855   4.5 ------	UNKNOWN
232.0837  65.9047    2.2   4.6   76.3   0.7775   5.3 ------	UNKNOWN
 22.1461  51.7034    2.6  58.4 -172.5   4.6408   4.5 ------	UNKNOWN
Pre-slew background subtracted image of 15-350 keV band
Time interval of the image:
-11.440000 36.560000

# RAcent  DECcent POSerr Theta    Phi  PeakCts   SNR AngSep     Name
#  [deg]    [deg]    ['] [deg]  [deg]                   [']
254.6115  35.4393    9.2  31.0  -39.1  -0.0965  -1.2    9.5	Her X-1
226.7240  20.7672    2.6  46.2    0.6   0.5295   4.4 ------	UNKNOWN
245.7370  38.8535    2.6  26.9  -25.2   0.2690   4.4 ------	UNKNOWN
278.1330  42.3941    0.8  30.2  -77.9   1.4216  15.2 ------	UNKNOWN
Post-slew image of 15-350 keV band
Time interval of the image:
98.460600 302.602800

# RAcent  DECcent POSerr Theta    Phi  PeakCts   SNR AngSep     Name
#  [deg]    [deg]    ['] [deg]  [deg]                   [']
254.7055  35.3538    0.0  19.4   18.4  -0.3432  -2.7   12.2	Her X-1
268.5102  -1.5277    8.1  44.8  -44.5   0.5753   1.4    9.6	SW J1753.5-0127
288.7718  10.9624    6.6  32.8  -77.8  -0.4249  -1.7    1.9	GRS 1915+105
299.5971  35.1983    0.3  18.2 -131.9   4.9651  34.6    0.4	Cyg X-1
308.1291  40.9657    1.3  22.4 -154.6   1.1712   8.8    1.2	Cyg X-3
326.2670  38.3045    7.8  36.5 -158.3   0.2926   1.5    4.6	Cyg X-2
219.5311  68.0512    2.3  39.7   91.9   2.8405   5.1 ------	UNKNOWN
303.6187   8.0069    4.0  41.1  -98.6   2.1060   2.9 ------	UNKNOWN