Analysis Summary
Notes:
- 1) No attempt has been made to eliminate the non-significant decimal places.
- 2) This batgrbproduct analysis is done using the HEASARC data.
- 3) This batgrbproduct analysis is using the flight position for the mask-weighting calculation.
======================================================================
BAT GRB EVENT DATA PROCESSING REPORT
Process Script Ver: batgrbproduct v2.46
Process Start Time: Wed Jan 22 23:09:09 EST 2014
Host Name: batevent1
Current Working Dir: /local/data/batevent/batevent_reproc/trigger103906
======================================================================
Trigger: 00103906 Segment: 000
BAT Trigger Time: 128578794.56 [s; MET]
Trigger Stop: 128578795.584 [s; MET]
UTC: 2005-01-28T04:19:55.191240 [includes UTCF correction]
Where From?: TDRSS position message
BAT
RA: 219.591125684255 Dec: -34.7619892410826 [deg; J2000]
Catalogged Source?: NO
Point Source?: YES
GRB Indicated?: YES [ by BAT flight software ]
Image S/N Ratio: 12
Image Trigger?: NO
Rate S/N Ratio: 35.5668384875575 [ if not an image trigger ]
Image S/N Ratio: 12
Analysis Position: [ source = BAT ]
RA: 219.591125684255 Dec: -34.7619892410826 [deg; J2000]
Refined Position: [ source = BAT pre-slew burst ]
RA: 219.584372813514 Dec: -34.7623161882462 [deg; J2000]
{ 14h 38m 20.2s , -34d 45' 44.3" }
+/- 1.10700367612749 [arcmin] (estimated 90% radius based on SNR)
+/- 0.306541241423414 [arcmin] (formal 1-sigma fit error)
SNR: 26.3056047168613
Angular difference between the analysis and refined position is 0.333437 arcmin
Partial Coding Fraction: 0.1035156 [ including projection effects ]
Duration
T90: 28 +/- 9.05538513813742
Measured from: -6.56000000238419
to: 21.4399999976158 [s; relative to TRIGTIME]
T50: 8 +/- 1
Measured from: -2.56000000238419
to: 5.43999999761581 [s; relative to TRIGTIME]
Fluence
Peak Flux (peak 1 second)
Measured from: 5.43999999761581
to: 6.43999999761581 [s; relative to TRIGTIME]
Total Fluence
Measured from: -7.56000000238419
to: 25.4399999976158 [s; relative to TRIGTIME]
Band 1 Band 2 Band 3 Band 4
15-25 25-50 50-100 100-350 keV
Total 1.385772 2.450934 2.426805 0.717987
0.091115 0.099820 0.092650 0.070412 [error]
Peak 0.163155 0.271392 0.330029 0.083939
0.020360 0.024358 0.024849 0.016711 [error]
[ fluence units of on-axis counts / fully illuminated detector ]
======================================================================
====== Table of the duration information =============================
Value tstart tstop
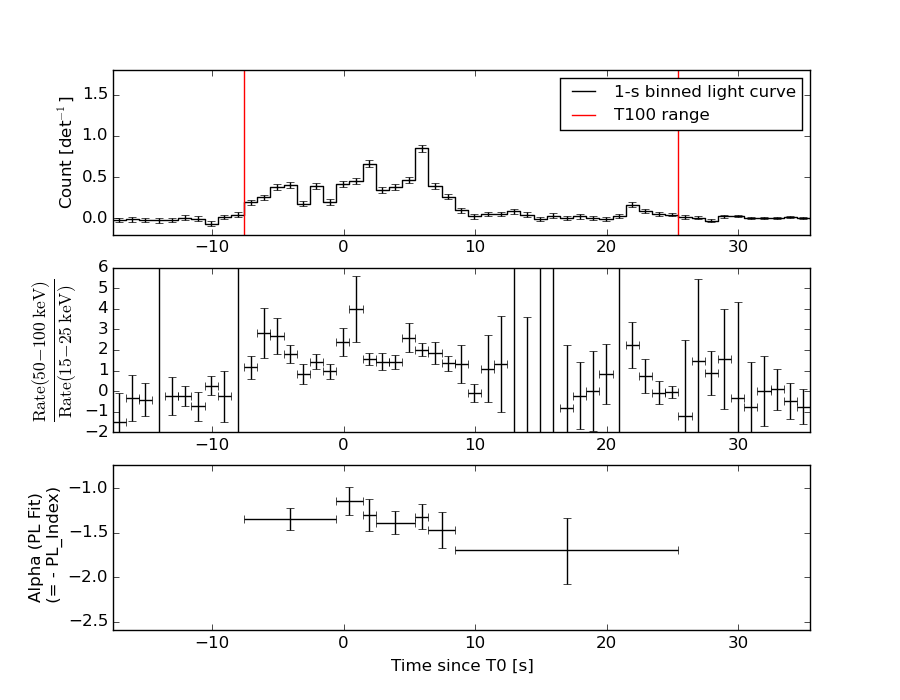
T100 33.000 -7.560 25.440
T90 28.000 -6.560 21.440
T50 8.000 -2.560 5.440
Peak 1.000 5.440 6.440
====== Spectral Analysis Summary =====================================
Model : spectral model: simple power-law (PL) and cutoff power-law (CPL)
Ph_index : photon index: E^{Ph_index}
Ph_90err : 90% error of the photon index
Epeak : Epeak in keV
Epeak_90err: 90% error of Epeak
Norm : normalization at 50 keV in both the PL model and CPL model
Nomr_90err : 90% error of the normalization
chi2 : Chi-Squared
dof : degree of freedo
=== Time-averaged spectral analysis ===
(Best model with acceptable fit: CPL)
Model Ph_index Ph_90err_low Ph_90err_hi Epeak Epeak_90err_low Epeak_90err_hi Norm Nomr_90err_low Norm_90err_hi chi2 dof
PL -1.370 -0.071 0.071 - - - 1.62e-02 -6.92e-04 6.92e-04 63.340 57
CPL -0.714 -0.311 0.335 113.155 -20.062 49.246 3.18e-02 -8.46e-03 1.24e-02 49.460 56
=== 1-s peak spectral analysis ===
(Best model with acceptable fit: N/A)
Model Ph_index Ph_90err_low Ph_90err_hi Epeak Epeak_90err_low Epeak_90err_hi Norm Nomr_90err_low Norm_90err_hi chi2 dof
PL -1.319 -0.142 0.142 - - - 6.22e-02 -5.43e-03 5.43e-03 72.380 57
CPL -0.470 -0.623 0.725 107.034 -24.554 120.997 1.46e-01 -6.63e-02 1.43e-01 66.740 56
=== Fluence/Peak Flux Summary ===
Model Band1 Band2 Band3 Band4 Band5 Total
15-25 25-50 50-100 100-350 15-150 15-350 keV
Fluence PL 6.06e-07 1.21e-06 1.87e-06 6.34e-06 5.21e-06 1.00e-05 erg/cm2
90%_error_low -4.94e-08 -6.09e-08 -8.93e-08 -6.40e-07 -2.28e-07 -6.94e-07 erg/cm2
90%_error_hi 5.07e-08 6.06e-08 8.90e-08 6.83e-07 2.28e-07 7.27e-07 erg/cm2
Peak flux PL 2.15e+00 2.41e+00 1.93e+00 2.58e+00 7.45e+00 9.08e+00 ph/cm2/s
90%_error_low -3.39e-01 -2.46e-01 -1.92e-01 -4.87e-01 -6.83e-01 -8.02e-01 ph/cm2/s
90%_error_hi 3.58e-01 2.44e-01 1.90e-01 5.43e-01 6.85e-01 8.06e-01 ph/cm2/s
Fluence CPL 5.13e-07 1.26e-06 2.01e-06 3.14e-06 5.11e-06 6.92e-06 erg/cm2
90%_error_low -6.22e-08 -6.79e-08 -1.12e-07 -8.00e-07 -2.37e-07 -8.13e-07 erg/cm2
90%_error_hi 6.42e-08 6.85e-08 1.14e-07 1.15e-06 2.37e-07 1.14e-06 erg/cm2
Peak flux CPL 1.70e+00 2.51e+00 2.17e+00 1.41e+00 7.21e+00 7.79e+00 ph/cm2/s
90%_error_low -4.42e-01 -2.74e-01 -2.59e-01 -4.86e-01 -7.06e-01 -9.03e-01 ph/cm2/s
90%_error_hi 4.69e-01 2.75e-01 2.67e-01 7.90e-01 7.08e-01 1.05e+00 ph/cm2/s
======================================================================
Image
Pre-slew 15.0-350.0 keV image (Event data)
#   RAcent    DECcent   POSerr    Theta     Phi              Peak Cts       SNR   Name
  219.5844   -34.7623   0.0072    51.4509   -36.1965         6.9394960     26.306 TRIG_00103906

Foreground time interval of the image:
 -7.560  10.941 (delta_t =  18.501 [sec])
Background time interval of the image:
-299.560  -7.560 (delta_t = 292.000 [sec])
Light Curves
Note: The mask-weighted lightcurves have units of either count/det or counts/sec/det, where a det is 0.4 x 0.4 = 0.16 sq cm.
Full-time range; 1 s binning
Other quick-look light curves:
- 64 ms binning (zoomed)
- 16 ms binning (zoomed)
- 8 ms binning (zoomed)
- 2 ms binning (zoomed)
- SN=5 or 10 s binning (full-time range)
- Raw light curve
Spectra
- 64 ms binning (zoomed)
- 16 ms binning (zoomed)
- 8 ms binning (zoomed)
- 2 ms binning (zoomed)
- SN=5 or 10 s binning (full-time range)
- Raw light curve
Spectra
Notes:
- 1) The fitting includes the systematic errors.
- 2) When the burst includes telescope slew time periods, the fitting uses an average response file made from multiple 5-s response files through out the slew time plus single time preiod for the non-slew times, and weighted by the total counts in the corresponding time period using addrmf. An average response file is needed becuase a spectral fit using the pre-slew DRM will introduce some errors in both a spectral shape and a normalization if the PHA file contains a lot of the slew/post-slew time interval.
- 3) For fits to more complicated models (e.g. a power-law over a cutoff power-law), the BAT team has decided to require a chi-square improvement of more than 6 for each extra dof.
Time averaged spectrum fit using the average DRM
Power-law model
Time interval is from   -7.560 sec. to   25.440 sec.

Spectral model in power-law:
------------------------------------------------------------
Parameters  : value       lower 90%   higher 90%
Photon index: -1.36995     ( -0.0711243   0.0714256 )
Norm@50keV  : 1.62356E-02    ( -0.000692201   0.000691907 )
------------------------------------------------------------
#Fit statistic : Chi-Squared =          63.34 using 59 PHA bins.
# Reduced chi-squared =          1.111 for     57 degrees of freedom
# Null hypothesis probability =   2.628274e-01

Photon flux (15-150 keV)    in 33 sec: 1.96417 ( -0.09165  0.09192 ) ph/cm2/s
Energy fluence (15-150 keV)             : 5.21044e-06 ( -2.27975e-07  2.28375e-07 ) ergs/cm2
Cutoff power-law model
Time interval is from   -7.560 sec. to   25.440 sec.
Spectral model in the cutoff power-law:
------------------------------------------------------------
Parameters  : value       lower 90%   higher 90%
Photon index: -0.71363     ( -0.311401   0.334615 )
Epeak [keV] : 113.155      ( -20.0623 49.2456 )
Norm@50keV  : 3.17596E-02    ( -0.00846151   0.0124245 )
------------------------------------------------------------
#Fit statistic : Chi-Squared =          49.46 using 59 PHA bins.
# Reduced chi-squared =         0.8832 for     56 degrees of freedom
# Null hypothesis probability =   7.190460e-01

Photon flux (15-150 keV)    in 33 sec: 1.90137 ( -0.09546  0.096 ) ph/cm2/s
Energy fluence (15-150 keV)             : 5.1052e-06 ( -2.37161e-07  2.36679e-07 ) ergs/cm2
1-s peak spectrum fit
Power-law model
Time interval is from    5.440 sec. to    6.440 sec.

Spectral model in power-law:
------------------------------------------------------------
Parameters  : value       lower 90%   higher 90%
Photon index: -1.31935     ( -0.142389   0.14162 )
Norm@50keV  : 6.22358E-02    ( -0.00543228   0.00543215 )
------------------------------------------------------------
#Fit statistic : Chi-Squared =          72.38 using 59 PHA bins.
# Reduced chi-squared =          1.270 for     57 degrees of freedom
# Null hypothesis probability =   8.241555e-02

Photon flux (15-150 keV)    in 1 sec: 7.45209 ( -0.68277  0.68454 ) ph/cm2/s
Energy fluence (15-150 keV)             : 6.12224e-07 ( -5.68315e-08  5.70285e-08 ) ergs/cm2
Cutoff power-law model
Time interval is from    5.440 sec. to    6.440 sec.
Spectral model in the cutoff power-law:
------------------------------------------------------------
Parameters  : value       lower 90%   higher 90%
Photon index: -0.470178     ( -0.623136   0.725412 )
Epeak [keV] : 107.034      ( -24.5538 120.997 )
Norm@50keV  : 0.145660    ( -0.0663435   0.142881 )
------------------------------------------------------------
#Fit statistic : Chi-Squared =          66.74 using 59 PHA bins.
# Reduced chi-squared =          1.192 for     56 degrees of freedom
# Null hypothesis probability =   1.541307e-01

Photon flux (15-150 keV)    in 1 sec: 7.20845 ( -0.70622  0.70791 ) ph/cm2/s
Energy fluence (15-150 keV)             : 6.05006e-07 ( -5.83174e-08  5.82329e-08 ) ergs/cm2
Time-resolved spectra
Distribution
T90 vs. Hardness ratio plot
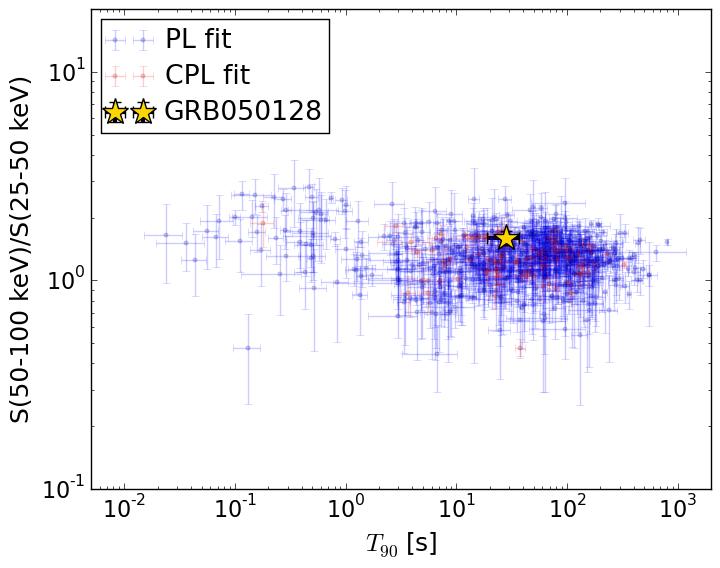
T90                                   = 28.0 sec.
Hardness ratio (energy fluence ratio) = 1.60125318493
S(15-50 keV) vs. S(50-150 keV) plot
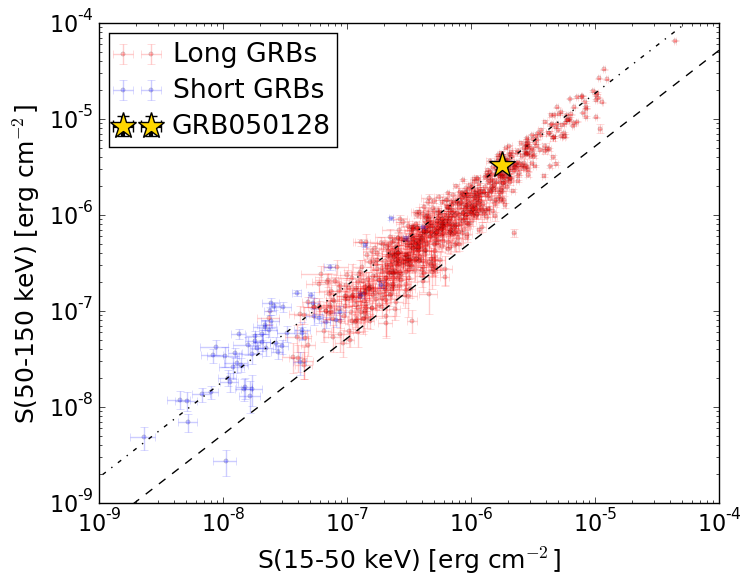
S(15-50 keV)  = 1.7684578e-06
S(50-150 keV) = 3.336805e-06
The dash-dotted line and the dashed line traces the fluences calculated from the Band function with Epeak = 15 and 150 keV, respectively. Both lines assume a canonical values of alpha = -1 and beta = -2.5.
Mask shadow pattern
IMX = 1.012749232335095E+00, IMY = 7.411253042549734E-01
Spacecraft aspect plot
Bright source in the pre-burst/pre-slew/post-slew images
Pre-burst image of 15-350 keV band
Time interval of the image:
-299.560000 -7.560000

# RAcent  DECcent POSerr Theta    Phi  PeakCts   SNR AngSep     Name
#  [deg]    [deg]    ['] [deg]  [deg]                   [']
225.7320 -30.7524    3.0  50.7  -44.5   3.3675   3.8 ------	UNKNOWN
243.3010  16.5354    2.8  43.5 -114.8   3.1535   4.1 ------	UNKNOWN
Pre-slew background subtracted image of 15-350 keV band
Time interval of the image:
-7.560000 10.940600

# RAcent  DECcent POSerr Theta    Phi  PeakCts   SNR AngSep     Name
#  [deg]    [deg]    ['] [deg]  [deg]                   [']
206.3397 -17.8048    2.3  31.4  -28.4   0.2641   5.1 ------	UNKNOWN
219.5844 -34.7623    0.4  51.5  -36.2   6.9400  26.3 ------	UNKNOWN
Post-slew image of 15-350 keV band
Time interval of the image:
75.540590 302.524600

# RAcent  DECcent POSerr Theta    Phi  PeakCts   SNR AngSep     Name
#  [deg]    [deg]    ['] [deg]  [deg]                   [']
170.3306 -60.5856    2.2  40.5   19.2   1.5625   5.2    2.3	Cen X-3
186.6784 -62.7963    2.5  34.7   10.1   1.0589   4.7    1.7	GX 301-2
244.9798 -15.6421    0.2  29.8 -139.3  10.4971  49.2    0.1	Sco X-1
256.0212 -37.7907    2.0  29.4  -89.0   1.4112   5.8    3.6	4U 1700-377
256.5429 -36.5446    6.5  29.9  -91.4   0.4408   1.8    9.0	GX 349+2
262.9812 -24.8674    4.7  38.7 -108.5   1.0463   2.4    7.5	GX 1+4
264.9228 -44.3841   51.6  35.8  -76.2  -0.0850  -0.2    8.7	4U 1735-44
263.0027 -33.7278    4.2  35.7  -94.7   1.0624   2.8    6.5	GX 354-0
259.5506   3.8937    2.7  53.9 -143.2   3.6802   4.2 ------	UNKNOWN