Analysis Summary
Notes:
- 1) No attempt has been made to eliminate the non-significant decimal places.
- 2) This batgrbproduct analysis is done using the HEASARC data.
- 3) This batgrbproduct analysis is using the flight position for the mask-weighting calculation.
======================================================================
BAT GRB EVENT DATA PROCESSING REPORT
Process Script Ver: batgrbproduct v2.46
Process Start Time: Wed Jan 22 23:04:26 EST 2014
Host Name: batevent1
Current Working Dir: /local/data/batevent/batevent_reproc/trigger106106
======================================================================
Trigger: 00106106 Segment: 000
BAT Trigger Time: 130126527.936 [s; MET]
Trigger Stop: 130126536.128 [s; MET]
UTC: 2005-02-15T02:15:28.543100 [includes UTCF correction]
Where From?: TDRSS position message
BAT
RA: 348.395966865516 Dec: 49.325242203474 [deg; J2000]
Catalogged Source?: NO
Point Source?: YES
GRB Indicated?: YES [ by BAT flight software ]
Image S/N Ratio: 9
Image Trigger?: NO
Rate S/N Ratio: 10.295630140987 [ if not an image trigger ]
Image S/N Ratio: 9
Analysis Position: [ source = BAT ]
RA: 348.395966865516 Dec: 49.325242203474 [deg; J2000]
Refined Position: [ source = BAT pre-slew burst ]
RA: 348.410939448765 Dec: 49.3224278583739 [deg; J2000]
{ 23h 13m 38.6s , +49d 19' 20.7" }
+/- 2.5860429049388 [arcmin] (estimated 90% radius based on SNR)
+/- 1.75947892123101 [arcmin] (formal 1-sigma fit error)
SNR: 7.82778288682461
Angular difference between the analysis and refined position is 0.609395 arcmin
Partial Coding Fraction: 0.640625 [ including projection effects ]
Duration
T90: 66.4120000004768 +/- 5.30720867029319
Measured from: 0.420000001788139
to: 66.832000002265 [s; relative to TRIGTIME]
T50: 49.2560000121593 +/- 7.40160522976009
Measured from: 6.1879999935627
to: 55.444000005722 [s; relative to TRIGTIME]
Fluence
Peak Flux (peak 1 second)
Measured from: 5.61999998986721
to: 6.61999998986721 [s; relative to TRIGTIME]
Total Fluence
Measured from: -0.324000000953674
to: 71.0679999887943 [s; relative to TRIGTIME]
Band 1 Band 2 Band 3 Band 4
15-25 25-50 50-100 100-350 keV
Total 0.262393 0.328918 0.289514 0.155147
0.045422 0.046365 0.040164 0.034643 [error]
Peak 0.012453 0.019569 0.025527 0.011202
0.005397 0.005695 0.005107 0.004390 [error]
[ fluence units of on-axis counts / fully illuminated detector ]
======================================================================
====== Table of the duration information =============================
Value tstart tstop
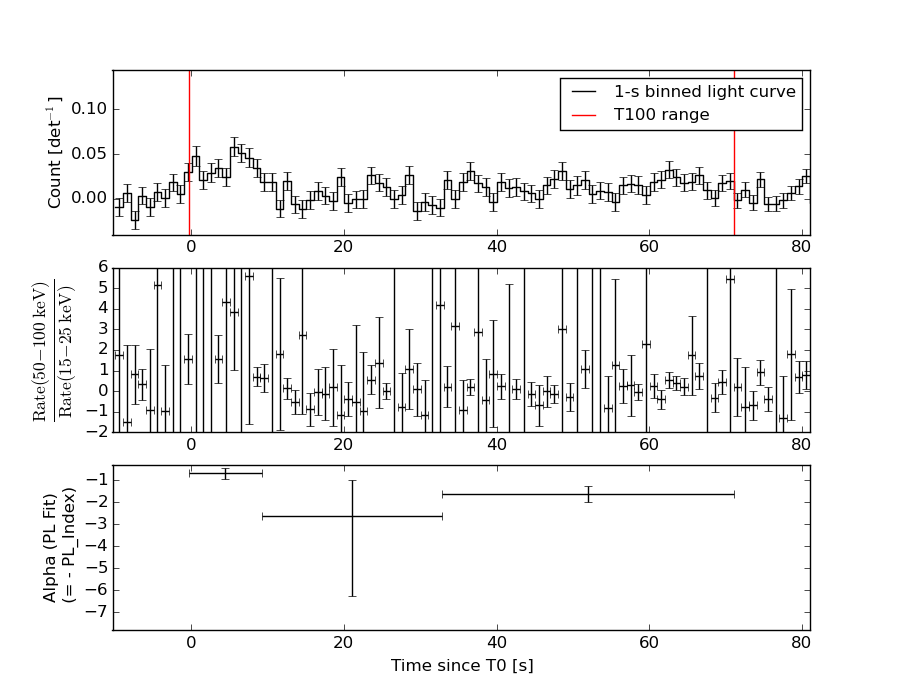
T100 71.392 -0.324 71.068
T90 66.412 0.420 66.832
T50 49.256 6.188 55.444
Peak 1.000 5.620 6.620
====== Spectral Analysis Summary =====================================
Model : spectral model: simple power-law (PL) and cutoff power-law (CPL)
Ph_index : photon index: E^{Ph_index}
Ph_90err : 90% error of the photon index
Epeak : Epeak in keV
Epeak_90err: 90% error of Epeak
Norm : normalization at 50 keV in both the PL model and CPL model
Nomr_90err : 90% error of the normalization
chi2 : Chi-Squared
dof : degree of freedo
=== Time-averaged spectral analysis ===
(Best model with acceptable fit: PL)
Model Ph_index Ph_90err_low Ph_90err_hi Epeak Epeak_90err_low Epeak_90err_hi Norm Nomr_90err_low Norm_90err_hi chi2 dof
PL -1.326 -0.261 0.267 - - - 9.11e-04 -1.24e-04 1.24e-04 43.010 57
CPL -1.343 -0.244 0.290 9999.360 -9999.360 -9999.360 9.07e-04 -1.17e-04 1.31e-04 43.060 56
=== 1-s peak spectral analysis ===
(Best model with acceptable fit: PL)
Model Ph_index Ph_90err_low Ph_90err_hi Epeak Epeak_90err_low Epeak_90err_hi Norm Nomr_90err_low Norm_90err_hi chi2 dof
PL -0.787 -0.440 0.510 - - - 4.27e-03 -1.18e-03 1.12e-03 53.680 57
CPL -0.670 0.670 2.102 691.297 -691.297 -691.297 4.78e-03 -1.58e-03 2.30e-02 53.670 56
=== Fluence/Peak Flux Summary ===
Model Band1 Band2 Band3 Band4 Band5 Total
15-25 25-50 50-100 100-350 15-150 15-350 keV
Fluence PL 7.06e-08 1.44e-07 2.30e-07 8.18e-07 6.39e-07 1.26e-06 erg/cm2
90%_error_low -1.81e-08 -2.22e-08 -4.08e-08 -2.86e-07 -9.83e-08 -3.18e-07 erg/cm2
90%_error_hi 1.93e-08 2.16e-08 4.00e-08 3.87e-07 9.94e-08 4.03e-07 erg/cm2
Peak flux PL 8.92e-02 1.38e-01 1.59e-01 3.55e-01 4.91e-01 7.41e-01 ph/cm2/s
90%_error_low -4.67e-02 -5.03e-02 -3.93e-02 -1.62e-01 -1.26e-01 -1.94e-01 ph/cm2/s
90%_error_hi 5.91e-02 4.91e-02 3.90e-02 2.50e-01 1.28e-01 2.23e-01 ph/cm2/s
Fluence CPL 7.06e-08 1.41e-07 2.24e-07 8.41e-07 6.41e-07 1.24e-06 erg/cm2
90%_error_low -1.82e-08 -1.88e-08 N/A -4.65e-07 -1.01e-07 -3.72e-07 erg/cm2
90%_error_hi 1.92e-08 2.51e-08 N/A 4.24e-07 9.63e-08 4.10e-07 erg/cm2
Peak flux CPL 8.60e-02 1.38e-01 1.62e-01 3.15e-01 4.88e-01 7.01e-01 ph/cm2/s
90%_error_low -6.36e-02 -5.22e-02 -4.14e-02 -3.15e-01 -1.30e-01 -2.90e-01 ph/cm2/s
90%_error_hi 5.03e-02 5.18e-02 5.04e-02 1.66e-01 1.29e-01 2.40e-01 ph/cm2/s
======================================================================
Image
Pre-slew 15.0-350.0 keV image (Event data)
#   RAcent    DECcent   POSerr    Theta     Phi              Peak Cts       SNR   Name
  348.4109    49.3224   0.0245    24.3862   -68.0497         0.6626284      7.828 TRIG_00106106

Foreground time interval of the image:
 -0.324  51.165 (delta_t =  51.489 [sec])
Background time interval of the image:
-119.936  -0.324 (delta_t = 119.612 [sec])
Light Curves
Note: The mask-weighted lightcurves have units of either count/det or counts/sec/det, where a det is 0.4 x 0.4 = 0.16 sq cm.
Full-time range; 1 s binning
Other quick-look light curves:
- 64 ms binning (zoomed)
- 16 ms binning (zoomed)
- 8 ms binning (zoomed)
- 2 ms binning (zoomed)
- SN=5 or 10 s binning (full-time range)
- Raw light curve
Spectra
- 64 ms binning (zoomed)
- 16 ms binning (zoomed)
- 8 ms binning (zoomed)
- 2 ms binning (zoomed)
- SN=5 or 10 s binning (full-time range)
- Raw light curve
Spectra
Notes:
- 1) The fitting includes the systematic errors.
- 2) When the burst includes telescope slew time periods, the fitting uses an average response file made from multiple 5-s response files through out the slew time plus single time preiod for the non-slew times, and weighted by the total counts in the corresponding time period using addrmf. An average response file is needed becuase a spectral fit using the pre-slew DRM will introduce some errors in both a spectral shape and a normalization if the PHA file contains a lot of the slew/post-slew time interval.
- 3) For fits to more complicated models (e.g. a power-law over a cutoff power-law), the BAT team has decided to require a chi-square improvement of more than 6 for each extra dof.
Time averaged spectrum fit using the average DRM
Power-law model
Time interval is from   -0.324 sec. to   71.068 sec.

Spectral model in power-law:
------------------------------------------------------------
Parameters  : value       lower 90%   higher 90%
Photon index: -1.3262     ( -0.261294   0.266772 )
Norm@50keV  : 9.10793E-04    ( -0.000123989   0.000123682 )
------------------------------------------------------------
#Fit statistic : Chi-Squared =          43.01 using 59 PHA bins.
# Reduced chi-squared =         0.7546 for     57 degrees of freedom
# Null hypothesis probability =   9.149243e-01

Photon flux (15-150 keV)    in 71.39 sec: 0.109203 ( -0.0152454  0.015288 ) ph/cm2/s
Energy fluence (15-150 keV)             : 6.38598e-07 ( -9.83319e-08  9.94377e-08 ) ergs/cm2
Cutoff power-law model

Time interval is from   -0.324 sec. to   71.068 sec.
Spectral model in the cutoff power-law:
------------------------------------------------------------
Parameters  : value       lower 90%   higher 90%
Photon index: -1.3237     ( -0.24527   0.288317 )
Epeak [keV] : 1.00000E+04      ( -10000 -10000 )
Norm@50keV  : 9.14342E-04    ( -0.000124702   0.00012354 )
------------------------------------------------------------
#Fit statistic : Chi-Squared =          43.04 using 59 PHA bins.
# Reduced chi-squared =         0.7686 for     56 degrees of freedom
# Null hypothesis probability =   8.979407e-01

Photon flux (15-150 keV)    in 71.39 sec: 0.109195 ( -0.0152683  0.015273 ) ph/cm2/s
Energy fluence (15-150 keV)             : 6.41323e-07 ( -1.01344e-07  9.62708e-08 ) ergs/cm2
1-s peak spectrum fit
Power-law model
Time interval is from    5.620 sec. to    6.620 sec.

Spectral model in power-law:
------------------------------------------------------------
Parameters  : value       lower 90%   higher 90%
Photon index: -0.787459     ( -0.439857   0.510085 )
Norm@50keV  : 4.26827E-03    ( -0.00118319   0.00112241 )
------------------------------------------------------------
#Fit statistic : Chi-Squared =          53.68 using 59 PHA bins.
# Reduced chi-squared =         0.9418 for     57 degrees of freedom
# Null hypothesis probability =   6.002816e-01

Photon flux (15-150 keV)    in 1 sec: 0.490789 ( -0.126387  0.128212 ) ph/cm2/s
Energy fluence (15-150 keV)             : 5.01487e-08 ( -1.26324e-08  1.27136e-08 ) ergs/cm2
Cutoff power-law model
Time interval is from    5.620 sec. to    6.620 sec.
Spectral model in the cutoff power-law:
------------------------------------------------------------
Parameters  : value       lower 90%   higher 90%
Photon index: -0.669957     ( 0.669634   2.10119 )
Epeak [keV] : 691.297      ( -690.509 -690.509 )
Norm@50keV  : 4.77755E-03    ( -0.00157757   0.0230216 )
------------------------------------------------------------
#Fit statistic : Chi-Squared =          53.67 using 59 PHA bins.
# Reduced chi-squared =         0.9583 for     56 degrees of freedom
# Null hypothesis probability =   5.637145e-01

Photon flux (15-150 keV)    in 1 sec: 0.488360 ( -0.130059  0.129221 ) ph/cm2/s
Energy fluence (15-150 keV)             : 4.9916e-08 ( -1.32697e-08  1.28971e-08 ) ergs/cm2
Time-resolved spectra
Distribution
T90 vs. Hardness ratio plot

T90                                   = 66.412 sec.
Hardness ratio (energy fluence ratio) = 1.59529115181
S(15-50 keV) vs. S(50-150 keV) plot
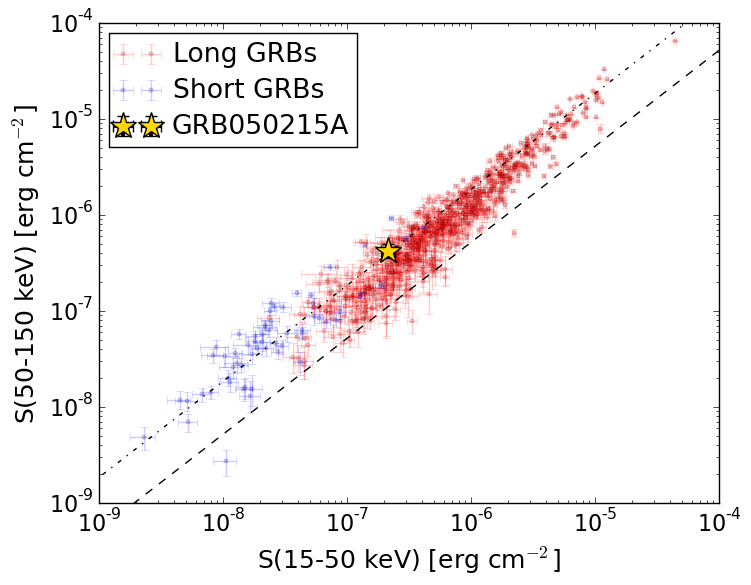
S(15-50 keV)  = 2.1479041e-07
S(50-150 keV) = 4.238066e-07
The dash-dotted line and the dashed line traces the fluences calculated from the Band function with Epeak = 15 and 150 keV, respectively. Both lines assume a canonical values of alpha = -1 and beta = -2.5.
Mask shadow pattern

IMX = 1.694554930874460E-01, IMY = 4.204669412646664E-01
Spacecraft aspect plot

Bright source in the pre-burst/pre-slew/post-slew images
Pre-burst image of 15-350 keV band
Time interval of the image:
-119.936000 -0.324000

# RAcent  DECcent POSerr Theta    Phi  PeakCts   SNR AngSep     Name
#  [deg]    [deg]    ['] [deg]  [deg]                   [']
308.0336  40.9913    7.2  49.5  -41.5   0.6736   1.6    4.2	Cyg X-3
326.0201  38.2619  114.1  43.2  -59.0   0.0391   0.1    8.0	Cyg X-2
 53.7740  53.1575    1.0  16.8  143.3   1.0986  11.2 ------	UNKNOWN
 45.7450  39.9551    2.2  24.7  177.9   0.5070   5.2 ------	UNKNOWN
 33.4168   5.2275    2.2  56.8 -153.3   2.7048   5.3 ------	UNKNOWN
Pre-slew background subtracted image of 15-350 keV band
Time interval of the image:
-0.324000 51.164600

# RAcent  DECcent POSerr Theta    Phi  PeakCts   SNR AngSep     Name
#  [deg]    [deg]    ['] [deg]  [deg]                   [']
308.0382  40.9139    5.3  49.6  -41.6  -0.5848  -2.2    4.0	Cyg X-3
326.3313  38.2240    7.0  43.1  -59.3   0.4074   1.7    9.5	Cyg X-2
257.7175  73.4689    2.0  40.5   15.0   0.6486   5.8 ------	UNKNOWN
 38.0753  29.5359    2.8  33.1 -163.6   0.3189   4.1 ------	UNKNOWN
348.4108  49.3224    1.5  24.4  -68.0   0.6626   7.8 ------	UNKNOWN
Post-slew image of 15-350 keV band
Time interval of the image:
95.964600 302.123600

# RAcent  DECcent POSerr Theta    Phi  PeakCts   SNR AngSep     Name
#  [deg]    [deg]    ['] [deg]  [deg]                   [']
299.5886  35.1992    0.3  38.0  -24.4   6.9257  35.6    0.2	Cyg X-1
308.0407  40.9325    2.0  29.3  -22.6   0.8990   5.7    3.4	Cyg X-3
326.0458  38.4294    7.7  19.4  -47.3   0.2284   1.5    8.8	Cyg X-2
 42.4158  70.3633    3.1  32.5   99.0   1.0659   3.7 ------	UNKNOWN
 32.2905  68.6278    2.8  28.6  100.5   1.0612   4.2 ------	UNKNOWN
294.9228  59.8042    3.2  31.7   18.3   0.5875   3.6 ------	UNKNOWN
327.3993  15.5517    2.9  37.9  -77.1   1.6251   4.0 ------	UNKNOWN