Analysis Summary
Notes:
- 1) No attempt has been made to eliminate the non-significant decimal places.
- 2) This batgrbproduct analysis is done using the HEASARC data.
- 3) This batgrbproduct analysis is using the flight position for the mask-weighting calculation.
======================================================================
                  BAT GRB EVENT DATA PROCESSING REPORT
    Process Script Ver: batgrbproduct v2.46
    Process Start Time: Wed Jan 22 22:58:06 EST 2014
             Host Name: batevent1
   Current Working Dir: /local/data/batevent/batevent_reproc/trigger106415
======================================================================

  Trigger: 00106415      Segment: 000

  BAT Trigger Time: 130509600.448   [s; MET]
      Trigger Stop: 130509601.472   [s; MET]
               UTC: 2005-02-19T12:40:01.049120    [includes UTCF correction]
       Where From?: TDRSS position message

  BAT
    RA: 166.429163614216   Dec: -40.6800821105552  [deg; J2000]

     Catalogged Source?: NO
     Point Source?:      YES
     GRB Indicated?:     YES    [ by BAT flight software ]
     Image S/N Ratio:    8
     Image Trigger?:     NO
     Rate S/N Ratio:     14.6969384566991  [ if not an image trigger ]
     Image S/N Ratio:    8

  Analysis Position:   [ source = BAT ]
    RA: 166.429163614216   Dec: -40.6800821105552  [deg; J2000]

  Refined Position:   [ source = BAT pre-slew burst ]
    RA: 166.412871629105   Dec: -40.6848015687723  [deg; J2000]
        { 11h 05m 39.1s , -40d 41' 05.3" }
         +/- 0.918195918923422 [arcmin] (estimated 90% radius based on SNR)
         +/- 0.325665706723692 [arcmin] (formal 1-sigma fit error)
    SNR: 34.3611640813677

  Angular difference between the analysis and refined position is 0.793529 arcmin

  Partial Coding Fraction: 0.2324219    [ including projection effects ]

  Duration
     T90: 23.8120000064373 +/- 2.25817271194732
        Measured from: -3.51999999582767
                   to: 20.2920000106096     [s; relative to TRIGTIME]
     T50: 10.0320000052452 +/- 0.8513988517486
        Measured from: 3.34000000357628
                   to: 13.3720000088215     [s; relative to TRIGTIME]


  Fluence
     Peak Flux  (peak 1 second)
        Measured from: 9.68000000715256
                   to: 10.6800000071526     [s; relative to TRIGTIME]
     Total Fluence
        Measured from: -5.80799999833107
                   to: 30.4000000059605     [s; relative to TRIGTIME]

             Band 1     Band 2     Band 3     Band 4
              15-25      25-50     50-100    100-350     keV
 Total     1.057818   2.121125   2.175980   0.383267
           0.059527   0.066701   0.060254   0.046377 [error]
 Peak      0.071675   0.146945   0.162879   0.039946
           0.011052   0.013605   0.013417   0.009178 [error]

     [ fluence units of on-axis counts / fully illuminated detector ]

======================================================================


====== Table of the duration information =============================

        Value   tstart    tstop
T100   36.208   -5.808   30.400
T90    23.812   -3.520   20.292
T50    10.032    3.340   13.372
Peak    1.000    9.680   10.680


====== Spectral Analysis Summary =====================================

Model      : spectral model: simple power-law (PL) and cutoff power-law (CPL)
Ph_index   : photon index: E^{Ph_index}
Ph_90err   : 90% error of the photon index
Epeak      : Epeak in keV
Epeak_90err: 90% error of Epeak
Norm       : normalization at 50 keV in both the PL model and CPL model
Nomr_90err : 90% error of the normalization
chi2       : Chi-Squared
dof        : degree of freedo

=== Time-averaged spectral analysis ===
(Best model with acceptable fit: CPL)

Model Ph_index Ph_90err_low Ph_90err_hi  Epeak  Epeak_90err_low  Epeak_90err_hi  Norm       Nomr_90err_low    Norm_90err_hi    chi2    dof
PL      -1.302    -0.056      0.056       -           -               -         1.19e-02     -4.08e-04          4.08e-04     100.280   57
CPL     -0.124    -0.282      0.301       91.094      -7.897        11.503      3.97e-02     -9.63e-03          1.36e-02      39.480   56


=== 1-s peak spectral analysis ===
(Best model with acceptable fit: CPL)

Model Ph_index Ph_90err_low Ph_90err_hi  Epeak  Epeak_90err_low  Epeak_90err_hi  Norm       Nomr_90err_low    Norm_90err_hi    chi2    dof
PL      -1.115     -0.143     0.146       -           -               -         3.01e-02     -2.83e-03          2.83e-03      51.720   57
CPL     -0.144     -0.623     0.724      111.107     -25.322        90.518      8.19e-02     -3.79e-02          8.37e-02      44.120   56


=== Fluence/Peak Flux Summary ===

              Model    Band1     Band2     Band3     Band4     Band5     Total
                       15-25     25-50    50-100    100-350    15-150    15-350    keV
Fluence         PL   4.58e-07  9.50e-07  1.54e-06  5.62e-06  4.27e-06  8.57e-06   erg/cm2
      90%_error_low -2.98e-08 -3.84e-08 -5.88e-08 -4.52e-07 -1.51e-07 -4.88e-07   erg/cm2
      90%_error_hi   3.04e-08  3.83e-08  5.87e-08  4.76e-07  1.51e-07  5.07e-07   erg/cm2
Peak flux       PL   8.59e-01  1.09e+00  1.00e+00  1.62e+00  3.50e+00  4.57e+00   ph/cm2/s
      90%_error_low -1.47e-01 -1.23e-01 -1.01e-01 -3.04e-01 -3.40e-01 -4.41e-01   ph/cm2/s
      90%_error_hi   1.55e-01  1.22e-01  1.00e-01  3.40e-01  3.40e-01  4.45e-01   ph/cm2/s

Fluence        CPL   3.39e-07  1.02e-06  1.74e-06  1.82e-06  4.08e-06  4.91e-06   erg/cm2
      90%_error_low -3.67e-08 -4.47e-08 -7.49e-08 -3.54e-07 -1.60e-07 -3.73e-07   erg/cm2
      90%_error_hi   3.79e-08  4.49e-08  7.56e-08  4.56e-07  1.59e-07  4.62e-07   erg/cm2
Peak flux      CPL   6.71e-01  1.16e+00  1.15e+00  7.77e-01  3.43e+00  3.75e+00   ph/cm2/s
      90%_error_low -1.76e-01 -1.41e-01 -1.35e-01 -2.81e-01 -3.43e-01 -4.48e-01   ph/cm2/s
      90%_error_hi   1.88e-01  1.43e-01  1.38e-01  4.52e-01  3.43e-01  5.33e-01   ph/cm2/s

======================================================================
Image
Pre-slew 15.0-350.0 keV image (Event data)
#   RAcent    DECcent   POSerr    Theta     Phi              Peak Cts       SNR   Name
  166.4129   -40.6848   0.0056    43.1049  -133.4711         3.8362634     34.361 TRIG_00106415

Foreground time interval of the image:
 -5.808  11.253 (delta_t =  17.061 [sec])
Background time interval of the image:
-299.448  -5.808 (delta_t = 293.640 [sec])
Light Curves
Note: The mask-weighted lightcurves have units of either count/det or counts/sec/det, where a det is 0.4 x 0.4 = 0.16 sq cm.
Full-time range; 1 s binning
Other quick-look light curves:
- 64 ms binning (zoomed)
- 16 ms binning (zoomed)
- 8 ms binning (zoomed)
- 2 ms binning (zoomed)
- SN=5 or 10 s binning (full-time range)
- Raw light curve
Spectra
- 64 ms binning (zoomed)
- 16 ms binning (zoomed)
- 8 ms binning (zoomed)
- 2 ms binning (zoomed)
- SN=5 or 10 s binning (full-time range)
- Raw light curve
Spectra
Notes:
- 1) The fitting includes the systematic errors.
- 2) When the burst includes telescope slew time periods, the fitting uses an average response file made from multiple 5-s response files through out the slew time plus single time preiod for the non-slew times, and weighted by the total counts in the corresponding time period using addrmf. An average response file is needed becuase a spectral fit using the pre-slew DRM will introduce some errors in both a spectral shape and a normalization if the PHA file contains a lot of the slew/post-slew time interval.
- 3) For fits to more complicated models (e.g. a power-law over a cutoff power-law), the BAT team has decided to require a chi-square improvement of more than 6 for each extra dof.
Time averaged spectrum fit using the average DRM
Power-law model
Time interval is from   -5.808 sec. to   30.400 sec.

Spectral model in power-law:
------------------------------------------------------------
Parameters  : value       lower 90%   higher 90%
Photon index: -1.30155     ( -0.0560307   0.0562912 )
Norm@50keV  : 1.19227E-02    ( -0.000408083   0.000407933 )
------------------------------------------------------------
#Fit statistic : Chi-Squared =         100.28 using 59 PHA bins.
# Reduced chi-squared =         1.7593 for     57 degrees of freedom
# Null hypothesis probability =   3.522957e-04

Photon flux (15-150 keV)    in 36.21 sec: 1.42284 ( -0.05239  0.05249 ) ph/cm2/s
Energy fluence (15-150 keV)             : 4.2651e-06 ( -1.50874e-07  1.50993e-07 ) ergs/cm2
Cutoff power-law model
Time interval is from   -5.808 sec. to   30.400 sec.
Spectral model in the cutoff power-law:
------------------------------------------------------------
Parameters  : value       lower 90%   higher 90%
Photon index: -0.123833     ( -0.282429   0.300897 )
Epeak [keV] : 91.0944      ( -7.89741 11.5027 )
Norm@50keV  : 3.96728E-02    ( -0.00963467   0.0135974 )
------------------------------------------------------------
#Fit statistic : Chi-Squared =          39.48 using 59 PHA bins.
# Reduced chi-squared =         0.7050 for     56 degrees of freedom
# Null hypothesis probability =   9.538556e-01

Photon flux (15-150 keV)    in 36.21 sec: 1.34507 ( -0.05466  0.05485 ) ph/cm2/s
Energy fluence (15-150 keV)             : 4.08206e-06 ( -1.59512e-07  1.59429e-07 ) ergs/cm2
1-s peak spectrum fit
Power-law model
Time interval is from    9.680 sec. to   10.680 sec.

Spectral model in power-law:
------------------------------------------------------------
Parameters  : value       lower 90%   higher 90%
Photon index: -1.11549     ( -0.143272   0.145561 )
Norm@50keV  : 3.01492E-02    ( -0.00283382   0.00282954 )
------------------------------------------------------------
#Fit statistic : Chi-Squared =          51.72 using 59 PHA bins.
# Reduced chi-squared =         0.9073 for     57 degrees of freedom
# Null hypothesis probability =   6.728603e-01

Photon flux (15-150 keV)    in 1 sec: 3.50256 ( -0.33965  0.3403 ) ph/cm2/s
Energy fluence (15-150 keV)             : 3.13711e-07 ( -3.08585e-08  3.09086e-08 ) ergs/cm2
Cutoff power-law model
Time interval is from    9.680 sec. to   10.680 sec.
Spectral model in the cutoff power-law:
------------------------------------------------------------
Parameters  : value       lower 90%   higher 90%
Photon index: -0.143732     ( -0.622642   0.724397 )
Epeak [keV] : 111.107      ( -25.3218 90.5179 )
Norm@50keV  : 8.18730E-02    ( -0.0378749   0.083705 )
------------------------------------------------------------
#Fit statistic : Chi-Squared =          44.12 using 59 PHA bins.
# Reduced chi-squared =         0.7878 for     56 degrees of freedom
# Null hypothesis probability =   8.748094e-01

Photon flux (15-150 keV)    in 1 sec: 3.43394 ( -0.34283  0.34347 ) ph/cm2/s
Energy fluence (15-150 keV)             : 3.08901e-07 ( -3.20603e-08  3.18993e-08 ) ergs/cm2
Time-resolved spectra
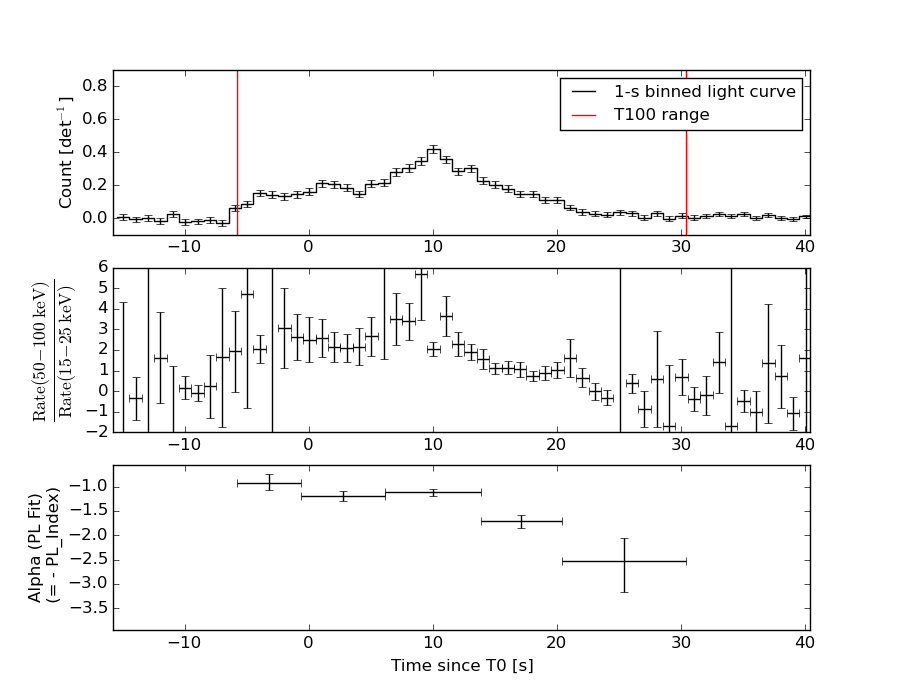
Distribution
T90 vs. Hardness ratio plot

T90                                   = 23.812 sec.
Hardness ratio (energy fluence ratio) = 1.70828436844
S(15-50 keV) vs. S(50-150 keV) plot
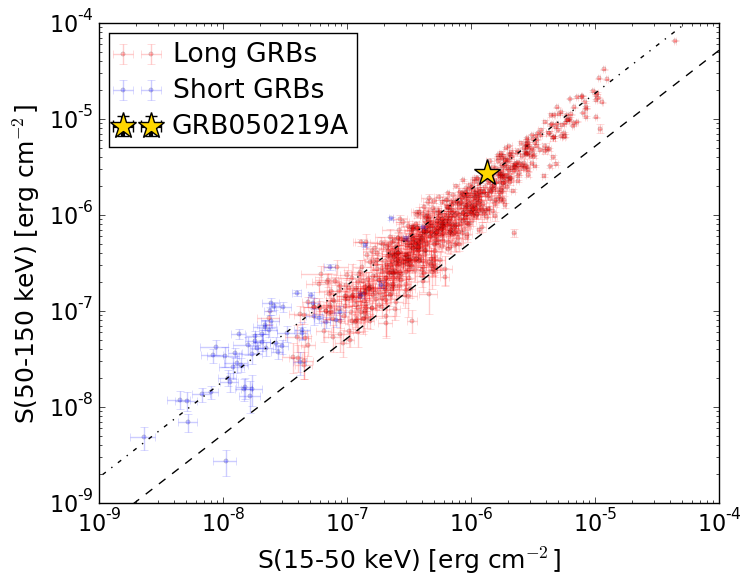
S(15-50 keV)  = 1.3552205e-06
S(50-150 keV) = 2.7268687e-06
The dash-dotted line and the dashed line traces the fluences calculated from the Band function with Epeak = 15 and 150 keV, respectively. Both lines assume a canonical values of alpha = -1 and beta = -2.5.
Mask shadow pattern
IMX = -6.439178082441278E-01, IMY = 6.792333782720322E-01
Spacecraft aspect plot
Bright source in the pre-burst/pre-slew/post-slew images
Pre-burst image of 15-350 keV band
Time interval of the image:
-299.448000 -5.808000

# RAcent  DECcent POSerr Theta    Phi  PeakCts   SNR AngSep     Name
#  [deg]    [deg]    ['] [deg]  [deg]                   [']
185.7946  -4.2541    2.6  36.7  162.1   1.1722   4.4 ------	UNKNOWN
186.8836 -31.8570    2.7  47.4 -159.2   1.4012   4.3 ------	UNKNOWN
Pre-slew background subtracted image of 15-350 keV band
Time interval of the image:
-5.808000 11.252600

# RAcent  DECcent POSerr Theta    Phi  PeakCts   SNR AngSep     Name
#  [deg]    [deg]    ['] [deg]  [deg]                   [']
104.9845  23.3051    2.6  49.1    7.8   0.4084   4.5 ------	UNKNOWN
161.9496 -21.3413    2.2  24.3 -144.3   0.2311   5.2 ------	UNKNOWN
166.4129 -40.6848    0.3  43.1 -133.5   3.8362  34.4 ------	UNKNOWN
194.7139 -40.6168    2.8  57.5 -154.3   1.0782   4.1 ------	UNKNOWN
Post-slew image of 15-350 keV band
Time interval of the image:
79.252590 302.595700

# RAcent  DECcent POSerr Theta    Phi  PeakCts   SNR AngSep     Name
#  [deg]    [deg]    ['] [deg]  [deg]                   [']
135.5212 -40.5574    0.4  23.3    6.7   4.0586  27.6    0.4	Vela X-1
169.9386 -60.5278    0.0  19.9  -78.6  -0.3531  -2.2   12.5	Cen X-3
186.6979 -62.7198    2.7  25.1  -95.5   0.8980   4.3    3.2	GX 301-2
166.7209  -0.1240    2.2  40.6  107.0   3.0660   5.4 ------	UNKNOWN
144.2678  -5.6795    2.8  40.3   71.0   2.4233   4.1 ------	UNKNOWN
189.7430  -1.5984    2.8  44.4  140.9   2.0215   4.2 ------	UNKNOWN
192.8704 -10.8457    2.4  37.9  151.9   1.3202   4.8 ------	UNKNOWN
168.2278 -27.9198    2.4  12.9  113.7   0.7278   4.9 ------	UNKNOWN
200.1669 -25.5084    2.5  31.8  178.5   0.7736   4.5 ------	UNKNOWN
223.8637 -12.8730    4.1  57.1 -175.4   2.1774   2.8 ------	UNKNOWN