Analysis Summary
Notes:
- 1) No attempt has been made to eliminate the non-significant decimal places.
- 2) This batgrbproduct analysis is done using the HEASARC data.
- 3) This batgrbproduct analysis is using the flight position for the mask-weighting calculation.
======================================================================
                  BAT GRB EVENT DATA PROCESSING REPORT
    Process Script Ver: batgrbproduct v2.46
    Process Start Time: Sat May  9 20:00:03 EDT 2015
             Host Name: bat1
   Current Working Dir: /local/data/bat1/alien/Swift_3rdBATcatalog/event/batevent_reproc/trigger106442
======================================================================

  Trigger: 00106442      Segment: 000

  BAT Trigger Time: 130539950.656   [s; MET]
      Trigger Stop: 130539951.68   [s; MET]
               UTC: 2005-02-19T21:05:51.256640    [includes UTCF correction]
       Where From?: TDRSS position message

  BAT
    RA: 81.2744828107666   Dec: -57.7615005591533  [deg; J2000]

     Catalogged Source?: NO
     Point Source?:      YES
     GRB Indicated?:     YES    [ by BAT flight software ]
     Image S/N Ratio:    17
     Image Trigger?:     NO
     Rate S/N Ratio:     88.6284378740819  [ if not an image trigger ]
     Image S/N Ratio:    17

  Analysis Position:   [ source = BAT ]
    RA: 81.2744828107666   Dec: -57.7615005591533  [deg; J2000]

  Refined Position:   [ source = BAT pre-slew burst ]
    RA: 81.2999190539987   Dec: -57.7587260653094  [deg; J2000]
        { 05h 25m 12.0s , -57d 45' 31.4" }
         +/- 0.991614765792132 [arcmin] (estimated 90% radius based on SNR)
         +/- 0.530173328050551 [arcmin] (formal 1-sigma fit error)
    SNR: 30.7852501614301

  Angular difference between the analysis and refined position is 0.831006 arcmin

  Partial Coding Fraction: 0.07226562    [ including projection effects ]

  Duration
     T90: 28.7199999988079 +/- 7.12028763106389
        Measured from: -14.3760000020266
                   to: 14.3439999967813     [s; relative to TRIGTIME]
     T50: 6.91200000047684 +/- 0.301887392005334
        Measured from: 0.631999999284744
                   to: 7.54399999976158     [s; relative to TRIGTIME]


  Fluence
     Peak Flux  (peak 1 second)
        Measured from: 2.84399999678135
                   to: 3.84399999678135     [s; relative to TRIGTIME]
     Total Fluence
        Measured from: -35.5920000076294
                   to: 38.5680000036955     [s; relative to TRIGTIME]

             Band 1     Band 2     Band 3     Band 4
              15-25      25-50     50-100    100-350     keV
 Total     4.661803   7.583146   7.475786   2.214052
           0.190190   0.206588   0.181763   0.135818 [error]
 Peak      0.550536   0.958809   0.891323   0.215203
           0.036439   0.046450   0.043734   0.025468 [error]

     [ fluence units of on-axis counts / fully illuminated detector ]

======================================================================


====== Table of the duration information =============================

        Value   tstart    tstop
T100   74.160  -35.592   38.568
T90    28.720  -14.376   14.344
T50     6.912    0.632    7.544
Peak    1.000    2.844    3.844


====== Spectral Analysis Summary =====================================

Model      : spectral model: simple power-law (PL) and cutoff power-law (CPL)
Ph_index   : photon index: E^{Ph_index}
Ph_90err   : 90% error of the photon index
Epeak      : Epeak in keV
Epeak_90err: 90% error of Epeak
Norm       : normalization at 50 keV in both the PL model and CPL model
Nomr_90err : 90% error of the normalization
chi2       : Chi-Squared
dof        : degree of freedo

=== Time-averaged spectral analysis ===
(Best model with acceptable fit: CPL)

Model Ph_index Ph_90err_low Ph_90err_hi  Epeak  Epeak_90err_low  Epeak_90err_hi  Norm       Nomr_90err_low    Norm_90err_hi    chi2    dof
PL      -1.508    -0.050      0.050       -           -               -         2.30e-02     -6.76e-04          6.76e-04      79.410   57
CPL     -0.918    -0.224      0.236      107.860     -15.095        30.233      4.14e-02     -8.12e-03          1.06e-02      57.870   56


=== 1-s peak spectral analysis ===
(Best model with acceptable fit: CPL)

Model Ph_index Ph_90err_low Ph_90err_hi  Epeak  Epeak_90err_low  Epeak_90err_hi  Norm       Nomr_90err_low    Norm_90err_hi    chi2    dof
PL      -1.571     -0.083     0.083       -           -               -         1.98e-01     -1.04e-02          1.04e-02      75.140   57
CPL     -0.866     -0.359     0.387       89.757     -14.502        36.263      4.22e-01     -1.32e-01          2.10e-01      63.260   56


=== Fluence/Peak Flux Summary ===

              Model    Band1     Band2     Band3     Band4     Band5     Total
                       15-25     25-50    50-100    100-350    15-150    15-350    keV
Fluence         PL   2.19e-06  4.01e-06  5.64e-06  1.66e-05  1.61e-05  2.85e-05   erg/cm2
      90%_error_low -1.27e-07 -1.42e-07 -1.85e-07 -1.17e-06 -4.77e-07 -1.27e-06   erg/cm2
      90%_error_hi   1.30e-07  1.42e-07  1.84e-07  1.23e-06  4.76e-07  1.31e-06   erg/cm2
Peak flux       PL   8.71e+00  8.41e+00  5.66e+00  5.96e+00  2.52e+01  2.87e+01   ph/cm2/s
      90%_error_low -7.84e-01 -4.91e-01 -3.46e-01 -6.92e-01 -1.41e+00 -1.50e+00   ph/cm2/s
      90%_error_hi   8.07e-01  4.89e-01  3.44e-01  7.37e-01  1.41e+00  1.50e+00   ph/cm2/s

Fluence        CPL   1.87e-06  4.12e-06  6.03e-06  9.13e-06  1.58e-05  2.11e-05   erg/cm2
      90%_error_low -1.65e-07 -1.55e-07 -2.36e-07 -1.69e-06 -4.96e-07 -1.72e-06   erg/cm2
      90%_error_hi   1.70e-07  1.55e-07  2.38e-07  2.18e-06  4.94e-07  2.17e-06   erg/cm2
Peak flux      CPL   7.41e+00  8.87e+00  6.23e+00  3.44e+00  2.46e+01  2.59e+01   ph/cm2/s
      90%_error_low -9.72e-01 -5.60e-01 -4.51e-01 -8.22e-01 -1.43e+00 -1.70e+00   ph/cm2/s
      90%_error_hi   1.00e+00  5.66e-01  4.58e-01  1.10e+00  1.44e+00  1.80e+00   ph/cm2/s

======================================================================
Image
Pre-slew 15.0-350.0 keV image (Event data)
#   RAcent    DECcent   POSerr    Theta     Phi              Peak Cts       SNR   Name
   81.2999   -57.7587   0.0062    54.1344   -32.6376        24.0197680     30.785 TRIG_00106442

Foreground time interval of the image:
-35.592  38.568 (delta_t =  74.160 [sec])
Background time interval of the image:
-299.656 -35.592 (delta_t = 264.064 [sec])
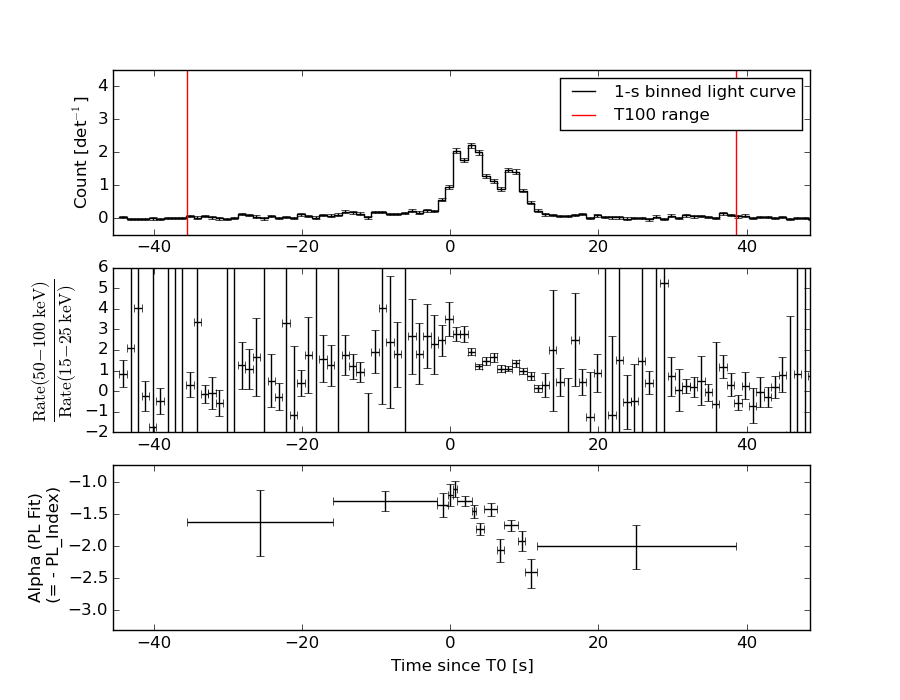
Light Curves
Note: The mask-weighted lightcurves have units of either count/det or counts/sec/det, where a det is 0.4 x 0.4 = 0.16 sq cm.
Full-time range; 1 s binning
Other quick-look light curves:
- 64 ms binning (zoomed)
- 16 ms binning (zoomed)
- 8 ms binning (zoomed)
- 2 ms binning (zoomed)
- SN=5 or 10 s binning (full-time range)
- Raw light curve
Spectra
- 64 ms binning (zoomed)
- 16 ms binning (zoomed)
- 8 ms binning (zoomed)
- 2 ms binning (zoomed)
- SN=5 or 10 s binning (full-time range)
- Raw light curve
Spectra
Notes:
- 1) The fitting includes the systematic errors.
- 2) When the burst includes telescope slew time periods, the fitting uses an average response file made from multiple 5-s response files through out the slew time plus single time preiod for the non-slew times, and weighted by the total counts in the corresponding time period using addrmf. An average response file is needed becuase a spectral fit using the pre-slew DRM will introduce some errors in both a spectral shape and a normalization if the PHA file contains a lot of the slew/post-slew time interval.
- 3) For fits to more complicated models (e.g. a power-law over a cutoff power-law), the BAT team has decided to require a chi-square improvement of more than 6 for each extra dof.
Time averaged spectrum fit using the average DRM
Power-law model
Time interval is from  -35.592 sec. to   38.568 sec.

Spectral model in power-law:
------------------------------------------------------------
Parameters  : value       lower 90%   higher 90%
Photon index: -1.50801     ( -0.0502839   0.0503775 )
Norm@50keV  : 2.29779E-02    ( -0.000676177   0.000675882 )
------------------------------------------------------------
#Fit statistic : Chi-Squared =          79.41 using 59 PHA bins.
# Reduced chi-squared =          1.393 for     57 degrees of freedom
# Null hypothesis probability =   2.656274e-02

Photon flux (15-150 keV)    in 74.16 sec: 2.87483 ( -0.09747  0.09786 ) ph/cm2/s
Energy fluence (15-150 keV)             : 1.61466e-05 ( -4.76534e-07  4.76452e-07 ) ergs/cm2
Cutoff power-law model
Time interval is from  -35.592 sec. to   38.568 sec.
Spectral model in the cutoff power-law:
------------------------------------------------------------
Parameters  : value       lower 90%   higher 90%
Photon index: -0.918029     ( -0.224444   0.235741 )
Epeak [keV] : 107.860      ( -15.0945 30.2332 )
Norm@50keV  : 4.14123E-02    ( -0.00812376   0.0106249 )
------------------------------------------------------------
#Fit statistic : Chi-Squared =          57.87 using 59 PHA bins.
# Reduced chi-squared =          1.033 for     56 degrees of freedom
# Null hypothesis probability =   4.059729e-01

Photon flux (15-150 keV)    in 74.16 sec: 2.76374 ( -0.10397  0.10464 ) ph/cm2/s
Energy fluence (15-150 keV)             : 1.58395e-05 ( -4.95777e-07  4.9443e-07 ) ergs/cm2
1-s peak spectrum fit
Power-law model
Time interval is from    2.844 sec. to    3.844 sec.

Spectral model in power-law:
------------------------------------------------------------
Parameters  : value       lower 90%   higher 90%
Photon index: -1.57056     ( -0.0833532   0.0826836 )
Norm@50keV  : 0.197801    ( -0.0103594   0.0103554 )
------------------------------------------------------------
#Fit statistic : Chi-Squared =          75.14 using 59 PHA bins.
# Reduced chi-squared =          1.318 for     57 degrees of freedom
# Null hypothesis probability =   5.401131e-02

Photon flux (15-150 keV)    in 1 sec: 25.1928 ( -1.4062  1.4091 ) ph/cm2/s
Energy fluence (15-150 keV)             : 1.85708e-06 ( -1.01058e-07  1.01223e-07 ) ergs/cm2
Cutoff power-law model
Time interval is from    2.844 sec. to    3.844 sec.
Spectral model in the cutoff power-law:
------------------------------------------------------------
Parameters  : value       lower 90%   higher 90%
Photon index: -0.86645     ( -0.359258   0.387248 )
Epeak [keV] : 89.7569      ( -14.502 36.2626 )
Norm@50keV  : 0.421750    ( -0.132345   0.209822 )
------------------------------------------------------------
#Fit statistic : Chi-Squared =          63.26 using 59 PHA bins.
# Reduced chi-squared =          1.130 for     56 degrees of freedom
# Null hypothesis probability =   2.354337e-01

Photon flux (15-150 keV)    in 1 sec: 24.5671 ( -1.4321  1.4401 ) ph/cm2/s
Energy fluence (15-150 keV)             : 1.83493e-06 ( -1.03599e-07  1.03455e-07 ) ergs/cm2
Time-resolved spectra
Distribution
T90 vs. Hardness ratio plot
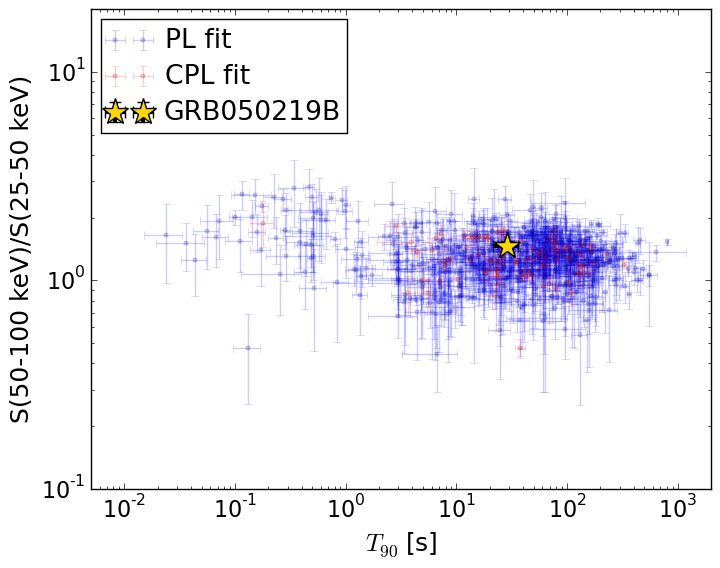
T90                                   = 28.72 sec.
Hardness ratio (energy fluence ratio) = 1.46298552886
S(15-50 keV) vs. S(50-150 keV) plot
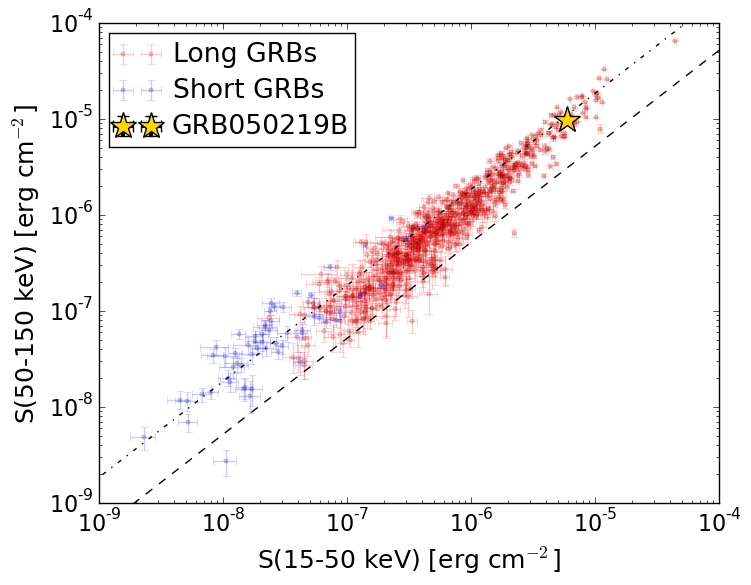
S(15-50 keV)  = 5.98976e-06
S(50-150 keV) = 9.849665e-06
The dash-dotted line and the dashed line traces the fluences calculated from the Band function with Epeak = 15 and 150 keV, respectively. Both lines assume a canonical values of alpha = -1 and beta = -2.5.
Mask shadow pattern
IMX = 1.164784773247364E+00, IMY = 7.459877691451905E-01
Spacecraft aspect plot
Bright source in the pre-burst/pre-slew/post-slew images
Pre-burst image of 15-350 keV band
Time interval of the image:
-299.656000 -35.592000

# RAcent  DECcent POSerr Theta    Phi  PeakCts   SNR AngSep     Name
#  [deg]    [deg]    ['] [deg]  [deg]                   [']
135.5170 -40.5458    0.6  23.3    6.5   3.2639  19.9    0.7	Vela X-1
170.1994 -60.6327    2.7  20.1  -79.0   0.7889   4.2    3.5	Cen X-3
186.4671 -62.7311    3.5  25.1  -95.4   0.7453   3.3    5.7	GX 301-2
207.2052 -54.8440    2.6  30.3 -121.9   0.9206   4.4 ------	UNKNOWN
119.2734 -81.0433    3.8  43.6  -64.1   2.6760   3.0 ------	UNKNOWN
Pre-slew background subtracted image of 15-350 keV band
Time interval of the image:
-35.592000 38.568000

# RAcent  DECcent POSerr Theta    Phi  PeakCts   SNR AngSep     Name
#  [deg]    [deg]    ['] [deg]  [deg]                   [']
135.5087 -40.5363    1.8  23.3    6.5   0.7337   6.4    1.4	Vela X-1
170.0745 -60.6577    7.6  20.1  -78.9  -0.1989  -1.5    7.4	Cen X-3
187.0786 -62.8216    9.0  25.3  -95.8   0.1770   1.3   12.0	GX 301-2
223.0859 -21.1980    2.7  51.4 -168.0   0.8763   4.3 ------	UNKNOWN
 81.2999 -57.7587    0.4  54.1  -32.6  24.0178  29.8 ------	UNKNOWN
Post-slew image of 15-350 keV band
Time interval of the image: