Analysis Summary
Notes:
- 1) No attempt has been made to eliminate the non-significant decimal places.
- 2) This batgrbproduct analysis is done using the HEASARC data.
- 3) This batgrbproduct analysis is using the flight position for the mask-weighting calculation.
======================================================================
                  BAT GRB EVENT DATA PROCESSING REPORT
    Process Script Ver: batgrbproduct v2.46
    Process Start Time: Wed Jan 22 22:52:16 EST 2014
             Host Name: batevent1
   Current Working Dir: /local/data/batevent/batevent_reproc/trigger106709
======================================================================

  Trigger: 00106709      Segment: 000

  BAT Trigger Time: 130820945.472   [s; MET]
      Trigger Stop: 130820953.664   [s; MET]
               UTC: 2005-02-23T03:09:06.068200    [includes UTCF correction]
       Where From?: TDRSS position message

  BAT
    RA: 271.381776797387   Dec: -62.4986306585262  [deg; J2000]

     Catalogged Source?: NO
     Point Source?:      YES
     GRB Indicated?:     YES    [ by BAT flight software ]
     Image S/N Ratio:    9
     Image Trigger?:     NO
     Rate S/N Ratio:     11.2694276695846  [ if not an image trigger ]
     Image S/N Ratio:    9

  Analysis Position:   [ source = BAT ]
    RA: 271.381776797387   Dec: -62.4986306585262  [deg; J2000]

  Refined Position:   [ source = BAT pre-slew burst ]
    RA: 271.391844676342   Dec: -62.4682880763819  [deg; J2000]
        { 18h 05m 34.0s , -62d 28' 05.8" }
         +/- 1.526275696313 [arcmin] (estimated 90% radius based on SNR)
         +/- 0.41376340069525 [arcmin] (formal 1-sigma fit error)
    SNR: 16.6259143505157

  Angular difference between the analysis and refined position is 1.841822 arcmin

  Partial Coding Fraction: 0.65625    [ including projection effects ]

  Duration
     T90: 22.6800000071526 +/- 4.48138550679673
        Measured from: -7.90800000727177
                   to: 14.7719999998808     [s; relative to TRIGTIME]
     T50: 10.5999999940395 +/- 2.15224254049003
        Measured from: -0.563999995589256
                   to: 10.0359999984503     [s; relative to TRIGTIME]


  Fluence
     Peak Flux  (peak 1 second)
        Measured from: 1.64399999380112
                   to: 2.64399999380112     [s; relative to TRIGTIME]
     Total Fluence
        Measured from: -12.0080000013113
                   to: 16.5680000036955     [s; relative to TRIGTIME]

             Band 1     Band 2     Band 3     Band 4
              15-25      25-50     50-100    100-350     keV
 Total     0.347982   0.435996   0.257790   0.053473
           0.031541   0.033076   0.029132   0.026920 [error]
 Peak      0.023798   0.024705   0.025496   0.015666
           0.005980   0.006243   0.005630   0.005003 [error]

     [ fluence units of on-axis counts / fully illuminated detector ]

======================================================================


====== Table of the duration information =============================

        Value   tstart    tstop
T100   28.576  -12.008   16.568
T90    22.680   -7.908   14.772
T50    10.600   -0.564   10.036
Peak    1.000    1.644    2.644


====== Spectral Analysis Summary =====================================

Model      : spectral model: simple power-law (PL) and cutoff power-law (CPL)
Ph_index   : photon index: E^{Ph_index}
Ph_90err   : 90% error of the photon index
Epeak      : Epeak in keV
Epeak_90err: 90% error of Epeak
Norm       : normalization at 50 keV in both the PL model and CPL model
Nomr_90err : 90% error of the normalization
chi2       : Chi-Squared
dof        : degree of freedo

=== Time-averaged spectral analysis ===
(Best model with acceptable fit: PL)

Model Ph_index Ph_90err_low Ph_90err_hi  Epeak  Epeak_90err_low  Epeak_90err_hi  Norm       Nomr_90err_low    Norm_90err_hi    chi2    dof
PL      -1.818    -0.163      0.158       -           -               -         2.46e-03     -2.47e-04          2.43e-04      49.430   57
CPL     -1.460    -0.657      0.729       68.099      N/A           N/A         3.87e-03        N/A               N/A         48.520   56


=== 1-s peak spectral analysis ===
(Best model with acceptable fit: PL)

Model Ph_index Ph_90err_low Ph_90err_hi  Epeak  Epeak_90err_low  Epeak_90err_hi  Norm       Nomr_90err_low    Norm_90err_hi    chi2    dof
PL      -1.449     -0.438     0.441       -           -               -         5.27e-03     -1.25e-03          1.24e-03      50.080   57
CPL     -1.459     -0.428     0.457     9999.360    -9999.360      -9999.360      5.27e-03     -1.25e-03          1.18e-02      50.090   56


=== Fluence/Peak Flux Summary ===

              Model    Band1     Band2     Band3     Band4     Band5     Total
                       15-25     25-50    50-100    100-350    15-150    15-350    keV
Fluence         PL   1.21e-07  1.84e-07  2.08e-07  4.50e-07  6.48e-07  9.63e-07   erg/cm2
      90%_error_low -1.60e-08 -1.60e-08 -2.83e-08 -1.14e-07 -6.53e-08 -1.43e-07   erg/cm2
      90%_error_hi   1.65e-08  1.60e-08  2.84e-08  1.36e-07  6.62e-08  1.61e-07   erg/cm2
Peak flux       PL   2.06e-01  2.14e-01  1.57e-01  1.85e-01  6.49e-01  7.62e-01   ph/cm2/s
      90%_error_low -8.25e-02 -5.53e-02 -4.77e-02 -9.49e-02 -1.53e-01 -1.79e-01   ph/cm2/s
      90%_error_hi   9.12e-02  5.33e-02  4.62e-02  1.45e-01  1.53e-01  1.82e-01   ph/cm2/s

Fluence        CPL   1.16e-07  1.92e-07  2.09e-07  2.48e-07  6.27e-07  7.65e-07   erg/cm2
      90%_error_low -1.85e-08 -2.07e-08 -3.02e-08 -1.54e-07 -7.49e-08 -1.74e-07   erg/cm2
      90%_error_hi   1.86e-08  2.17e-08  3.00e-08  2.38e-07  7.58e-08  2.60e-07   erg/cm2
Peak flux      CPL   2.14e-01  2.10e-01  1.54e-01  1.88e-01  6.51e-01  7.95e-01   ph/cm2/s
      90%_error_low     N/A   -6.35e-02     N/A       N/A   -1.56e-01     N/A     ph/cm2/s
      90%_error_hi      N/A    7.11e-02     N/A       N/A    1.53e-01     N/A     ph/cm2/s

======================================================================
Image
Pre-slew 15.0-350.0 keV image (Event data)
#   RAcent    DECcent   POSerr    Theta     Phi              Peak Cts       SNR   Name
  271.3918   -62.4683   0.0116    36.1613  -177.4216         1.1137238     16.626 TRIG_00106709

Foreground time interval of the image:
-12.008  16.568 (delta_t =  28.576 [sec])
Background time interval of the image:
-129.971 -12.008 (delta_t = 117.963 [sec])
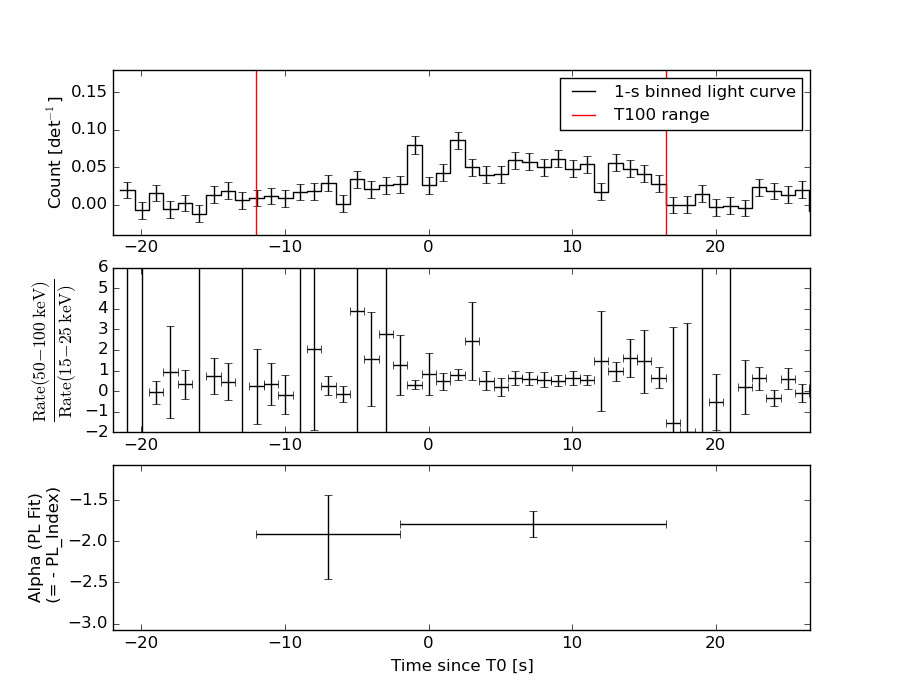
Light Curves
Note: The mask-weighted lightcurves have units of either count/det or counts/sec/det, where a det is 0.4 x 0.4 = 0.16 sq cm.
Full-time range; 1 s binning
Other quick-look light curves:
- 64 ms binning (zoomed)
- 16 ms binning (zoomed)
- 8 ms binning (zoomed)
- 2 ms binning (zoomed)
- SN=5 or 10 s binning (full-time range)
- Raw light curve
Spectra
- 64 ms binning (zoomed)
- 16 ms binning (zoomed)
- 8 ms binning (zoomed)
- 2 ms binning (zoomed)
- SN=5 or 10 s binning (full-time range)
- Raw light curve
Spectra
Notes:
- 1) The fitting includes the systematic errors.
- 2) When the burst includes telescope slew time periods, the fitting uses an average response file made from multiple 5-s response files through out the slew time plus single time preiod for the non-slew times, and weighted by the total counts in the corresponding time period using addrmf. An average response file is needed becuase a spectral fit using the pre-slew DRM will introduce some errors in both a spectral shape and a normalization if the PHA file contains a lot of the slew/post-slew time interval.
- 3) For fits to more complicated models (e.g. a power-law over a cutoff power-law), the BAT team has decided to require a chi-square improvement of more than 6 for each extra dof.
Time averaged spectrum fit using the average DRM
Power-law model
Time interval is from  -12.008 sec. to   16.568 sec.

Spectral model in power-law:
------------------------------------------------------------
Parameters  : value       lower 90%   higher 90%
Photon index: -1.81803     ( -0.162698   0.157606 )
Norm@50keV  : 2.46348E-03    ( -0.000247229   0.000243272 )
------------------------------------------------------------
#Fit statistic : Chi-Squared =          49.43 using 59 PHA bins.
# Reduced chi-squared =         0.8672 for     57 degrees of freedom
# Null hypothesis probability =   7.516064e-01

Photon flux (15-150 keV)    in 28.58 sec: 0.341883 ( -0.03012  0.030144 ) ph/cm2/s
Energy fluence (15-150 keV)             : 6.47891e-07 ( -6.53293e-08  6.62467e-08 ) ergs/cm2
Cutoff power-law model
Time interval is from  -12.008 sec. to   16.568 sec.
Spectral model in the cutoff power-law:
------------------------------------------------------------
Parameters  : value       lower 90%   higher 90%
Photon index: -1.46013     ( -0.657073   0.729156 )
Epeak [keV] : 68.0987      (   )
Norm@50keV  : 3.86934E-03    (     )
------------------------------------------------------------
#Fit statistic : Chi-Squared =          48.52 using 59 PHA bins.
# Reduced chi-squared =         0.8663 for     56 degrees of freedom
# Null hypothesis probability =   7.510155e-01

Photon flux (15-150 keV)    in 28.58 sec: 0.336651 ( -0.03162  0.031467 ) ph/cm2/s
Energy fluence (15-150 keV)             : 6.26531e-07 ( -7.49208e-08  7.57847e-08 ) ergs/cm2
1-s peak spectrum fit
Power-law model
Time interval is from    1.644 sec. to    2.644 sec.

Spectral model in power-law:
------------------------------------------------------------
Parameters  : value       lower 90%   higher 90%
Photon index: -1.44876     ( -0.437747   0.440757 )
Norm@50keV  : 5.26699E-03    ( -0.00125462   0.00123588 )
------------------------------------------------------------
#Fit statistic : Chi-Squared =          50.08 using 59 PHA bins.
# Reduced chi-squared =         0.8787 for     57 degrees of freedom
# Null hypothesis probability =   7.299732e-01

Photon flux (15-150 keV)    in 1 sec: 0.648898 ( -0.153106  0.153401 ) ph/cm2/s
Energy fluence (15-150 keV)             : 5.04197e-08 ( -1.31634e-08  1.3414e-08 ) ergs/cm2
Cutoff power-law model
Time interval is from    1.644 sec. to    2.644 sec.
Spectral model in the cutoff power-law:
------------------------------------------------------------
Parameters  : value       lower 90%   higher 90%
Photon index: -1.45887     ( -0.428638   0.456122 )
Epeak [keV] : 9999.36      ( -9999.36 -9999.36 )
Norm@50keV  : 5.27387E-03    ( -0.00125605   0.0117754 )
------------------------------------------------------------
#Fit statistic : Chi-Squared =          50.09 using 59 PHA bins.
# Reduced chi-squared =         0.8945 for     56 degrees of freedom
# Null hypothesis probability =   6.969049e-01

Photon flux (15-150 keV)    in 1 sec: 0.650748 ( -0.156388  0.152858 ) ph/cm2/s
Energy fluence (15-150 keV)             : 5.08113e-08 ( 0  0 ) ergs/cm2
Time-resolved spectra
Distribution
T90 vs. Hardness ratio plot
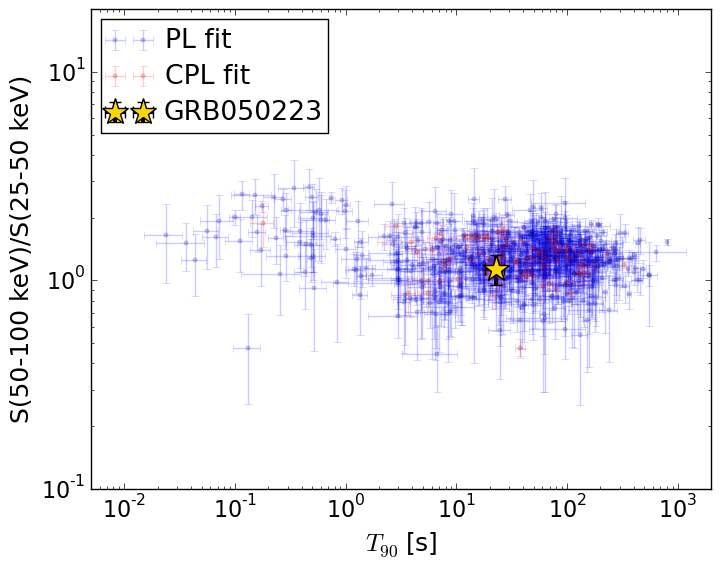
T90                                   = 22.68 sec.
Hardness ratio (energy fluence ratio) = 1.13448860744
S(15-50 keV) vs. S(50-150 keV) plot
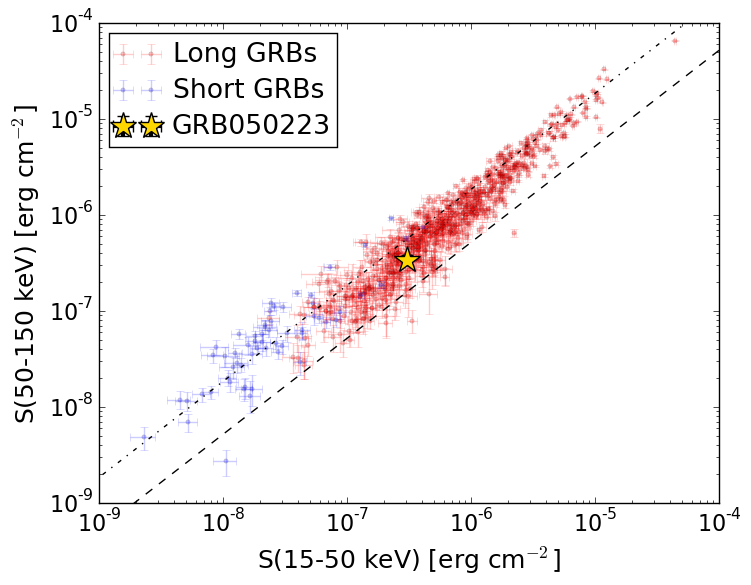
S(15-50 keV)  = 3.049258e-07
S(50-150 keV) = 3.429733e-07
The dash-dotted line and the dashed line traces the fluences calculated from the Band function with Epeak = 15 and 150 keV, respectively. Both lines assume a canonical values of alpha = -1 and beta = -2.5.
Mask shadow pattern
IMX = -7.301133695814178E-01, IMY = 3.287843649521691E-02
Spacecraft aspect plot
Bright source in the pre-burst/pre-slew/post-slew images
Pre-burst image of 15-350 keV band
Time interval of the image:
-129.971390 -12.008000

# RAcent  DECcent POSerr Theta    Phi  PeakCts   SNR AngSep     Name
#  [deg]    [deg]    ['] [deg]  [deg]                   [']
264.7985 -44.4883   95.0  54.1 -171.5   0.0381   0.1    3.3	4U 1735-44
 91.7112 -83.0244    2.0  17.6  110.4   0.5947   5.8 ------	UNKNOWN
 68.8834 -58.3511    2.5  24.8   38.1   0.4985   4.6 ------	UNKNOWN
260.0048 -41.2546    2.7  58.3 -174.1   2.6973   4.3 ------	UNKNOWN
332.3273 -36.6288    3.3  41.7 -103.1   1.5466   3.5 ------	UNKNOWN
Pre-slew background subtracted image of 15-350 keV band
Time interval of the image:
-12.008000 16.568000

# RAcent  DECcent POSerr Theta    Phi  PeakCts   SNR AngSep     Name
#  [deg]    [deg]    ['] [deg]  [deg]                   [']
264.6885 -44.5514    5.0  54.0 -171.6  -0.3749  -2.3    6.5	4U 1735-44
118.1093 -57.9214    1.9  39.5   78.6   1.2499   6.1 ------	UNKNOWN
 85.2180 -36.2060    1.9  49.4   36.5   1.4053   6.0 ------	UNKNOWN
271.3918 -62.4683    0.7  36.2 -177.4   1.1137  16.6 ------	UNKNOWN
 21.8805 -23.7051    2.3  48.4  -39.5   0.7531   5.1 ------	UNKNOWN
Post-slew image of 15-350 keV band
Time interval of the image: