Analysis Summary
Notes:
- 1) No attempt has been made to eliminate the non-significant decimal places.
- 2) This batgrbproduct analysis is done using the HEASARC data.
- 3) This batgrbproduct analysis is using the flight position for the mask-weighting calculation.
======================================================================
                  BAT GRB EVENT DATA PROCESSING REPORT
    Process Script Ver: batgrbproduct v2.46
    Process Start Time: Wed Jan 22 22:49:54 EST 2014
             Host Name: batevent1
   Current Working Dir: /local/data/batevent/batevent_reproc/trigger107547
======================================================================

  Trigger: 00107547      Segment: 000

  BAT Trigger Time: 131772791.296   [s; MET]
      Trigger Stop: 131772803.456   [s; MET]
               UTC: 2005-03-06T03:33:11.876760    [includes UTCF correction]
       Where From?: TDRSS position message

  BAT
    RA: 282.322462112659   Dec: -9.16491762927298  [deg; J2000]

     Catalogged Source?: NO
     Point Source?:      YES
     GRB Indicated?:     YES    [ by BAT flight software ]
     Image S/N Ratio:    11
     Image Trigger?:     NO
     Rate S/N Ratio:     15.7480157480236  [ if not an image trigger ]
     Image S/N Ratio:    11

  Analysis Position:   [ source = BAT ]
    RA: 282.322462112659   Dec: -9.16491762927298  [deg; J2000]

  Refined Position:   [ source = BAT pre-slew burst ]
    RA: 282.312692498675   Dec: -9.15081231057348  [deg; J2000]
        { 18h 49m 15.0s , -09d 09' 02.9" }
         +/- 0.997517860044354 [arcmin] (estimated 90% radius based on SNR)
         +/- 0.369592134618441 [arcmin] (formal 1-sigma fit error)
    SNR: 30.5253228082142

  Angular difference between the analysis and refined position is 1.025259 arcmin

  Partial Coding Fraction: 0.1582031    [ including projection effects ]

  Duration
     T90: 158.524000003934 +/- 19.8421649107376
        Measured from: 4.91599999368191
                   to: 163.439999997616     [s; relative to TRIGTIME]
     T50: 75.0760000050068 +/- 5.57635723894792
        Measured from: 31.3959999978542
                   to: 106.472000002861     [s; relative to TRIGTIME]


  Fluence
     Peak Flux  (peak 1 second)
        Measured from: 107.851999998093
                   to: 108.851999998093     [s; relative to TRIGTIME]
     Total Fluence
        Measured from: -3.42000000178814
                   to: 187.79999999702     [s; relative to TRIGTIME]

             Band 1     Band 2     Band 3     Band 4
              15-25      25-50     50-100    100-350     keV
 Total     3.620710   5.585368   5.252657   1.475038
           0.193153   0.199048   0.171141   0.135616 [error]
 Peak      0.071755   0.135476   0.155458   0.036955
           0.015784   0.016914   0.016486   0.012257 [error]

     [ fluence units of on-axis counts / fully illuminated detector ]

======================================================================


====== Table of the duration information =============================

        Value   tstart    tstop
T100  191.220   -3.420  187.800
T90   158.524    4.916  163.440
T50    75.076   31.396  106.472
Peak    1.000  107.852  108.852


====== Spectral Analysis Summary =====================================

Model      : spectral model: simple power-law (PL) and cutoff power-law (CPL)
Ph_index   : photon index: E^{Ph_index}
Ph_90err   : 90% error of the photon index
Epeak      : Epeak in keV
Epeak_90err: 90% error of Epeak
Norm       : normalization at 50 keV in both the PL model and CPL model
Nomr_90err : 90% error of the normalization
chi2       : Chi-Squared
dof        : degree of freedo

=== Time-averaged spectral analysis ===
(Best model with acceptable fit: CPL)

Model Ph_index Ph_90err_low Ph_90err_hi  Epeak  Epeak_90err_low  Epeak_90err_hi  Norm       Nomr_90err_low    Norm_90err_hi    chi2    dof
PL      -1.467    -0.065      0.065       -           -               -         6.34e-03     -2.35e-04          2.35e-04      58.090   57
CPL     -1.087    -0.265      0.281      140.509     -36.012       173.394      9.29e-03     -2.12e-03          2.92e-03      51.990   56


=== 1-s peak spectral analysis ===
(Best model with acceptable fit: PL)

Model Ph_index Ph_90err_low Ph_90err_hi  Epeak  Epeak_90err_low  Epeak_90err_hi  Norm       Nomr_90err_low    Norm_90err_hi    chi2    dof
PL      -1.194     -0.206     0.211       -           -               -         3.00e-02     -3.75e-03          3.74e-03      52.090   57
CPL     -0.651     -0.640     1.035      147.577      N/A           N/A         5.15e-02        N/A               N/A         50.930   56


=== Fluence/Peak Flux Summary ===

              Model    Band1     Band2     Band3     Band4     Band5     Total
                       15-25     25-50    50-100    100-350    15-150    15-350    keV
Fluence         PL   1.50e-06  2.81e-06  4.07e-06  1.25e-05  1.16e-05  2.09e-05   erg/cm2
      90%_error_low -1.11e-07 -1.26e-07 -1.71e-07 -1.14e-06 -4.35e-07 -1.23e-06   erg/cm2
      90%_error_hi   1.14e-07  1.26e-07  1.70e-07  1.21e-06  4.35e-07  1.28e-06   erg/cm2
Peak flux       PL   9.21e-01  1.11e+00  9.72e-01  1.46e+00  3.51e+00  4.46e+00   ph/cm2/s
      90%_error_low -2.22e-01 -1.76e-01 -1.28e-01 -3.65e-01 -4.68e-01 -5.52e-01   ph/cm2/s
      90%_error_hi   2.44e-01  1.73e-01  1.26e-01  4.31e-01  4.71e-01  5.54e-01   ph/cm2/s

Fluence        CPL   1.35e-06  2.87e-06  4.25e-06  8.21e-06  1.14e-05  1.67e-05   erg/cm2
      90%_error_low -1.44e-07 -1.35e-07 -2.10e-07 -1.97e-06 -4.53e-07 -2.00e-06   erg/cm2
      90%_error_hi   1.48e-07  1.36e-07  2.12e-07  2.78e-06  4.51e-07  2.76e-06   erg/cm2
Peak flux      CPL   7.90e-01  1.14e+00  1.04e+00  9.33e-01  3.43e+00  3.90e+00   ph/cm2/s
      90%_error_low -2.84e-01 -1.88e-01 -1.67e-01 -4.53e-01 -4.84e-01 -7.07e-01   ph/cm2/s
      90%_error_hi   3.12e-01  1.90e-01  1.73e-01  6.75e-01  4.87e-01  8.87e-01   ph/cm2/s

======================================================================
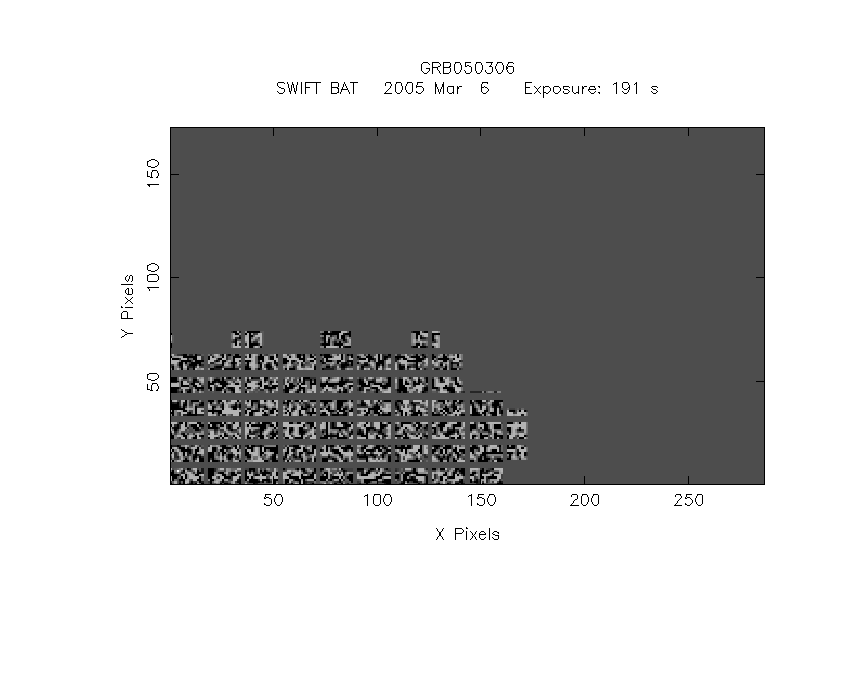
Image
Pre-slew 15.0-350.0 keV image (Event data)
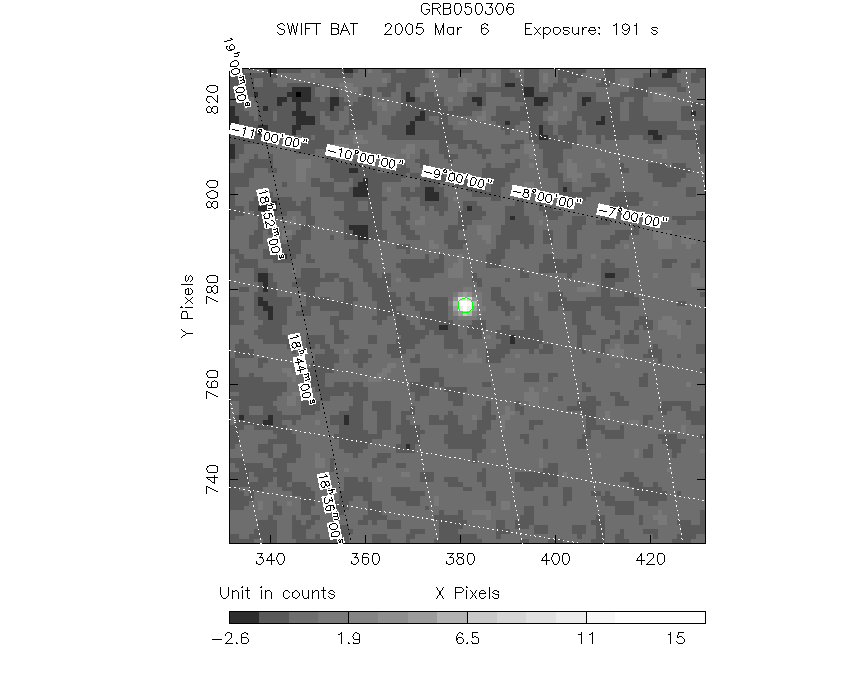
#   RAcent    DECcent   POSerr    Theta     Phi              Peak Cts       SNR   Name
  282.3127    -9.1508   0.0063    50.7179   -31.0364        16.3212599     30.525 TRIG_00107547

Foreground time interval of the image:
 -3.420 187.800 (delta_t = 191.220 [sec])
Background time interval of the image:
-299.296  -3.420 (delta_t = 295.876 [sec])
Light Curves
Note: The mask-weighted lightcurves have units of either count/det or counts/sec/det, where a det is 0.4 x 0.4 = 0.16 sq cm.
Full-time range; 1 s binning
Other quick-look light curves:
- 64 ms binning (zoomed)
- 16 ms binning (zoomed)
- 8 ms binning (zoomed)
- 2 ms binning (zoomed)
- SN=5 or 10 s binning (full-time range)
- Raw light curve
Spectra
- 64 ms binning (zoomed)
- 16 ms binning (zoomed)
- 8 ms binning (zoomed)
- 2 ms binning (zoomed)
- SN=5 or 10 s binning (full-time range)
- Raw light curve
Spectra
Notes:
- 1) The fitting includes the systematic errors.
- 2) When the burst includes telescope slew time periods, the fitting uses an average response file made from multiple 5-s response files through out the slew time plus single time preiod for the non-slew times, and weighted by the total counts in the corresponding time period using addrmf. An average response file is needed becuase a spectral fit using the pre-slew DRM will introduce some errors in both a spectral shape and a normalization if the PHA file contains a lot of the slew/post-slew time interval.
- 3) For fits to more complicated models (e.g. a power-law over a cutoff power-law), the BAT team has decided to require a chi-square improvement of more than 6 for each extra dof.
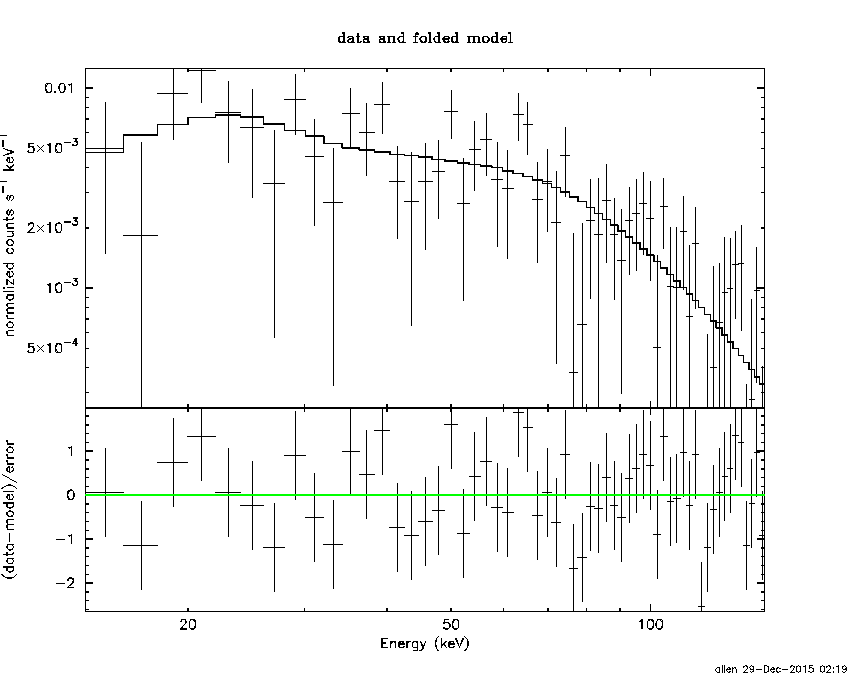
Time averaged spectrum fit using the average DRM
Power-law model
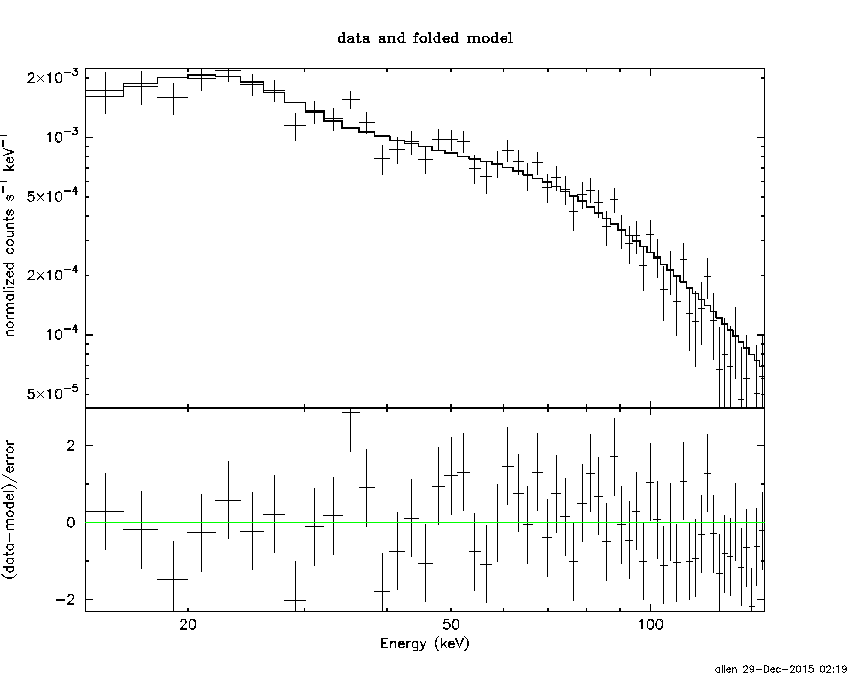
Time interval is from   -3.420 sec. to  187.800 sec.

Spectral model in power-law:
------------------------------------------------------------
Parameters  : value       lower 90%   higher 90%
Photon index: -1.46657     ( -0.0651493   0.0653735 )
Norm@50keV  : 6.34006E-03    ( -0.000235475   0.000235362 )
------------------------------------------------------------
#Fit statistic : Chi-Squared =          58.09 using 59 PHA bins.
# Reduced chi-squared =          1.019 for     57 degrees of freedom
# Null hypothesis probability =   4.348099e-01

Photon flux (15-150 keV)    in 191.2 sec: 0.784606 ( -0.033184  0.033328 ) ph/cm2/s
Energy fluence (15-150 keV)             : 1.15669e-05 ( -4.3481e-07  4.34911e-07 ) ergs/cm2
Cutoff power-law model
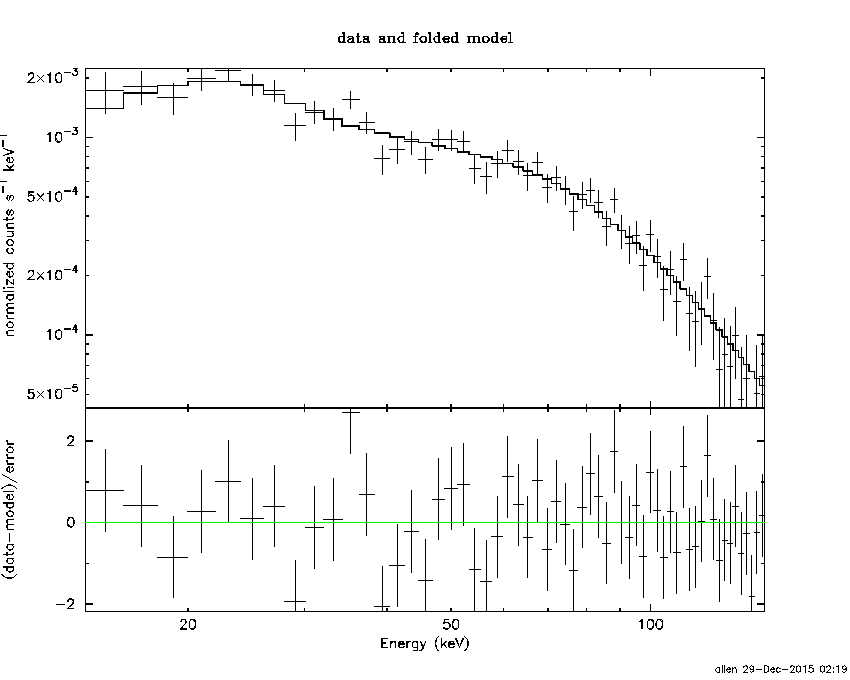
Time interval is from   -3.420 sec. to  187.800 sec.
Spectral model in the cutoff power-law:
------------------------------------------------------------
Parameters  : value       lower 90%   higher 90%
Photon index: -1.087     ( -0.265004   0.28111 )
Epeak [keV] : 140.509      ( -36.0114 173.394 )
Norm@50keV  : 9.28517E-03    ( -0.00212201   0.0029175 )
------------------------------------------------------------
#Fit statistic : Chi-Squared =          51.99 using 59 PHA bins.
# Reduced chi-squared =         0.9284 for     56 degrees of freedom
# Null hypothesis probability =   6.273298e-01

Photon flux (15-150 keV)    in 191.2 sec: 0.764927 ( -0.035526  0.035726 ) ph/cm2/s
Energy fluence (15-150 keV)             : 1.14035e-05 ( -4.52641e-07  4.51406e-07 ) ergs/cm2
1-s peak spectrum fit
Power-law model
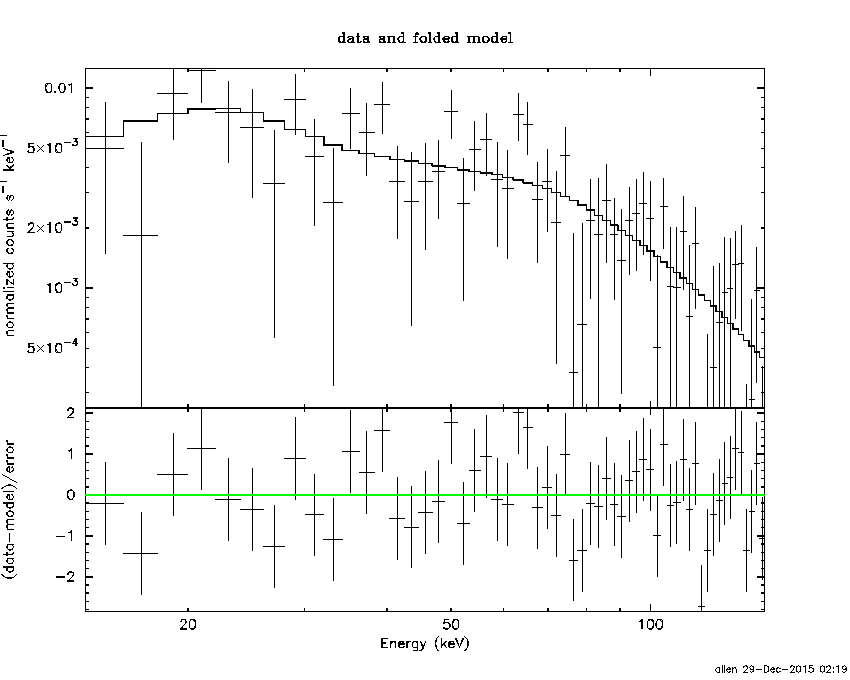
Time interval is from  107.852 sec. to  108.852 sec.

Spectral model in power-law:
------------------------------------------------------------
Parameters  : value       lower 90%   higher 90%
Photon index: -1.19431     ( -0.206099   0.211488 )
Norm@50keV  : 2.99622E-02    ( -0.00375427   0.00373633 )
------------------------------------------------------------
#Fit statistic : Chi-Squared =          52.09 using 59 PHA bins.
# Reduced chi-squared =         0.9139 for     57 degrees of freedom
# Null hypothesis probability =   6.592724e-01

Photon flux (15-150 keV)    in 1 sec: 3.51417 ( -0.46769  0.471 ) ph/cm2/s
Energy fluence (15-150 keV)             : 3.04502e-07 ( -3.86622e-08  3.87318e-08 ) ergs/cm2
Cutoff power-law model
Time interval is from  107.852 sec. to  108.852 sec.
Spectral model in the cutoff power-law:
------------------------------------------------------------
Parameters  : value       lower 90%   higher 90%
Photon index: -0.65135     ( -0.64023   1.03482 )
Epeak [keV] : 147.577      (   )
Norm@50keV  : 5.14584E-02    (     )
------------------------------------------------------------
#Fit statistic : Chi-Squared =          50.93 using 59 PHA bins.
# Reduced chi-squared =         0.9094 for     56 degrees of freedom
# Null hypothesis probability =   6.668311e-01

Photon flux (15-150 keV)    in 1 sec: 3.43315 ( -0.4837  0.48715 ) ph/cm2/s
Energy fluence (15-150 keV)             : 3.00331e-07 ( -4.01474e-08  3.97247e-08 ) ergs/cm2
Time-resolved spectra
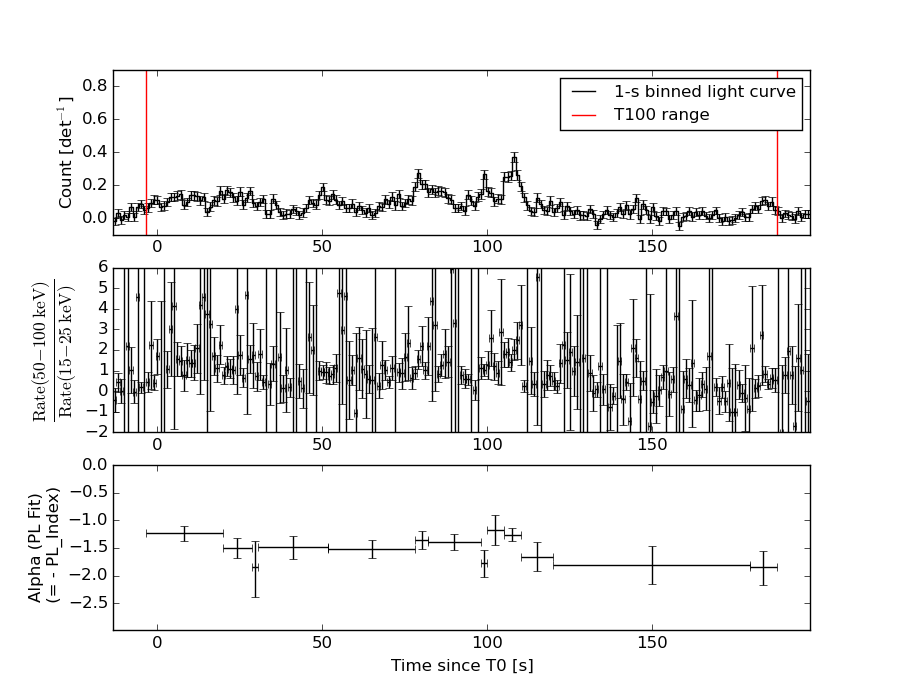
Distribution
T90 vs. Hardness ratio plot
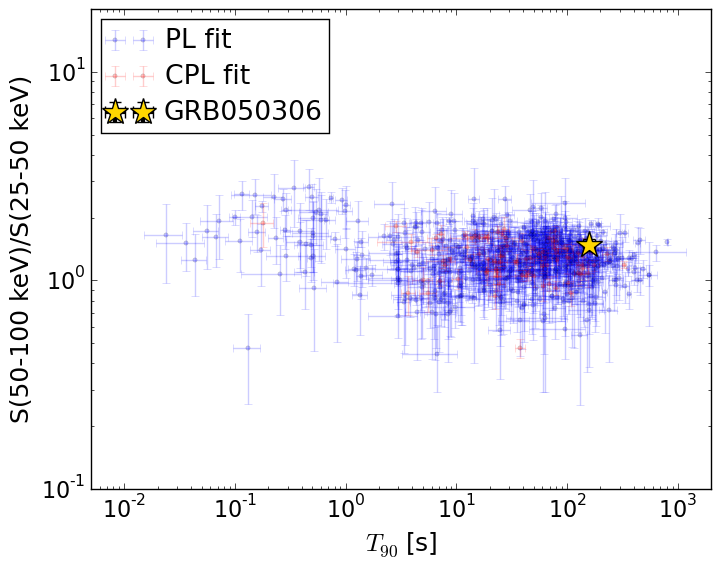
T90                                   = 158.524 sec.
Hardness ratio (energy fluence ratio) = 1.48183509733
S(15-50 keV) vs. S(50-150 keV) plot
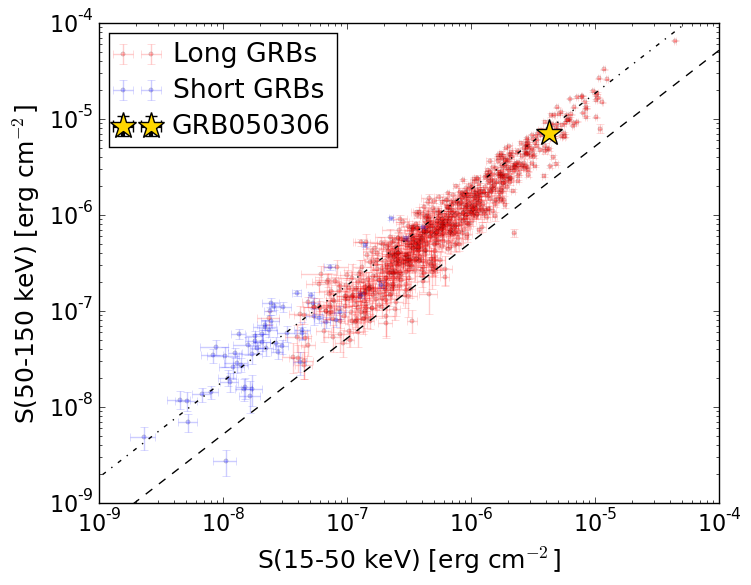
S(15-50 keV)  = 4.222162e-06
S(50-150 keV) = 7.181189e-06
The dash-dotted line and the dashed line traces the fluences calculated from the Band function with Epeak = 15 and 150 keV, respectively. Both lines assume a canonical values of alpha = -1 and beta = -2.5.
Mask shadow pattern
IMX = 1.047522639628722E+00, IMY = 6.303208238792297E-01
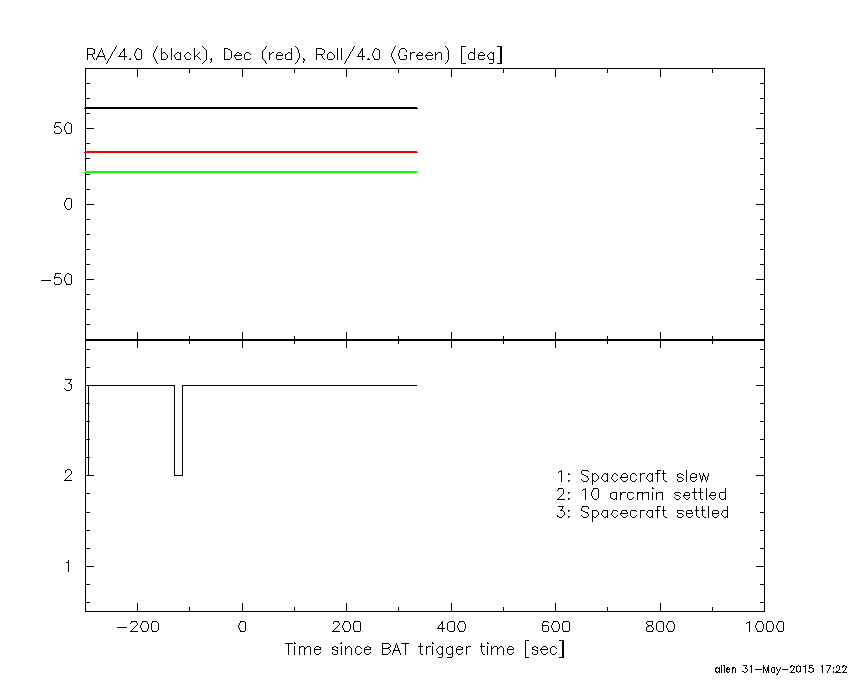
Spacecraft aspect plot
Bright source in the pre-burst/pre-slew/post-slew images
Pre-burst image of 15-350 keV band
Time interval of the image:
-299.296000 -3.420000

# RAcent  DECcent POSerr Theta    Phi  PeakCts   SNR AngSep     Name
#  [deg]    [deg]    ['] [deg]  [deg]                   [']
244.9951 -15.6469    0.7  50.8   17.3  10.3449  16.5    1.0	Sco X-1
254.4220  35.3270    1.1   1.1  174.4   1.6901  10.3    2.0	Her X-1
268.4910  -1.4284    7.8  38.0  -17.6   0.3194   1.5    7.5	SW J1753.5-0127
273.9751 -14.1657   21.6  51.8  -18.8  -0.2468  -0.5    8.0	GX 17+2
288.7799  10.9622    1.0  38.9  -56.1   4.3302  11.7    1.5	GRS 1915+105
299.5583  35.2086    0.4  36.6  -99.4  12.2648  26.8    1.6	Cyg X-1
308.2202  40.9279    3.3  42.3 -110.1   2.4301   3.4    5.2	Cyg X-3
263.6056 -14.6629    3.2  49.7   -6.1   1.4235   3.6 ------	UNKNOWN
 47.4903  88.3354    3.6  57.2 -173.9   2.9002   3.2 ------	UNKNOWN
296.2341  13.1254    2.7  43.1  -65.7   3.2493   4.3 ------	UNKNOWN
Pre-slew background subtracted image of 15-350 keV band
Time interval of the image:
-3.420000 187.800000

# RAcent  DECcent POSerr Theta    Phi  PeakCts   SNR AngSep     Name
#  [deg]    [deg]    ['] [deg]  [deg]                   [']
244.9719 -15.7863    5.7  50.9   17.3   1.1624   2.0    8.8	Sco X-1
254.2951  35.1989   82.9   1.0  164.0   0.0199   0.1   11.7	Her X-1
268.4972  -1.3212   16.4  37.9  -17.6  -0.1491  -0.7   11.1	SW J1753.5-0127
273.8778 -14.1867    7.2  51.8  -18.7   0.7793   1.6   11.7	GX 17+2
288.7774  10.9444    7.0  38.8  -56.1   0.6385   1.6    1.2	GRS 1915+105
299.7462  35.1142    2.6  36.7  -99.3  -1.8229  -4.4    9.3	Cyg X-1
308.1565  40.8254   53.2  42.2 -110.0   0.1575   0.2    7.9	Cyg X-3
247.0871 -14.6419    2.0  49.5   14.9   2.5338   5.7 ------	UNKNOWN
246.3912  20.7708    2.1  15.4   35.8   0.8447   5.5 ------	UNKNOWN
  6.5102  82.0764    3.0  58.9 -166.2   3.4878   3.8 ------	UNKNOWN
282.3127  -9.1508    0.4  50.7  -31.0  16.3194  30.5 ------	UNKNOWN
Post-slew image of 15-350 keV band
Time interval of the image:
-299.296000 302.784300

# RAcent  DECcent POSerr Theta    Phi  PeakCts   SNR AngSep     Name
#  [deg]    [deg]    ['] [deg]  [deg]                   [']
244.9883 -15.6289    0.6  50.8   17.3  19.3357  18.7    0.9	Sco X-1
254.4688  35.3501    1.0   1.1  174.1   3.2909  11.4    0.7	Her X-1
268.3822  -1.4503   22.5  38.0  -17.4   0.1916   0.5    0.9	SW J1753.5-0127
274.0208 -14.1118   29.9  51.8  -18.9  -0.3356  -0.4    4.6	GX 17+2
288.8069  10.9490    0.8  38.9  -56.1   9.3170  14.6    0.5	GRS 1915+105
299.5951  35.1950    0.4  36.6  -99.4  23.8425  26.8    0.5	Cyg X-1
308.2313  40.9000    3.3  42.2 -110.1   4.6805   3.5    6.3	Cyg X-3
265.6164   5.3660    3.3  30.6  -16.5   1.1179   3.5 ------	UNKNOWN
347.4339  76.0185    2.8  57.5 -158.2   6.5130   4.1 ------	UNKNOWN
282.3242  -9.1562    0.6  50.7  -31.0  18.4820  20.7 ------	UNKNOWN