Analysis Summary
Notes:
- 1) No attempt has been made to eliminate the non-significant decimal places.
- 2) This batgrbproduct analysis is done using the HEASARC data.
- 3) This batgrbproduct analysis is using the flight position for the mask-weighting calculation.
======================================================================
                  BAT GRB EVENT DATA PROCESSING REPORT
    Process Script Ver: batgrbproduct v2.46
    Process Start Time: Wed Jan 22 22:45:38 EST 2014
             Host Name: batevent1
   Current Working Dir: /local/data/batevent/batevent_reproc/trigger111529
======================================================================

  Trigger: 00111529      Segment: 000

  BAT Trigger Time: 132853476.608   [s; MET]
      Trigger Stop: 132853477.12   [s; MET]
               UTC: 2005-03-18T15:44:37.170860    [includes UTCF correction]
       Where From?: TDRSS position message

  BAT
    RA: 49.6782870708762   Dec: -46.4033764015338  [deg; J2000]

     Catalogged Source?: NO
     Point Source?:      YES
     GRB Indicated?:     YES    [ by BAT flight software ]
     Image S/N Ratio:    9
     Image Trigger?:     NO
     Rate S/N Ratio:     16.8226038412607  [ if not an image trigger ]
     Image S/N Ratio:    9

  Analysis Position:   [ source = BAT ]
    RA: 49.6782870708762   Dec: -46.4033764015338  [deg; J2000]

  Refined Position:   [ source = BAT pre-slew burst ]
    RA: 49.697136532926   Dec: -46.3882537483467  [deg; J2000]
        { 03h 18m 47.3s , -46d 23' 17.7" }
         +/- 0.988469430717399 [arcmin] (estimated 90% radius based on SNR)
         +/- 0.38173242762334 [arcmin] (formal 1-sigma fit error)
    SNR: 30.9252876040921

  Angular difference between the analysis and refined position is 1.196535 arcmin

  Partial Coding Fraction: 0.6640625    [ including projection effects ]

  Duration
     T90: 16.1240000128746 +/- 10.9167885364736
        Measured from: 3.48000000417233
                   to: 19.6040000170469     [s; relative to TRIGTIME]
     T50: 8.64800000190735 +/- 1.64450600444055
        Measured from: 7.608000010252
                   to: 16.2560000121593     [s; relative to TRIGTIME]


  Fluence
     Peak Flux  (peak 1 second)
        Measured from: 28.5799999982119
                   to: 29.5799999982119     [s; relative to TRIGTIME]
     Total Fluence
        Measured from: -0.61999998986721
                   to: 29.7160000056028     [s; relative to TRIGTIME]

             Band 1     Band 2     Band 3     Band 4
              15-25      25-50     50-100    100-350     keV
 Total     0.683020   0.852985   0.445466   0.058110
           0.030310   0.032034   0.028613   0.027508 [error]
 Peak      0.110891   0.158902   0.105551   0.017190
           0.006932   0.007650   0.006727   0.005242 [error]

     [ fluence units of on-axis counts / fully illuminated detector ]

======================================================================


====== Table of the duration information =============================

        Value   tstart    tstop
T100   30.336   -0.620   29.716
T90    16.124    3.480   19.604
T50     8.648    7.608   16.256
Peak    1.000   28.580   29.580


====== Spectral Analysis Summary =====================================

Model      : spectral model: simple power-law (PL) and cutoff power-law (CPL)
Ph_index   : photon index: E^{Ph_index}
Ph_90err   : 90% error of the photon index
Epeak      : Epeak in keV
Epeak_90err: 90% error of Epeak
Norm       : normalization at 50 keV in both the PL model and CPL model
Nomr_90err : 90% error of the normalization
chi2       : Chi-Squared
dof        : degree of freedo

=== Time-averaged spectral analysis ===
(Best model with acceptable fit: CPL)

Model Ph_index Ph_90err_low Ph_90err_hi  Epeak  Epeak_90err_low  Epeak_90err_hi  Norm       Nomr_90err_low    Norm_90err_hi    chi2    dof
PL      -1.888    -0.093      0.091       -           -               -         4.09e-03     -2.30e-04          2.29e-04      61.180   57
CPL     -1.032    -0.407      0.451       49.234      -5.906         9.442      1.22e-02     -4.86e-03          9.38e-03      46.930   56


=== 1-s peak spectral analysis ===
(Best model with acceptable fit: CPL)

Model Ph_index Ph_90err_low Ph_90err_hi  Epeak  Epeak_90err_low  Epeak_90err_hi  Norm       Nomr_90err_low    Norm_90err_hi    chi2    dof
PL      -1.642     -0.099     0.098       -           -               -         2.48e-02     -1.54e-03          1.53e-03      72.040   57
CPL     -0.806     -0.419     0.462       67.249     -10.155        22.443      6.88e-02     -2.70e-02          5.07e-02      59.290   56


=== Fluence/Peak Flux Summary ===

              Model    Band1     Band2     Band3     Band4     Band5     Total
                       15-25     25-50    50-100    100-350    15-150    15-350    keV
Fluence         PL   2.29e-07  3.32e-07  3.59e-07  7.23e-07  1.14e-06  1.64e-06   erg/cm2
      90%_error_low -1.71e-08 -1.60e-08 -2.77e-08 -1.08e-07 -6.35e-08 -1.36e-07   erg/cm2
      90%_error_hi   1.74e-08  1.60e-08  2.79e-08  1.21e-07  6.41e-08  1.46e-07   erg/cm2
Peak flux       PL   1.17e+00  1.08e+00  6.94e-01  6.84e-01  3.23e+00  3.63e+00   ph/cm2/s
      90%_error_low -1.07e-01 -6.43e-02 -5.48e-02 -1.01e-01 -1.88e-01 -2.12e-01   ph/cm2/s
      90%_error_hi   1.09e-01  6.41e-02  5.47e-02  1.11e-01  1.89e-01  2.12e-01   ph/cm2/s

Fluence        CPL   2.06e-07  3.61e-07  3.49e-07  2.02e-07  1.04e-06  1.12e-06   erg/cm2
      90%_error_low -1.99e-08 -2.10e-08 -3.27e-08 -8.37e-08 -7.36e-08 -1.13e-07   erg/cm2
      90%_error_hi   2.02e-08  2.14e-08  3.19e-08  1.46e-07  7.58e-08  1.63e-07   erg/cm2
Peak flux      CPL   1.03e+00  1.18e+00  7.24e-01  2.79e-01  3.13e+00  3.21e+00   ph/cm2/s
      90%_error_low -1.26e-01 -8.03e-02 -6.22e-02 -9.76e-02 -1.95e-01 -2.22e-01   ph/cm2/s
      90%_error_hi   1.28e-01  8.18e-02  6.25e-02  1.48e-01  1.95e-01  2.37e-01   ph/cm2/s

======================================================================
Image
Pre-slew 15.0-350.0 keV image (Event data)
#   RAcent    DECcent   POSerr    Theta     Phi              Peak Cts       SNR   Name
   49.6971   -46.3883   0.0062    22.2086   -78.8115         2.0703434     30.925 TRIG_00111529

Foreground time interval of the image:
 -0.620  29.716 (delta_t =  30.336 [sec])
Background time interval of the image:
-299.608  -0.620 (delta_t = 298.988 [sec])
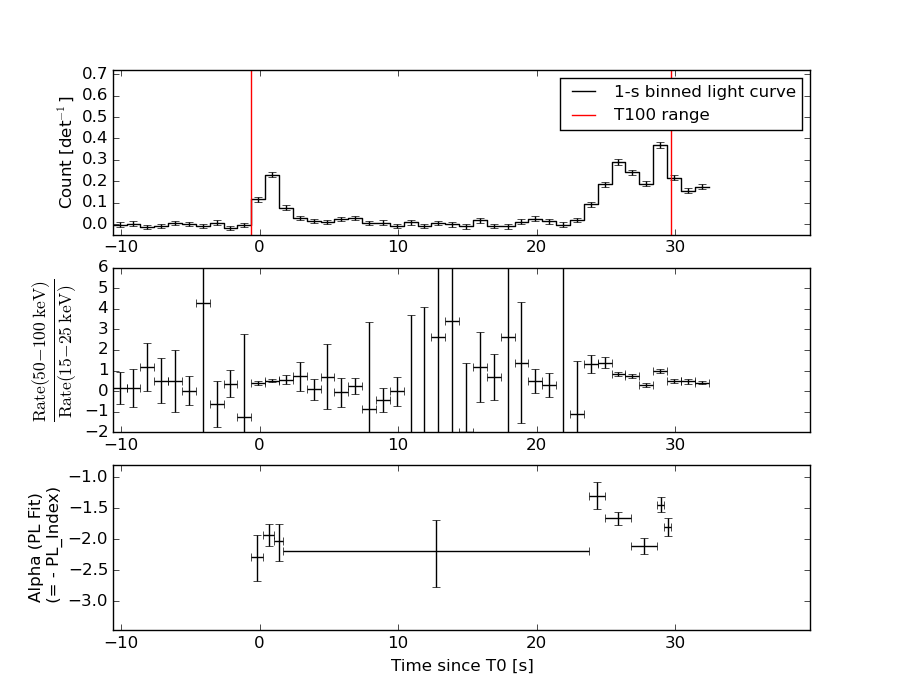
Light Curves
Note: The mask-weighted lightcurves have units of either count/det or counts/sec/det, where a det is 0.4 x 0.4 = 0.16 sq cm.
Full-time range; 1 s binning
Other quick-look light curves:
- 64 ms binning (zoomed)
- 16 ms binning (zoomed)
- 8 ms binning (zoomed)
- 2 ms binning (zoomed)
- SN=5 or 10 s binning (full-time range)
- Raw light curve
Spectra
- 64 ms binning (zoomed)
- 16 ms binning (zoomed)
- 8 ms binning (zoomed)
- 2 ms binning (zoomed)
- SN=5 or 10 s binning (full-time range)
- Raw light curve
Spectra
Notes:
- 1) The fitting includes the systematic errors.
- 2) When the burst includes telescope slew time periods, the fitting uses an average response file made from multiple 5-s response files through out the slew time plus single time preiod for the non-slew times, and weighted by the total counts in the corresponding time period using addrmf. An average response file is needed becuase a spectral fit using the pre-slew DRM will introduce some errors in both a spectral shape and a normalization if the PHA file contains a lot of the slew/post-slew time interval.
- 3) For fits to more complicated models (e.g. a power-law over a cutoff power-law), the BAT team has decided to require a chi-square improvement of more than 6 for each extra dof.
Time averaged spectrum fit using the average DRM
Power-law model
Time interval is from   -0.620 sec. to   29.716 sec.

Spectral model in power-law:
------------------------------------------------------------
Parameters  : value       lower 90%   higher 90%
Photon index: -1.88812     ( -0.0925067   0.0909042 )
Norm@50keV  : 4.09445E-03    ( -0.000230425   0.000228579 )
------------------------------------------------------------
#Fit statistic : Chi-Squared =          61.18 using 59 PHA bins.
# Reduced chi-squared =          1.073 for     57 degrees of freedom
# Null hypothesis probability =   3.282111e-01

Photon flux (15-150 keV)    in 30.34 sec: 0.584691 ( -0.028767  0.028797 ) ph/cm2/s
Energy fluence (15-150 keV)             : 1.14221e-06 ( -6.35226e-08  6.40908e-08 ) ergs/cm2
Cutoff power-law model
Time interval is from   -0.620 sec. to   29.716 sec.
Spectral model in the cutoff power-law:
------------------------------------------------------------
Parameters  : value       lower 90%   higher 90%
Photon index: -1.03216     ( -0.407451   0.451009 )
Epeak [keV] : 49.2345      ( -5.9064 9.44152 )
Norm@50keV  : 1.21699E-02    ( -0.00485668   0.00937898 )
------------------------------------------------------------
#Fit statistic : Chi-Squared =          46.93 using 59 PHA bins.
# Reduced chi-squared =         0.8380 for     56 degrees of freedom
# Null hypothesis probability =   8.008275e-01

Photon flux (15-150 keV)    in 30.34 sec: 0.557954 ( -0.030978  0.031053 ) ph/cm2/s
Energy fluence (15-150 keV)             : 1.04413e-06 ( -7.35657e-08  7.58093e-08 ) ergs/cm2
1-s peak spectrum fit
Power-law model
Time interval is from   28.580 sec. to   29.580 sec.

Spectral model in power-law:
------------------------------------------------------------
Parameters  : value       lower 90%   higher 90%
Photon index: -1.64235     ( -0.0992584   0.0978626 )
Norm@50keV  : 2.48139E-02    ( -0.00153675   0.00152783 )
------------------------------------------------------------
#Fit statistic : Chi-Squared =          72.04 using 59 PHA bins.
# Reduced chi-squared =          1.264 for     57 degrees of freedom
# Null hypothesis probability =   8.656552e-02

Photon flux (15-150 keV)    in 1 sec: 3.23208 ( -0.18849  0.18859 ) ph/cm2/s
Energy fluence (15-150 keV)             : 2.30994e-07 ( -1.52096e-08  1.53205e-08 ) ergs/cm2
Cutoff power-law model
Time interval is from   28.580 sec. to   29.580 sec.
Spectral model in the cutoff power-law:
------------------------------------------------------------
Parameters  : value       lower 90%   higher 90%
Photon index: -0.805756     ( -0.418563   0.462062 )
Epeak [keV] : 67.2495      ( -10.1553 22.4428 )
Norm@50keV  : 6.87664E-02    ( -0.0269681   0.0507475 )
------------------------------------------------------------
#Fit statistic : Chi-Squared =          59.29 using 59 PHA bins.
# Reduced chi-squared =          1.059 for     56 degrees of freedom
# Null hypothesis probability =   3.564918e-01

Photon flux (15-150 keV)    in 1 sec: 3.12607 ( -0.19513  0.19523 ) ph/cm2/s
Energy fluence (15-150 keV)             : 2.16123e-07 ( -1.65968e-08  1.68255e-08 ) ergs/cm2
Time-resolved spectra
Distribution
T90 vs. Hardness ratio plot
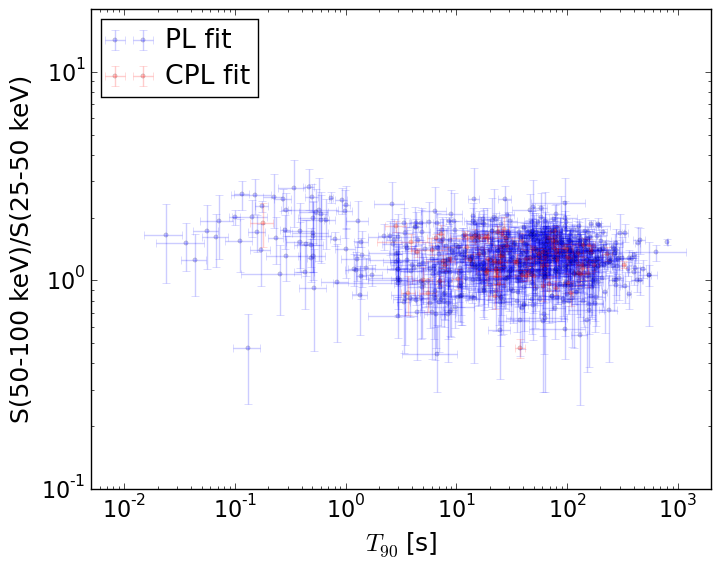
T90                                   = N/A sec.
Hardness ratio (energy fluence ratio) = N/A
S(15-50 keV) vs. S(50-150 keV) plot
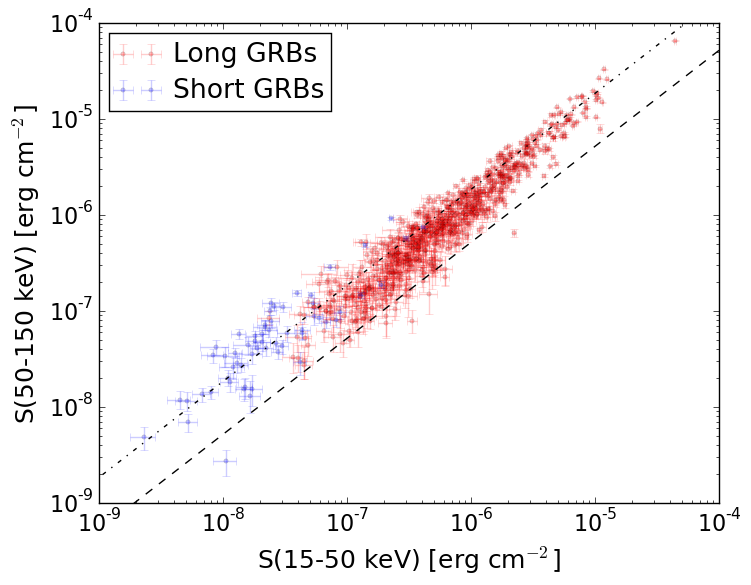
S(15-50 keV)  = N/A
S(50-150 keV) = N/A
The dash-dotted line and the dashed line traces the fluences calculated from the Band function with Epeak = 15 and 150 keV, respectively. Both lines assume a canonical values of alpha = -1 and beta = -2.5.
Mask shadow pattern
IMX = 7.921960456349829E-02, IMY = 4.005086390093962E-01
Spacecraft aspect plot
Bright source in the pre-burst/pre-slew/post-slew images
Pre-burst image of 15-350 keV band
Time interval of the image:
-299.608000 -0.620000

# RAcent  DECcent POSerr Theta    Phi  PeakCts   SNR AngSep     Name
#  [deg]    [deg]    ['] [deg]  [deg]                   [']
135.5424 -40.5595    0.9  38.1   81.6   7.5343  12.6    0.7	Vela X-1
170.3066 -60.6232   34.1  42.1  127.3   0.2147   0.3    0.3	Cen X-3
186.5540 -62.7816    2.4  46.5  136.8   3.7866   4.8    2.9	GX 301-2
 63.8756 -12.6890    2.3  47.0  -29.3   1.8503   5.1 ------	UNKNOWN
Pre-slew background subtracted image of 15-350 keV band
Time interval of the image:
-0.620000 29.716000

# RAcent  DECcent POSerr Theta    Phi  PeakCts   SNR AngSep     Name
#  [deg]    [deg]    ['] [deg]  [deg]                   [']
135.5420 -40.5869    5.6  38.1   81.6  -0.3632  -2.1    2.0	Vela X-1
170.0651 -60.5847   17.0  42.1  127.1  -0.1256  -0.7    7.7	Cen X-3
186.7491 -62.7819   27.6  46.6  136.9   0.0974   0.4    2.6	GX 301-2
 49.6972 -46.3883    0.4  22.2  -78.8   2.0700  30.9 ------	UNKNOWN
 41.9572 -41.8623    2.0  29.3  -80.3   0.4443   5.7 ------	UNKNOWN
Post-slew image of 15-350 keV band
Time interval of the image: