Analysis Summary
Notes:
- 1) No attempt has been made to eliminate the non-significant decimal places.
- 2) This batgrbproduct analysis is done using the HEASARC data.
- 3) This batgrbproduct analysis is using the flight position for the mask-weighting calculation.
======================================================================
                  BAT GRB EVENT DATA PROCESSING REPORT
    Process Script Ver: batgrbproduct v2.46
    Process Start Time: Sat May  9 19:57:54 EDT 2015
             Host Name: bat1
   Current Working Dir: /local/data/bat1/alien/Swift_3rdBATcatalog/event/batevent_reproc/trigger113120
======================================================================

  Trigger: 00113120      Segment: 000

  BAT Trigger Time: 134058014.784   [s; MET]
      Trigger Stop: 134058015.808   [s; MET]
               UTC: 2005-04-01T14:20:15.326620    [includes UTCF correction]
       Where From?: TDRSS position message

  BAT
    RA: 247.880487633644   Dec: 2.18388293694669  [deg; J2000]

     Catalogged Source?: NO
     Point Source?:      YES
     GRB Indicated?:     YES    [ by BAT flight software ]
     Image S/N Ratio:    10
     Image Trigger?:     NO
     Rate S/N Ratio:     45.3431361950185  [ if not an image trigger ]
     Image S/N Ratio:    10

  Analysis Position:   [ source = BAT ]
    RA: 247.880487633644   Dec: 2.18388293694669  [deg; J2000]

  Refined Position:   [ source = BAT pre-slew burst ]
    RA: 247.873416234551   Dec: 2.1865874476908  [deg; J2000]
        { 16h 31m 29.6s , +02d 11' 11.7" }
         +/- 1.09595469796366 [arcmin] (estimated 90% radius based on SNR)
         +/- 0.380267607481 [arcmin] (formal 1-sigma fit error)
    SNR: 26.68528249977

  Angular difference between the analysis and refined position is 0.453968 arcmin

  Partial Coding Fraction: 0.05712891    [ including projection effects ]

  Duration
     T90: 32.0920000076294 +/- 0.577442637323557
        Measured from: -5.12799999117851
                   to: 26.9640000164509     [s; relative to TRIGTIME]
     T50: 25.3960000127554 +/- 0.419237411561389
        Measured from: -0.403999999165535
                   to: 24.9920000135899     [s; relative to TRIGTIME]


  Fluence
     Peak Flux  (peak 1 second)
        Measured from: 24.2719999998808
                   to: 25.2719999998808     [s; relative to TRIGTIME]
     Total Fluence
        Measured from: -5.90799999237061
                   to: 27.804000005126     [s; relative to TRIGTIME]

             Band 1     Band 2     Band 3     Band 4
              15-25      25-50     50-100    100-350     keV
 Total     2.180863   3.687148   3.654509   1.382127
           0.143108   0.159920   0.147313   0.114201 [error]
 Peak      0.220570   0.439067   0.577215   0.219853
           0.032138   0.040351   0.042019   0.029289 [error]

     [ fluence units of on-axis counts / fully illuminated detector ]

======================================================================


====== Table of the duration information =============================

        Value   tstart    tstop
T100   33.712   -5.908   27.804
T90    32.092   -5.128   26.964
T50    25.396   -0.404   24.992
Peak    1.000   24.272   25.272


====== Spectral Analysis Summary =====================================

Model      : spectral model: simple power-law (PL) and cutoff power-law (CPL)
Ph_index   : photon index: E^{Ph_index}
Ph_90err   : 90% error of the photon index
Epeak      : Epeak in keV
Epeak_90err: 90% error of Epeak
Norm       : normalization at 50 keV in both the PL model and CPL model
Nomr_90err : 90% error of the normalization
chi2       : Chi-Squared
dof        : degree of freedo

=== Time-averaged spectral analysis ===
(Best model with acceptable fit: PL)

Model Ph_index Ph_90err_low Ph_90err_hi  Epeak  Epeak_90err_low  Epeak_90err_hi  Norm       Nomr_90err_low    Norm_90err_hi    chi2    dof
PL      -1.388    -0.075      0.075       -           -               -         2.48e-02     -1.09e-03          1.09e-03      55.440   57
CPL     -1.173    -0.248      0.324      223.326    -100.158      -223.326      3.09e-02     -6.75e-03          1.17e-02      54.000   56


=== 1-s peak spectral analysis ===
(Best model with acceptable fit: CPL)

Model Ph_index Ph_90err_low Ph_90err_hi  Epeak  Epeak_90err_low  Epeak_90err_hi  Norm       Nomr_90err_low    Norm_90err_hi    chi2    dof
PL      -1.143     -0.129     0.131       -           -               -         1.07e-01     -9.12e-03          9.10e-03      71.500   57
CPL     -0.067     -0.599     0.694      107.979     -21.166        59.358      3.12e-01     -1.37e-01          2.87e-01      61.170   56


=== Fluence/Peak Flux Summary ===

              Model    Band1     Band2     Band3     Band4     Band5     Total
                       15-25     25-50    50-100    100-350    15-150    15-350    keV
Fluence         PL   9.60e-07  1.89e-06  2.89e-06  9.62e-06  8.09e-06  1.54e-05   erg/cm2
      90%_error_low -8.27e-08 -1.00e-07 -1.41e-07 -1.01e-06 -3.61e-07 -1.09e-06   erg/cm2
      90%_error_hi   8.53e-08  9.95e-08  1.41e-07  1.08e-06  3.61e-07  1.14e-06   erg/cm2
Peak flux       PL   4.41e-04  5.40e-03  6.02e-02  5.85e+00  2.70e-01  5.85e+00   ph/cm2/s
      90%_error_low -1.24e-06 4.37e-05 1.39e-03 -4.95e-01 8.73e-03 -4.35e-01   ph/cm2/s
      90%_error_hi   2.49e-04  2.81e-03  2.88e-02  1.30e+00  1.25e-01  1.42e+00   ph/cm2/s

Fluence        CPL   9.10e-07  1.92e-06  2.96e-06  7.44e-06  8.04e-06  1.32e-05   erg/cm2
      90%_error_low -1.06e-07 -1.08e-07 -1.78e-07 -2.20e-06 -3.70e-07 -2.18e-06   erg/cm2
      90%_error_hi   1.10e-07  1.09e-07  1.80e-07  2.09e-06  3.69e-07  2.57e-06   erg/cm2
Peak flux      CPL   2.32e+00  4.11e+00  4.12e+00  2.68e+00  1.22e+01  1.32e+01   ph/cm2/s
      90%_error_low -5.96e-01 -4.62e-01 -4.41e-01 -8.53e-01 -1.12e+00 -1.43e+00   ph/cm2/s
      90%_error_hi   6.46e-01  4.63e-01  4.50e-01  1.28e+00  1.12e+00  1.63e+00   ph/cm2/s

======================================================================
Image
Pre-slew 15.0-350.0 keV image (Event data)

#   RAcent    DECcent   POSerr    Theta     Phi              Peak Cts       SNR   Name
  247.8734     2.1866   0.0072    55.6708     5.6150         8.8356351     26.685 TRIG_00113120

Foreground time interval of the image:
 -5.908  25.317 (delta_t =  31.225 [sec])
Background time interval of the image:
-299.784  -5.908 (delta_t = 293.876 [sec])
Light Curves
Note: The mask-weighted lightcurves have units of either count/det or counts/sec/det, where a det is 0.4 x 0.4 = 0.16 sq cm.
Full-time range; 1 s binning
Other quick-look light curves:
- 64 ms binning (zoomed)
- 16 ms binning (zoomed)
- 8 ms binning (zoomed)
- 2 ms binning (zoomed)
- SN=5 or 10 s binning (full-time range)
- Raw light curve
Spectra
- 64 ms binning (zoomed)
- 16 ms binning (zoomed)
- 8 ms binning (zoomed)
- 2 ms binning (zoomed)
- SN=5 or 10 s binning (full-time range)
- Raw light curve
Spectra
Notes:
- 1) The fitting includes the systematic errors.
- 2) When the burst includes telescope slew time periods, the fitting uses an average response file made from multiple 5-s response files through out the slew time plus single time preiod for the non-slew times, and weighted by the total counts in the corresponding time period using addrmf. An average response file is needed becuase a spectral fit using the pre-slew DRM will introduce some errors in both a spectral shape and a normalization if the PHA file contains a lot of the slew/post-slew time interval.
- 3) For fits to more complicated models (e.g. a power-law over a cutoff power-law), the BAT team has decided to require a chi-square improvement of more than 6 for each extra dof.
Time averaged spectrum fit using the average DRM
Power-law model

Time interval is from   -5.908 sec. to   27.804 sec.

Spectral model in power-law:
------------------------------------------------------------
Parameters  : value       lower 90%   higher 90%
Photon index: -1.38848     ( -0.0750222   0.075386 )
Norm@50keV  : 2.47658E-02    ( -0.00108759   0.00108622 )
------------------------------------------------------------
#Fit statistic : Chi-Squared =          55.44 using 59 PHA bins.
# Reduced chi-squared =         0.9726 for     57 degrees of freedom
# Null hypothesis probability =   5.339768e-01

Photon flux (15-150 keV)    in 33.71 sec: 3.00828 ( -0.14692  0.14744 ) ph/cm2/s
Energy fluence (15-150 keV)             : 8.0872e-06 ( -3.60771e-07  3.60896e-07 ) ergs/cm2
Cutoff power-law model

Time interval is from   -5.908 sec. to   27.804 sec.
Spectral model in the cutoff power-law:
------------------------------------------------------------
Parameters  : value       lower 90%   higher 90%
Photon index: -1.17319     ( -0.247685   0.323693 )
Epeak [keV] : 223.326      ( -100.174 -223.343 )
Norm@50keV  : 3.08750E-02    ( -0.00675421   0.0117448 )
------------------------------------------------------------
#Fit statistic : Chi-Squared =          54.00 using 59 PHA bins.
# Reduced chi-squared =         0.9642 for     56 degrees of freedom
# Null hypothesis probability =   5.511284e-01

Photon flux (15-150 keV)    in 33.71 sec: 2.97587 ( -0.15313  0.15384 ) ph/cm2/s
Energy fluence (15-150 keV)             : 8.0393e-06 ( -3.69944e-07  3.68629e-07 ) ergs/cm2
1-s peak spectrum fit
Power-law model

Time interval is from   24.272 sec. to   25.272 sec.

Spectral model in power-law:
------------------------------------------------------------
Parameters  : value       lower 90%   higher 90%
Photon index: -1.14311     ( -0.128882   0.130507 )
Norm@50keV  : 0.107262    ( -0.00911817   0.00909533 )
------------------------------------------------------------
#Fit statistic : Chi-Squared =          71.50 using 59 PHA bins.
# Reduced chi-squared =          1.254 for     57 degrees of freedom
# Null hypothesis probability =   9.364115e-02

Photon flux (15-150 keV)    in 1 sec: 0.270312 0.300919 0.220649 0.162219 0.123148 9.78392E-02 8.16102E-02 7.10960E-02 6.41139E-02 5.93264E-02 5.59309E-02 5.34435E-02 5.15674E-02 5.01151E-02 4.89654E-02 4.80372E-02 4.72750E-02 4.66396E-02 4.61032E-02 4.56449E-02 4.49078E-02 4.43100E-02 4.38135E-02 4.02189E-02 (    ) ph/cm2/s
Energy fluence (15-150 keV)             : 1.10662e-06 ( -9.5483e-08  9.57275e-08 ) ergs/cm2
Cutoff power-law model

Time interval is from   24.272 sec. to   25.272 sec.
Spectral model in the cutoff power-law:
------------------------------------------------------------
Parameters  : value       lower 90%   higher 90%
Photon index: -0.0665502     ( -0.598546   0.693575 )
Epeak [keV] : 107.979      ( -21.1666 59.3578 )
Norm@50keV  : 0.312042    ( -0.136705   0.286788 )
------------------------------------------------------------
#Fit statistic : Chi-Squared =          61.17 using 59 PHA bins.
# Reduced chi-squared =          1.092 for     56 degrees of freedom
# Null hypothesis probability =   2.958049e-01

Photon flux (15-150 keV)    in 1 sec: 12.1738 ( -1.1153  1.1212 ) ph/cm2/s
Energy fluence (15-150 keV)             : 1.0983e-06 ( -9.94736e-08  9.88815e-08 ) ergs/cm2
Time-resolved spectra

Distribution
T90 vs. Hardness ratio plot
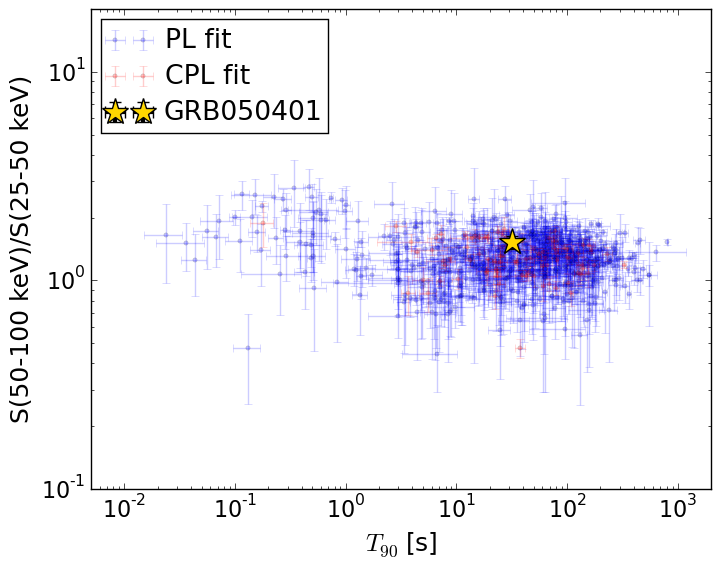
T90                                   = 32.092 sec.
Hardness ratio (energy fluence ratio) = 1.52791773654
S(15-50 keV) vs. S(50-150 keV) plot

S(15-50 keV)  = 2.8495512e-06
S(50-150 keV) = 5.237593e-06
The dash-dotted line and the dashed line traces the fluences calculated from the Band function with Epeak = 15 and 150 keV, respectively. Both lines assume a canonical values of alpha = -1 and beta = -2.5.
Mask shadow pattern

IMX = 1.457314487497005E+00, IMY = -1.432755237830371E-01
Spacecraft aspect plot

Bright source in the pre-burst/pre-slew/post-slew images
Pre-burst image of 15-350 keV band
Time interval of the image:
-299.784000 -5.908000

# RAcent  DECcent POSerr Theta    Phi  PeakCts   SNR AngSep     Name
#  [deg]    [deg]    ['] [deg]  [deg]                   [']
254.5448  35.2573    8.9  53.7  -35.9  -1.2636  -1.3    6.7	Her X-1
151.8041  11.6414    2.5  41.8  165.3   1.3466   4.6 ------	UNKNOWN
137.4834  12.9771    2.6  54.6  173.1   3.2350   4.4 ------	UNKNOWN
183.1822  16.8375    3.0  11.7  148.0   0.5427   3.9 ------	UNKNOWN
224.1733  12.9728    2.5  29.9    5.1   0.8096   4.6 ------	UNKNOWN
242.5756  11.5984    4.3  47.2   -2.9   0.8371   2.7 ------	UNKNOWN
168.7902  61.8461    2.4  43.5 -114.6   3.5621   4.8 ------	UNKNOWN
161.2027  60.4952    3.1  44.8 -119.9   2.6957   3.7 ------	UNKNOWN
193.2879  63.1356    3.9  41.1  -98.2   2.6871   3.0 ------	UNKNOWN
Pre-slew background subtracted image of 15-350 keV band
Time interval of the image:
-5.908000 25.316590

# RAcent  DECcent POSerr Theta    Phi  PeakCts   SNR AngSep     Name
#  [deg]    [deg]    ['] [deg]  [deg]                   [']
254.6236  35.3185   14.4  53.8  -35.9  -0.1995  -0.8    8.3	Her X-1
153.5100  -3.8473    2.3  47.5  144.6   0.9587   5.1 ------	UNKNOWN
247.8733   2.1866    0.5  55.7    5.6   8.8301  23.5 ------	UNKNOWN
217.5194  30.6845    2.6  22.5  -35.0   0.2369   4.5 ------	UNKNOWN
143.7368  54.6930    2.0  49.7 -133.3   1.4040   5.7 ------	UNKNOWN
Post-slew image of 15-350 keV band
Time interval of the image:
112.516600 302.320400

# RAcent  DECcent POSerr Theta    Phi  PeakCts   SNR AngSep     Name
#  [deg]    [deg]    ['] [deg]  [deg]                   [']
244.9857 -15.6385    0.2  18.0   16.2  11.0520  71.8    0.4	Sco X-1
254.4404  35.3673    5.6  33.7 -163.2  -0.4122  -2.0    1.7	Her X-1
255.9869 -37.8450  165.7  40.7   -2.7   0.0176   0.1    0.1	4U 1700-377
256.4679 -36.4674    3.7  39.5   -3.7   0.7201   3.1    3.1	GX 349+2
263.0291 -24.5901    7.4  30.5  -20.7   0.2874   1.6    9.4	GX 1+4
264.6068 -44.4751    4.8  49.0   -8.6   0.8120   2.4    6.0	4U 1735-44
268.5305  -1.5718    0.0  21.0  -72.7   0.0946   0.5   12.1	SW J1753.5-0127
270.3015 -25.0984    2.7  34.9  -30.0   0.8393   4.2    1.5	GX 5-1
270.2950 -25.7206    3.6  35.3  -29.3   0.6668   3.2    1.4	GRS 1758-258
274.1235 -13.9727    6.7  30.6  -50.3   0.3824   1.7    7.8	GX 17+2
276.0191 -30.4674    5.8  42.2  -30.0  -0.5518  -2.0    7.7	H1820-303
284.9467 -24.8135    8.8  44.9  -43.6   0.5542   1.3    8.1	HT1900.1-2455
262.8444 -33.8346    6.2  38.7  -12.9   0.3855   1.9    7.2	GX 354-0
273.6578   5.2964    3.0  25.9  -90.5   0.8545   3.8 ------	UNKNOWN
264.7583  60.1315    4.5  59.4 -163.2   3.7391   2.6 ------	UNKNOWN
290.3975 -19.6874    3.2  47.1  -53.1   2.6502   3.6 ------	UNKNOWN