Analysis Summary
Notes:
- 1) No attempt has been made to eliminate the non-significant decimal places.
- 2) This batgrbproduct analysis is done using the HEASARC data.
- 3) This batgrbproduct analysis is using the flight position for the mask-weighting calculation.
======================================================================
BAT GRB EVENT DATA PROCESSING REPORT
Process Script Ver: batgrbproduct v2.46
Process Start Time: Wed Jan 22 22:30:08 EST 2014
Host Name: batevent1
Current Working Dir: /local/data/batevent/batevent_reproc/trigger114299
======================================================================
Trigger: 00114299 Segment: 000
BAT Trigger Time: 134828073.024 [s; MET]
Trigger Stop: 134828089.408 [s; MET]
UTC: 2005-04-10T12:14:33.553380 [includes UTCF correction]
Where From?: TDRSS position message
BAT
RA: 89.7495264610994 Dec: 79.5985922952754 [deg; J2000]
Catalogged Source?: NO
Point Source?: YES
GRB Indicated?: YES [ by BAT flight software ]
Image S/N Ratio: 16
Image Trigger?: NO
Rate S/N Ratio: 20.4939015319192 [ if not an image trigger ]
Image S/N Ratio: 16
Analysis Position: [ source = BAT ]
RA: 89.7495264610994 Dec: 79.5985922952754 [deg; J2000]
Refined Position: [ source = BAT pre-slew burst ]
RA: 89.7569459575089 Dec: 79.6057276572491 [deg; J2000]
{ 05h 59m 01.7s , +79d 36' 20.6" }
+/- 1.19806094117993 [arcmin] (estimated 90% radius based on SNR)
+/- 0.455193533673337 [arcmin] (formal 1-sigma fit error)
SNR: 23.496633991273
Angular difference between the analysis and refined position is 0.435596 arcmin
Partial Coding Fraction: 0.1367188 [ including projection effects ]
Duration
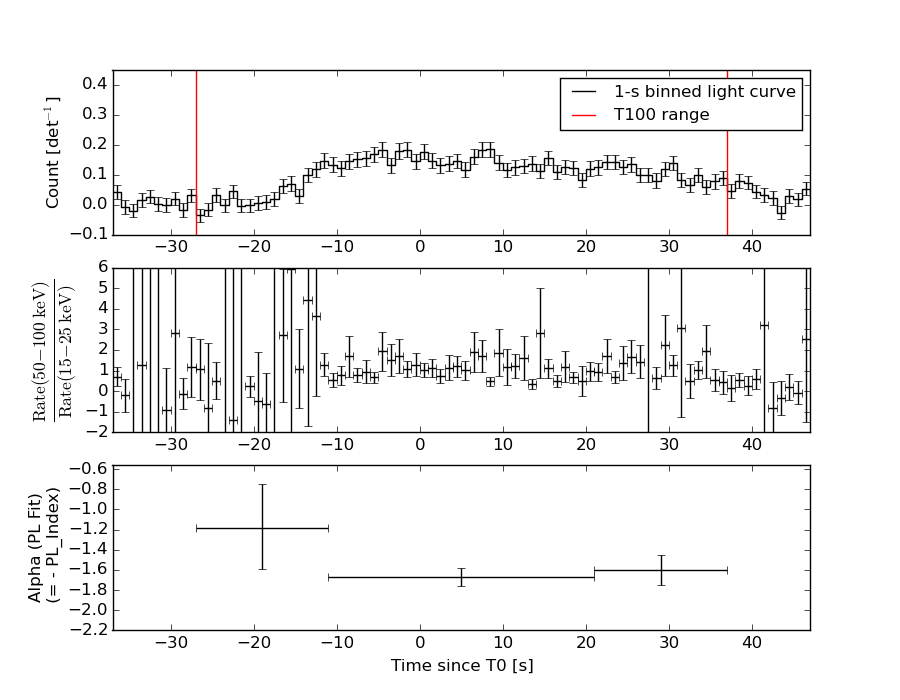
T90: 64 +/- 16
Measured from: -27.0239999890327
to: 36.9760000109673 [s; relative to TRIGTIME]
T50: 32 +/- 16
Measured from: -11.0239999890327
to: 20.9760000109673 [s; relative to TRIGTIME]
Fluence
Peak Flux (peak 1 second)
Measured from: -3.52399998903275
to: -2.52399998903275 [s; relative to TRIGTIME]
Total Fluence
Measured from: -27.0239999890327
to: 36.9760000109673 [s; relative to TRIGTIME]
Band 1 Band 2 Band 3 Band 4
15-25 25-50 50-100 100-350 keV
Total 1.703463 2.649522 2.018420 0.462743
0.100769 0.108746 0.095525 0.076623 [error]
Peak 0.038632 0.079586 0.054935 0.009630
0.013318 0.014293 0.012944 0.010067 [error]
[ fluence units of on-axis counts / fully illuminated detector ]
======================================================================
====== Table of the duration information =============================
Value tstart tstop
T100 64.000 -27.024 36.976
T90 64.000 -27.024 36.976
T50 32.000 -11.024 20.976
Peak 1.000 -3.524 -2.524
====== Spectral Analysis Summary =====================================
Model : spectral model: simple power-law (PL) and cutoff power-law (CPL)
Ph_index : photon index: E^{Ph_index}
Ph_90err : 90% error of the photon index
Epeak : Epeak in keV
Epeak_90err: 90% error of Epeak
Norm : normalization at 50 keV in both the PL model and CPL model
Nomr_90err : 90% error of the normalization
chi2 : Chi-Squared
dof : degree of freedo
=== Time-averaged spectral analysis ===
(Best model with acceptable fit: CPL)
Model Ph_index Ph_90err_low Ph_90err_hi Epeak Epeak_90err_low Epeak_90err_hi Norm Nomr_90err_low Norm_90err_hi chi2 dof
PL -1.616 -0.080 0.080 - - - 7.63e-03 -3.67e-04 3.66e-04 66.390 57
CPL -0.812 -0.355 0.385 75.623 -10.214 20.974 1.90e-02 -6.18e-03 1.01e-02 49.950 56
=== 1-s peak spectral analysis ===
(Best model with acceptable fit: PL)
Model Ph_index Ph_90err_low Ph_90err_hi Epeak Epeak_90err_low Epeak_90err_hi Norm Nomr_90err_low Norm_90err_hi chi2 dof
PL -1.763 -0.388 0.350 - - - 1.16e-02 -2.94e-03 2.88e-03 70.550 57
CPL 0.488 -1.788 3.211 58.199 -13.250 31.049 1.41e-01 -1.41e-01 3.80e+00 65.590 56
=== Fluence/Peak Flux Summary ===
Model Band1 Band2 Band3 Band4 Band5 Total
15-25 25-50 50-100 100-350 15-150 15-350 keV
Fluence PL 6.95e-07 1.19e-06 1.55e-06 4.11e-06 4.56e-06 7.55e-06 erg/cm2
90%_error_low -5.58e-08 -5.99e-08 -9.42e-08 -5.04e-07 -2.30e-07 -5.82e-07 erg/cm2
90%_error_hi 5.70e-08 5.97e-08 9.40e-08 5.46e-07 2.31e-07 6.14e-07 erg/cm2
Peak flux PL 6.13e-01 5.28e-01 3.11e-01 2.75e-01 1.57e+00 1.73e+00 ph/cm2/s
90%_error_low -1.98e-01 -1.24e-01 -9.76e-02 -1.36e-01 -3.68e-01 -4.01e-01 ph/cm2/s
90%_error_hi 2.17e-01 1.24e-01 9.67e-02 1.86e-01 3.68e-01 4.02e-01 ph/cm2/s
Fluence CPL 5.98e-07 1.28e-06 1.64e-06 1.56e-06 4.35e-06 5.08e-06 erg/cm2
90%_error_low -6.79e-08 -7.26e-08 -1.08e-07 -4.83e-07 -2.49e-07 -5.35e-07 erg/cm2
90%_error_hi 6.93e-08 7.38e-08 1.09e-07 7.39e-07 2.49e-07 7.55e-07 erg/cm2
Peak flux CPL 3.80e-01 6.26e-01 3.94e-01 7.02e-02 1.46e+00 1.47e+00 ph/cm2/s
90%_error_low -3.80e-01 -1.58e-01 -1.28e-01 -7.02e-02 -3.86e-01 -3.95e-01 ph/cm2/s
90%_error_hi 2.78e-01 1.64e-01 1.35e-01 1.44e-01 3.84e-01 4.00e-01 ph/cm2/s
======================================================================
Image
Pre-slew 15.0-350.0 keV image (Event data)
#   RAcent    DECcent   POSerr    Theta     Phi              Peak Cts       SNR   Name
   89.7569    79.6057   0.0081    42.7848   -56.4855         6.9553707     23.497 TRIG_00114299

Foreground time interval of the image:
-27.024  36.976 (delta_t =  64.000 [sec])
Background time interval of the image:
-299.024 -27.024 (delta_t = 272.000 [sec])
Light Curves
Note: The mask-weighted lightcurves have units of either count/det or counts/sec/det, where a det is 0.4 x 0.4 = 0.16 sq cm.
Full-time range; 1 s binning
Other quick-look light curves:
- 64 ms binning (zoomed)
- 16 ms binning (zoomed)
- 8 ms binning (zoomed)
- 2 ms binning (zoomed)
- SN=5 or 10 s binning (full-time range)
- Raw light curve
Spectra
- 64 ms binning (zoomed)
- 16 ms binning (zoomed)
- 8 ms binning (zoomed)
- 2 ms binning (zoomed)
- SN=5 or 10 s binning (full-time range)
- Raw light curve
Spectra
Notes:
- 1) The fitting includes the systematic errors.
- 2) When the burst includes telescope slew time periods, the fitting uses an average response file made from multiple 5-s response files through out the slew time plus single time preiod for the non-slew times, and weighted by the total counts in the corresponding time period using addrmf. An average response file is needed becuase a spectral fit using the pre-slew DRM will introduce some errors in both a spectral shape and a normalization if the PHA file contains a lot of the slew/post-slew time interval.
- 3) For fits to more complicated models (e.g. a power-law over a cutoff power-law), the BAT team has decided to require a chi-square improvement of more than 6 for each extra dof.
Time averaged spectrum fit using the average DRM
Power-law model
Time interval is from  -27.024 sec. to   36.976 sec.

Spectral model in power-law:
------------------------------------------------------------
Parameters  : value       lower 90%   higher 90%
Photon index: -1.61558     ( -0.0803746   0.0799302 )
Norm@50keV  : 7.62965E-03    ( -0.00036653   0.000365988 )
------------------------------------------------------------
#Fit statistic : Chi-Squared =          66.39 using 59 PHA bins.
# Reduced chi-squared =          1.165 for     57 degrees of freedom
# Null hypothesis probability =   1.847468e-01

Photon flux (15-150 keV)    in 64 sec: 0.985270 ( -0.04905  0.04915 ) ph/cm2/s
Energy fluence (15-150 keV)             : 4.5588e-06 ( -2.30072e-07  2.30812e-07 ) ergs/cm2
Cutoff power-law model

Time interval is from  -27.024 sec. to   36.976 sec.
Spectral model in the cutoff power-law:
------------------------------------------------------------
Parameters  : value       lower 90%   higher 90%
Photon index: -0.811554     ( -0.35491   0.385493 )
Epeak [keV] : 75.6229      ( -10.2138 20.9745 )
Norm@50keV  : 1.90201E-02    ( -0.00618305   0.0101375 )
------------------------------------------------------------
#Fit statistic : Chi-Squared =          49.95 using 59 PHA bins.
# Reduced chi-squared =         0.8919 for     56 degrees of freedom
# Null hypothesis probability =   7.021058e-01

Photon flux (15-150 keV)    in 64 sec: 0.947571 ( -0.051525  0.051607 ) ph/cm2/s
Energy fluence (15-150 keV)             : 4.34931e-06 ( -2.48587e-07  2.48917e-07 ) ergs/cm2
1-s peak spectrum fit
Power-law model
Time interval is from   -3.524 sec. to   -2.524 sec.

Spectral model in power-law:
------------------------------------------------------------
Parameters  : value       lower 90%   higher 90%
Photon index: -1.76259     ( -0.388687   0.349476 )
Norm@50keV  : 1.15633E-02    ( -0.00294315   0.00287506 )
------------------------------------------------------------
#Fit statistic : Chi-Squared =          70.55 using 59 PHA bins.
# Reduced chi-squared =          1.238 for     57 degrees of freedom
# Null hypothesis probability =   1.071270e-01

Photon flux (15-150 keV)    in 1 sec: 1.57088 ( -0.36762  0.36846 ) ph/cm2/s
Energy fluence (15-150 keV)             : 1.06655e-07 ( -2.72715e-08  2.77638e-08 ) ergs/cm2
Cutoff power-law model
Time interval is from   -3.524 sec. to   -2.524 sec.
Spectral model in the cutoff power-law:
------------------------------------------------------------
Parameters  : value       lower 90%   higher 90%
Photon index: 0.488276     ( -1.81511   3.18421 )
Epeak [keV] : 58.1992      ( -13.1713 31.1282 )
Norm@50keV  : 0.141246    ( -0.146024   3.79046 )
------------------------------------------------------------
#Fit statistic : Chi-Squared =          65.59 using 59 PHA bins.
# Reduced chi-squared =          1.171 for     56 degrees of freedom
# Null hypothesis probability =   1.784770e-01

Photon flux (15-150 keV)    in 1 sec: 1.46020 ( -0.38638  0.38351 ) ph/cm2/s
Energy fluence (15-150 keV)             : 1.02459e-07 ( -2.61616e-08  2.76478e-08 ) ergs/cm2
Time-resolved spectra
Distribution
T90 vs. Hardness ratio plot
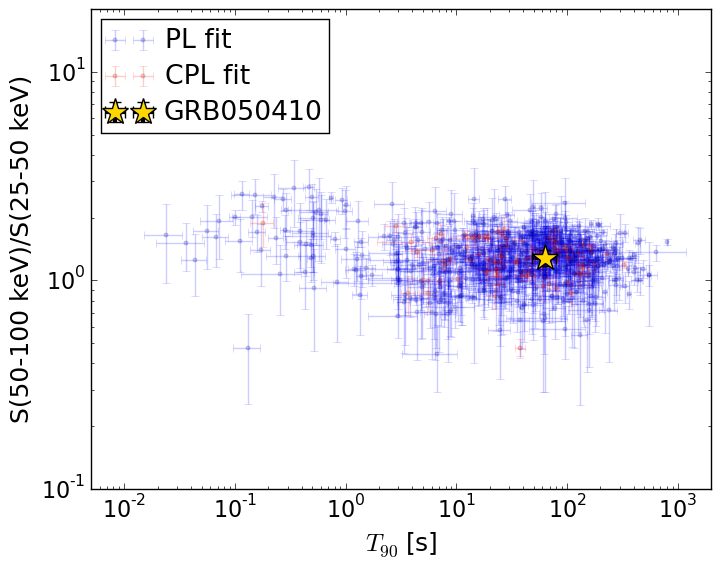
T90                                   = 64.0 sec.
Hardness ratio (energy fluence ratio) = 1.28330602739
S(15-50 keV) vs. S(50-150 keV) plot
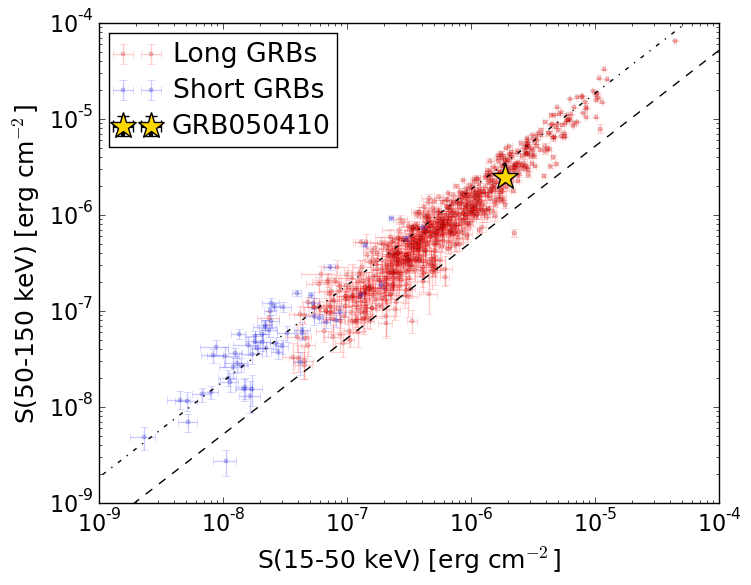
S(15-50 keV)  = 1.8780495e-06
S(50-150 keV) = 2.4712037e-06
The dash-dotted line and the dashed line traces the fluences calculated from the Band function with Epeak = 15 and 150 keV, respectively. Both lines assume a canonical values of alpha = -1 and beta = -2.5.
Mask shadow pattern
IMX = 5.110229724018497E-01, IMY = 7.716466227206255E-01
Spacecraft aspect plot
Bright source in the pre-burst/pre-slew/post-slew images
Pre-burst image of 15-350 keV band
Time interval of the image:
-299.024000 -27.024000

# RAcent  DECcent POSerr Theta    Phi  PeakCts   SNR AngSep     Name
#  [deg]    [deg]    ['] [deg]  [deg]                   [']
200.1700  66.8809    2.5  33.8  -12.1   0.7768   4.6 ------	UNKNOWN
107.1344  46.9426    3.1  32.8 -109.9   0.9508   3.7 ------	UNKNOWN
Pre-slew background subtracted image of 15-350 keV band
Time interval of the image:
-27.024000 36.976000

# RAcent  DECcent POSerr Theta    Phi  PeakCts   SNR AngSep     Name
#  [deg]    [deg]    ['] [deg]  [deg]                   [']
115.4790   2.8219    2.1  53.2 -171.3   1.1763   5.5 ------	UNKNOWN
 89.7573  79.6057    0.5  42.8  -56.5   6.9683  23.5 ------	UNKNOWN
Post-slew image of 15-350 keV band
Time interval of the image: