Analysis Summary
Notes:
- 1) No attempt has been made to eliminate the non-significant decimal places.
- 2) This batgrbproduct analysis is done using the HEASARC data.
- 3) This batgrbproduct analysis is using the flight position for the mask-weighting calculation.
======================================================================
                  BAT GRB EVENT DATA PROCESSING REPORT
    Process Script Ver: batgrbproduct v2.46
    Process Start Time: Wed Jan 22 22:27:04 EST 2014
             Host Name: batevent1
   Current Working Dir: /local/data/batevent/batevent_reproc/trigger114485
======================================================================

  Trigger: 00114485      Segment: 000

  BAT Trigger Time: 134977442.368   [s; MET]
      Trigger Stop: 134977444.416   [s; MET]
               UTC: 2005-04-12T05:44:02.894760    [includes UTCF correction]
       Where From?: TDRSS position message

  BAT
    RA: 181.120322462344   Dec: -1.25227292288913  [deg; J2000]

     Catalogged Source?: NO
     Point Source?:      YES
     GRB Indicated?:     YES    [ by BAT flight software ]
     Image S/N Ratio:    9
     Image Trigger?:     NO
     Rate S/N Ratio:     18.5741756210067  [ if not an image trigger ]
     Image S/N Ratio:    9

  Analysis Position:   [ source = BAT ]
    RA: 181.120322462344   Dec: -1.25227292288913  [deg; J2000]

  Refined Position:   [ source = BAT pre-slew burst ]
    RA: 181.101457535243   Dec: -1.18516071049333  [deg; J2000]
        { 12h 04m 24.3s , -01d 11' 06.6" }
         +/- 1.54742017871378 [arcmin] (estimated 90% radius based on SNR)
         +/- 0.884869962203484 [arcmin] (formal 1-sigma fit error)
    SNR: 16.3023211016515

  Angular difference between the analysis and refined position is 4.182725 arcmin

  Partial Coding Fraction: 0.953125    [ including projection effects ]

  Duration
     T90: 27.5719999969006 +/- 3.5047145410041
        Measured from: -6.31999999284744
                   to: 21.2520000040531     [s; relative to TRIGTIME]
     T50: 10.3760000169277 +/- 3.3321734677688
        Measured from: -1.63600000739098
                   to: 8.74000000953674     [s; relative to TRIGTIME]


  Fluence
     Peak Flux  (peak 1 second)
        Measured from: 1.14399999380112
                   to: 2.14399999380112     [s; relative to TRIGTIME]
     Total Fluence
        Measured from: -8.28400000929832
                   to: 23.9079999923706     [s; relative to TRIGTIME]

             Band 1     Band 2     Band 3     Band 4
              15-25      25-50     50-100    100-350     keV
 Total     0.127352   0.250516   0.323186   0.142428
           0.024029   0.025303   0.023015   0.020181 [error]
 Peak      0.013649   0.012926   0.031446   0.015349
           0.004278   0.004599   0.004391   0.003705 [error]

     [ fluence units of on-axis counts / fully illuminated detector ]

======================================================================


====== Table of the duration information =============================

        Value   tstart    tstop
T100   32.192   -8.284   23.908
T90    27.572   -6.320   21.252
T50    10.376   -1.636    8.740
Peak    1.000    1.144    2.144


====== Spectral Analysis Summary =====================================

Model      : spectral model: simple power-law (PL) and cutoff power-law (CPL)
Ph_index   : photon index: E^{Ph_index}
Ph_90err   : 90% error of the photon index
Epeak      : Epeak in keV
Epeak_90err: 90% error of Epeak
Norm       : normalization at 50 keV in both the PL model and CPL model
Nomr_90err : 90% error of the normalization
chi2       : Chi-Squared
dof        : degree of freedo

=== Time-averaged spectral analysis ===
(Best model with acceptable fit: PL)

Model Ph_index Ph_90err_low Ph_90err_hi  Epeak  Epeak_90err_low  Epeak_90err_hi  Norm       Nomr_90err_low    Norm_90err_hi    chi2    dof
PL      -0.696    -0.166      0.175       -           -               -         1.65e-03     -1.60e-04          1.56e-04      28.820   57
CPL     -0.695    -0.161      0.232     9999.360    -9999.360      -9999.360      1.66e-03     -1.50e-04          8.11e-04      28.850   56


=== 1-s peak spectral analysis ===
(Best model with acceptable fit: PL)

Model Ph_index Ph_90err_low Ph_90err_hi  Epeak  Epeak_90err_low  Epeak_90err_hi  Norm       Nomr_90err_low    Norm_90err_hi    chi2    dof
PL      -0.576     -0.363     0.410       -           -               -         4.17e-03     -9.71e-04          9.18e-04      69.030   57
CPL     -0.511     -0.425     1.901     8344.160    -8344.160      -8344.160      4.13e-03     -8.98e-04          -4.13e-03      69.080   56


=== Fluence/Peak Flux Summary ===

              Model    Band1     Band2     Band3     Band4     Band5     Total
                       15-25     25-50    50-100    100-350    15-150    15-350    keV
Fluence         PL   3.21e-08  9.71e-08  2.40e-07  1.66e-06  6.50e-07  2.03e-06   erg/cm2
      90%_error_low -6.71e-09 -1.25e-08 -2.08e-08 -3.38e-07 -5.80e-08 -3.44e-07   erg/cm2
      90%_error_hi   7.32e-09  1.23e-08  2.07e-08  4.06e-07  5.82e-08  4.06e-07   erg/cm2
Peak flux       PL   7.14e-02  1.25e-01  1.68e-01  4.63e-01  4.89e-01  8.28e-01   ph/cm2/s
      90%_error_low -3.23e-02 -3.89e-02 -3.20e-02 -1.74e-01 -9.84e-02 -1.85e-01   ph/cm2/s
      90%_error_hi   4.04e-02  3.85e-02  3.19e-02  2.45e-01  9.93e-02  2.20e-01   ph/cm2/s

Fluence        CPL   3.21e-08  9.71e-08  2.37e-07  1.75e-06  6.51e-07  2.01e-06   erg/cm2
      90%_error_low    N/A    -1.42e-08    N/A    -7.98e-07    N/A    -6.77e-07   erg/cm2
      90%_error_hi     N/A     1.41e-08    N/A     3.07e-07    N/A     1.80e-07   erg/cm2
Peak flux      CPL   6.96e-02  1.25e-01  1.69e-01  4.39e-01  4.88e-01  8.08e-01   ph/cm2/s
      90%_error_low -4.33e-02 -4.23e-02 -3.33e-02 -4.39e-01 -1.04e-01 -3.37e-01   ph/cm2/s
      90%_error_hi   2.97e-02  3.93e-02  4.47e-02  1.51e-01  9.25e-02  2.22e-01   ph/cm2/s

======================================================================
Image
Pre-slew 15.0-350.0 keV image (Event data)
#   RAcent    DECcent   POSerr    Theta     Phi              Peak Cts       SNR   Name
  181.1015    -1.1852   0.0118    12.0834   126.5380         0.8626790     16.302 TRIG_00114485

Foreground time interval of the image:
 -8.284  23.908 (delta_t =  32.192 [sec])
Background time interval of the image:
-130.067  -8.284 (delta_t = 121.783 [sec])
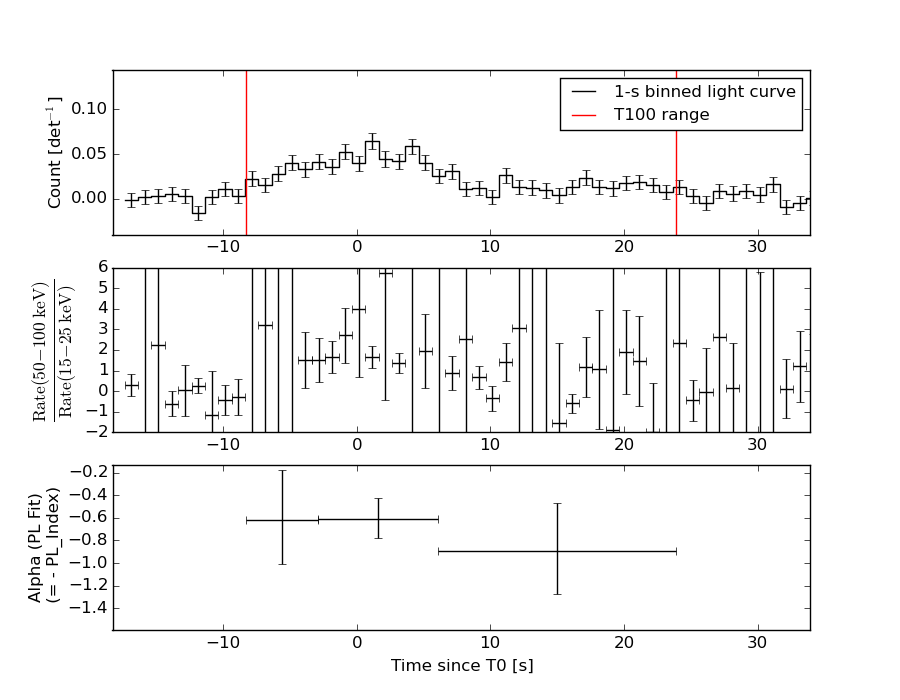
Light Curves
Note: The mask-weighted lightcurves have units of either count/det or counts/sec/det, where a det is 0.4 x 0.4 = 0.16 sq cm.
Full-time range; 1 s binning
Other quick-look light curves:
- 64 ms binning (zoomed)
- 16 ms binning (zoomed)
- 8 ms binning (zoomed)
- 2 ms binning (zoomed)
- SN=5 or 10 s binning (full-time range)
- Raw light curve
Spectra
- 64 ms binning (zoomed)
- 16 ms binning (zoomed)
- 8 ms binning (zoomed)
- 2 ms binning (zoomed)
- SN=5 or 10 s binning (full-time range)
- Raw light curve
Spectra
Notes:
- 1) The fitting includes the systematic errors.
- 2) When the burst includes telescope slew time periods, the fitting uses an average response file made from multiple 5-s response files through out the slew time plus single time preiod for the non-slew times, and weighted by the total counts in the corresponding time period using addrmf. An average response file is needed becuase a spectral fit using the pre-slew DRM will introduce some errors in both a spectral shape and a normalization if the PHA file contains a lot of the slew/post-slew time interval.
- 3) For fits to more complicated models (e.g. a power-law over a cutoff power-law), the BAT team has decided to require a chi-square improvement of more than 6 for each extra dof.
Time averaged spectrum fit using the average DRM
Power-law model
Time interval is from   -8.284 sec. to   23.908 sec.

Spectral model in power-law:
------------------------------------------------------------
Parameters  : value       lower 90%   higher 90%
Photon index: -0.69603     ( -0.165924   0.174526 )
Norm@50keV  : 1.65073E-03    ( -0.000159718   0.00015622 )
------------------------------------------------------------
#Fit statistic : Chi-Squared =          28.82 using 59 PHA bins.
# Reduced chi-squared =         0.5056 for     57 degrees of freedom
# Null hypothesis probability =   9.993234e-01

Photon flux (15-150 keV)    in 32.19 sec: 0.190867 ( -0.017109  0.017178 ) ph/cm2/s
Energy fluence (15-150 keV)             : 6.49832e-07 ( -5.79562e-08  5.82127e-08 ) ergs/cm2
Cutoff power-law model
Time interval is from   -8.284 sec. to   23.908 sec.
Spectral model in the cutoff power-law:
------------------------------------------------------------
Parameters  : value       lower 90%   higher 90%
Photon index: -0.694733     ( -0.161831   0.23078 )
Epeak [keV] : 9999.36      ( -9999.36 -9999.36 )
Norm@50keV  : 1.66457E-03    ( -0.000150669   0.000810041 )
------------------------------------------------------------
#Fit statistic : Chi-Squared =          28.85 using 59 PHA bins.
# Reduced chi-squared =         0.5153 for     56 degrees of freedom
# Null hypothesis probability =   9.990135e-01

Photon flux (15-150 keV)    in 32.19 sec: 0.190801 (    ) ph/cm2/s
Energy fluence (15-150 keV)             : 6.5121e-07 ( 0  0 ) ergs/cm2
1-s peak spectrum fit
Power-law model
Time interval is from    1.144 sec. to    2.144 sec.

Spectral model in power-law:
------------------------------------------------------------
Parameters  : value       lower 90%   higher 90%
Photon index: -0.576125     ( -0.36282   0.409774 )
Norm@50keV  : 4.17280E-03    ( -0.000970684   0.000918303 )
------------------------------------------------------------
#Fit statistic : Chi-Squared =          69.03 using 59 PHA bins.
# Reduced chi-squared =          1.211 for     57 degrees of freedom
# Null hypothesis probability =   1.319718e-01

Photon flux (15-150 keV)    in 1 sec: 0.488667 ( -0.098404  0.099282 ) ph/cm2/s
Energy fluence (15-150 keV)             : 5.39859e-08 ( -1.07385e-08  1.07761e-08 ) ergs/cm2
Cutoff power-law model
Time interval is from    1.144 sec. to    2.144 sec.
Spectral model in the cutoff power-law:
------------------------------------------------------------
Parameters  : value       lower 90%   higher 90%
Photon index: -0.566395     ( -0.425304   1.90074 )
Epeak [keV] : 10000.00      ( -10000 -10000 )
Norm@50keV  : 4.20733E-03    ( -0.000975811   -0.00420733 )
------------------------------------------------------------
#Fit statistic : Chi-Squared =          69.02 using 59 PHA bins.
# Reduced chi-squared =          1.233 for     56 degrees of freedom
# Null hypothesis probability =   1.134670e-01

Photon flux (15-150 keV)    in 1 sec: 0.487979 ( -0.103691  0.092516 ) ph/cm2/s
Energy fluence (15-150 keV)             : 5.40431e-08 ( -1.10746e-08  1.06399e-08 ) ergs/cm2
Time-resolved spectra
Distribution
T90 vs. Hardness ratio plot
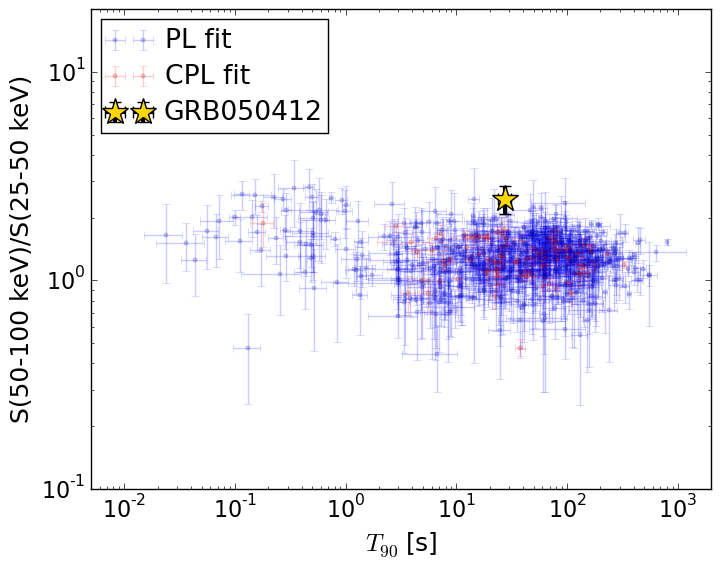
T90                                   = 27.572 sec.
Hardness ratio (energy fluence ratio) = 2.46910686862
S(15-50 keV) vs. S(50-150 keV) plot
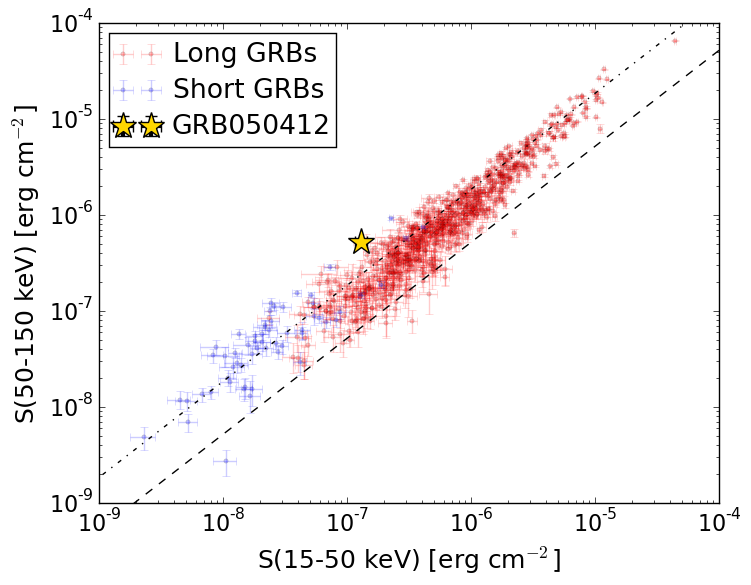
S(15-50 keV)  = 1.292616e-07
S(50-150 keV) = 5.20574e-07
The dash-dotted line and the dashed line traces the fluences calculated from the Band function with Epeak = 15 and 150 keV, respectively. Both lines assume a canonical values of alpha = -1 and beta = -2.5.
Mask shadow pattern
IMX = -1.274524455491652E-01, IMY = -1.720036888130351E-01
Spacecraft aspect plot
Bright source in the pre-burst/pre-slew/post-slew images
Pre-burst image of 15-350 keV band
Time interval of the image:
-130.067410 -8.284000

# RAcent  DECcent POSerr Theta    Phi  PeakCts   SNR AngSep     Name
#  [deg]    [deg]    ['] [deg]  [deg]                   [']
146.9640   3.7927    2.6  34.0 -150.1   0.5293   4.5 ------	UNKNOWN
Pre-slew background subtracted image of 15-350 keV band
Time interval of the image:
-8.284000 23.908000

# RAcent  DECcent POSerr Theta    Phi  PeakCts   SNR AngSep     Name
#  [deg]    [deg]    ['] [deg]  [deg]                   [']
150.9978 -35.3224    2.4  54.0  159.2   1.4152   4.8 ------	UNKNOWN
187.1191   1.3556    2.7  11.6   94.4   0.2325   4.3 ------	UNKNOWN
181.1016  -1.1851    0.7  12.1  126.5   0.8622  16.3 ------	UNKNOWN
134.1794  20.7838    2.1  45.5 -122.1   1.1989   5.4 ------	UNKNOWN
Post-slew image of 15-350 keV band
Time interval of the image:
81.732600 242.666900
243.632000 302.690100

# RAcent  DECcent POSerr Theta    Phi  PeakCts   SNR AngSep     Name
#  [deg]    [deg]    ['] [deg]  [deg]                   [']
135.4707 -40.5481   14.0  57.0 -161.2   0.5315   0.8    2.7	Vela X-1
214.0728  47.3180    2.1  56.4    4.7   4.0700   5.4 ------	UNKNOWN
179.7416  57.5918    3.3  58.8  -22.4   3.5666   3.5 ------	UNKNOWN