Analysis Summary
Notes:
- 1) No attempt has been made to eliminate the non-significant decimal places.
- 2) This batgrbproduct analysis is done using the HEASARC data.
- 3) This batgrbproduct analysis is using the flight position for the mask-weighting calculation.
======================================================================
BAT GRB EVENT DATA PROCESSING REPORT
Process Script Ver: batgrbproduct v2.46
Process Start Time: Wed Jan 22 22:24:45 EST 2014
Host Name: batevent1
Current Working Dir: /local/data/batevent/batevent_reproc/trigger114753
======================================================================
Trigger: 00114753 Segment: 000
BAT Trigger Time: 135342283.968 [s; MET]
Trigger Stop: 135342284.48 [s; MET]
UTC: 2005-04-16T11:04:44.488360 [includes UTCF correction]
Where From?: TDRSS position message
BAT
RA: 188.478556551299 Dec: 21.0434055593792 [deg; J2000]
Catalogged Source?: NO
Point Source?: YES
GRB Indicated?: YES [ by BAT flight software ]
Image S/N Ratio: 11
Image Trigger?: NO
Rate S/N Ratio: 19.2613602842582 [ if not an image trigger ]
Image S/N Ratio: 11
Analysis Position: [ source = BAT ]
RA: 188.478556551299 Dec: 21.0434055593792 [deg; J2000]
Refined Position: [ source = BAT pre-slew burst ]
RA: 188.47686787149 Dec: 21.0538092747204 [deg; J2000]
{ 12h 33m 54.4s , +21d 03' 13.7" }
+/- 1.75285249865101 [arcmin] (estimated 90% radius based on SNR)
+/- 0.660910674109587 [arcmin] (formal 1-sigma fit error)
SNR: 13.6430259639745
Angular difference between the analysis and refined position is 0.631345 arcmin
Partial Coding Fraction: 0.1679688 [ including projection effects ]
Duration
T90: 6.66800001263618 +/- 3.4220859219317
Measured from: 0.120000004768372
to: 6.78800001740456 [s; relative to TRIGTIME]
T50: 1.68400001525879 +/- 0.444504214428811
Measured from: 0.53999999165535
to: 2.22400000691414 [s; relative to TRIGTIME]
Fluence
Peak Flux (peak 1 second)
Measured from: 0.0320000052452087
to: 1.03200000524521 [s; relative to TRIGTIME]
Total Fluence
Measured from: -0.0119999945163727
to: 9.43999999761581 [s; relative to TRIGTIME]
Band 1 Band 2 Band 3 Band 4
15-25 25-50 50-100 100-350 keV
Total 0.569522 0.346547 0.022968 -0.006475
0.037993 0.038010 0.031542 0.027463 [error]
Peak 0.275511 0.204669 0.027581 -0.004014
0.017814 0.016605 0.011445 0.008957 [error]
[ fluence units of on-axis counts / fully illuminated detector ]
======================================================================
====== Table of the duration information =============================
Value tstart tstop
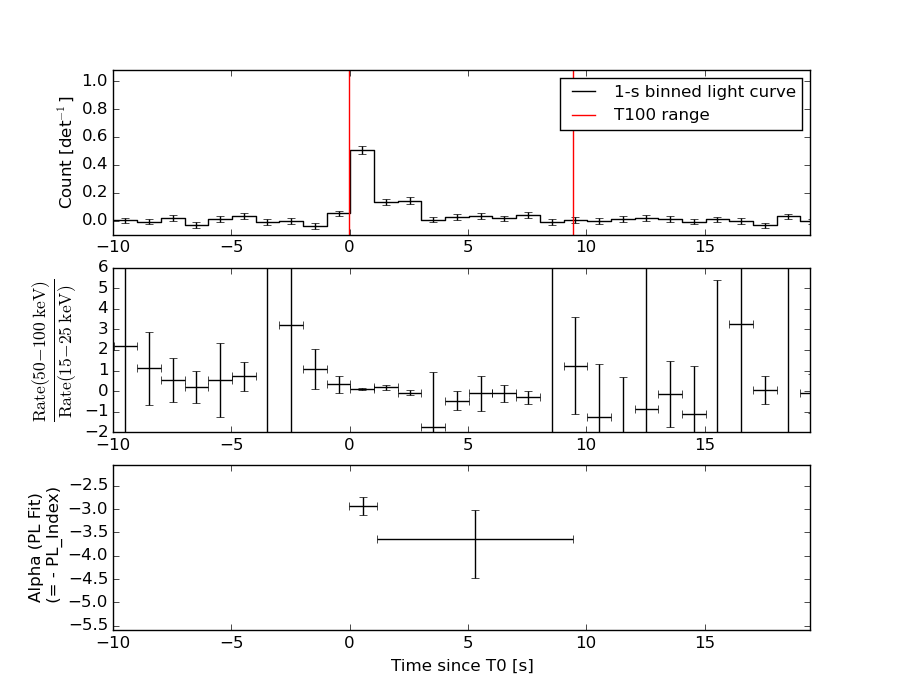
T100 9.452 -0.012 9.440
T90 6.668 0.120 6.788
T50 1.684 0.540 2.224
Peak 1.000 0.032 1.032
====== Spectral Analysis Summary =====================================
Model : spectral model: simple power-law (PL) and cutoff power-law (CPL)
Ph_index : photon index: E^{Ph_index}
Ph_90err : 90% error of the photon index
Epeak : Epeak in keV
Epeak_90err: 90% error of Epeak
Norm : normalization at 50 keV in both the PL model and CPL model
Nomr_90err : 90% error of the normalization
chi2 : Chi-Squared
dof : degree of freedo
=== Time-averaged spectral analysis ===
(Best model with acceptable fit: PL)
Model Ph_index Ph_90err_low Ph_90err_hi Epeak Epeak_90err_low Epeak_90err_hi Norm Nomr_90err_low Norm_90err_hi chi2 dof
PL -3.174 -0.304 0.273 - - - 3.34e-03 -7.97e-04 8.43e-04 60.960 57
CPL -0.823 -1.546 2.166 14.850 -14.082 7.133 1.44e-01 -1.44e-01 5.11e+00 53.250 56
=== 1-s peak spectral analysis ===
(Best model with acceptable fit: PL)
Model Ph_index Ph_90err_low Ph_90err_hi Epeak Epeak_90err_low Epeak_90err_hi Norm Nomr_90err_low Norm_90err_hi chi2 dof
PL -2.836 -0.200 0.187 - - - 1.98e-02 -3.14e-03 3.17e-03 60.280 57
CPL 0.097 -1.192 1.878 22.692 -6.053 3.847 1.86e+00 -1.86e+00 3.40e+01 39.530 56
=== Fluence/Peak Flux Summary ===
Model Band1 Band2 Band3 Band4 Band5 Total
15-25 25-50 50-100 100-350 15-150 15-350 keV
Fluence PL 2.00e-07 1.35e-07 5.99e-08 3.68e-08 4.13e-07 4.32e-07 erg/cm2
90%_error_low -2.45e-08 -2.10e-08 -1.80e-08 -1.68e-08 -5.32e-08 -6.05e-08 erg/cm2
90%_error_hi 2.47e-08 2.06e-08 2.10e-08 2.57e-08 5.52e-08 6.62e-08 erg/cm2
Peak flux PL 3.00e+00 1.39e+00 3.89e-01 1.36e-01 4.86e+00 4.91e+00 ph/cm2/s
90%_error_low -3.44e-01 -1.49e-01 -7.68e-02 -4.26e-02 -4.69e-01 -4.73e-01 ph/cm2/s
90%_error_hi 3.47e-01 1.48e-01 8.16e-02 5.38e-02 4.69e-01 4.73e-01 ph/cm2/s
Fluence CPL 1.94e-07 1.53e-07 2.62e-08 5.32e-10 3.74e-07 3.74e-07 erg/cm2
90%_error_low -2.68e-08 -2.63e-08 -1.66e-08 N/A -4.67e-08 -4.67e-08 erg/cm2
90%_error_hi 2.65e-08 2.66e-08 2.55e-08 N/A 5.05e-08 5.07e-08 erg/cm2
Peak flux CPL N/A N/A N/A N/A N/A N/A ph/cm2/s
90%_error_low -3.44e-01 -1.49e-01 -7.68e-02 -4.26e-02 -4.69e-01 -4.73e-01 ph/cm2/s
90%_error_hi 3.47e-01 1.48e-01 8.16e-02 5.38e-02 4.69e-01 4.73e-01 ph/cm2/s
======================================================================
Image
Pre-slew 15.0-350.0 keV image (Event data)
#   RAcent    DECcent   POSerr    Theta     Phi              Peak Cts       SNR   Name
  188.4769    21.0538   0.0141    36.2674    79.1129         0.9455894     13.643 TRIG_00114753

Foreground time interval of the image:
 -0.012   9.333 (delta_t =   9.345 [sec])
Background time interval of the image:
-299.968  -0.012 (delta_t = 299.956 [sec])
Light Curves
Note: The mask-weighted lightcurves have units of either count/det or counts/sec/det, where a det is 0.4 x 0.4 = 0.16 sq cm.
Full-time range; 1 s binning
Other quick-look light curves:
- 64 ms binning (zoomed)
- 16 ms binning (zoomed)
- 8 ms binning (zoomed)
- 2 ms binning (zoomed)
- SN=5 or 10 s binning (full-time range)
- Raw light curve
Spectra
- 64 ms binning (zoomed)
- 16 ms binning (zoomed)
- 8 ms binning (zoomed)
- 2 ms binning (zoomed)
- SN=5 or 10 s binning (full-time range)
- Raw light curve
Spectra
Notes:
- 1) The fitting includes the systematic errors.
- 2) When the burst includes telescope slew time periods, the fitting uses an average response file made from multiple 5-s response files through out the slew time plus single time preiod for the non-slew times, and weighted by the total counts in the corresponding time period using addrmf. An average response file is needed becuase a spectral fit using the pre-slew DRM will introduce some errors in both a spectral shape and a normalization if the PHA file contains a lot of the slew/post-slew time interval.
- 3) For fits to more complicated models (e.g. a power-law over a cutoff power-law), the BAT team has decided to require a chi-square improvement of more than 6 for each extra dof.
Time averaged spectrum fit using the average DRM
Power-law model
Time interval is from   -0.012 sec. to    9.440 sec.

Spectral model in power-law:
------------------------------------------------------------
Parameters  : value       lower 90%   higher 90%
Photon index: -3.17416     ( -0.3039   0.272504 )
Norm@50keV  : 3.33738E-03    ( -0.000797009   0.000842413 )
------------------------------------------------------------
#Fit statistic : Chi-Squared =          60.96 using 59 PHA bins.
# Reduced chi-squared =          1.069 for     57 degrees of freedom
# Null hypothesis probability =   3.355056e-01

Photon flux (15-150 keV)    in 9.452 sec: 1.04496 ( -0.114004  0.11402 ) ph/cm2/s
Energy fluence (15-150 keV)             : 4.12861e-07 ( -5.32075e-08  5.51695e-08 ) ergs/cm2
Cutoff power-law model
Time interval is from   -0.012 sec. to    9.440 sec.
Spectral model in the cutoff power-law:
------------------------------------------------------------
Parameters  : value       lower 90%   higher 90%
Photon index: -0.823352     ( -1.5616   2.15025 )
Epeak [keV] : 14.8495      ( -14.2426 6.97238 )
Norm@50keV  : 0.144340    ( -0.152651   5.0998 )
------------------------------------------------------------
#Fit statistic : Chi-Squared =          53.25 using 59 PHA bins.
# Reduced chi-squared =         0.9510 for     56 degrees of freedom
# Null hypothesis probability =   5.794347e-01

Photon flux (15-150 keV)    in 9.452 sec: 1.01187 ( -0.113623  0.11388 ) ph/cm2/s
Energy fluence (15-150 keV)             : 3.73511e-07 ( -4.67021e-08  5.04967e-08 ) ergs/cm2
1-s peak spectrum fit
Power-law model
Time interval is from    0.032 sec. to    1.032 sec.

Spectral model in power-law:
------------------------------------------------------------
Parameters  : value       lower 90%   higher 90%
Photon index: -2.83634     ( -0.200532   0.186671 )
Norm@50keV  : 1.98356E-02    ( -0.00314318   0.00316919 )
------------------------------------------------------------
#Fit statistic : Chi-Squared =          60.28 using 59 PHA bins.
# Reduced chi-squared =          1.057 for     57 degrees of freedom
# Null hypothesis probability =   3.581407e-01

Photon flux (15-150 keV)    in 1 sec: 4.85682 ( -0.46862  0.4687 ) ph/cm2/s
Energy fluence (15-150 keV)             : 2.22177e-07 ( -2.38919e-08  2.42339e-08 ) ergs/cm2
Cutoff power-law model
Time interval is from    0.032 sec. to    1.032 sec.
Spectral model in the cutoff power-law:
------------------------------------------------------------
Parameters  : value       lower 90%   higher 90%
Photon index: 0.0972727     ( -1.36841   1.70122 )
Epeak [keV] : 22.6922      ( -6.46625 3.4344 )
Norm@50keV  : 1.85712    ( -2.5168   33.3202 )
------------------------------------------------------------
#Fit statistic : Chi-Squared =          39.53 using 59 PHA bins.
# Reduced chi-squared =         0.7059 for     56 degrees of freedom
# Null hypothesis probability =   9.532723e-01

Photon flux (15-150 keV)    in 1 sec:  (    ) ph/cm2/s
Energy fluence (15-150 keV)             : 0 ( 0  0 ) ergs/cm2
Time-resolved spectra
Distribution
T90 vs. Hardness ratio plot
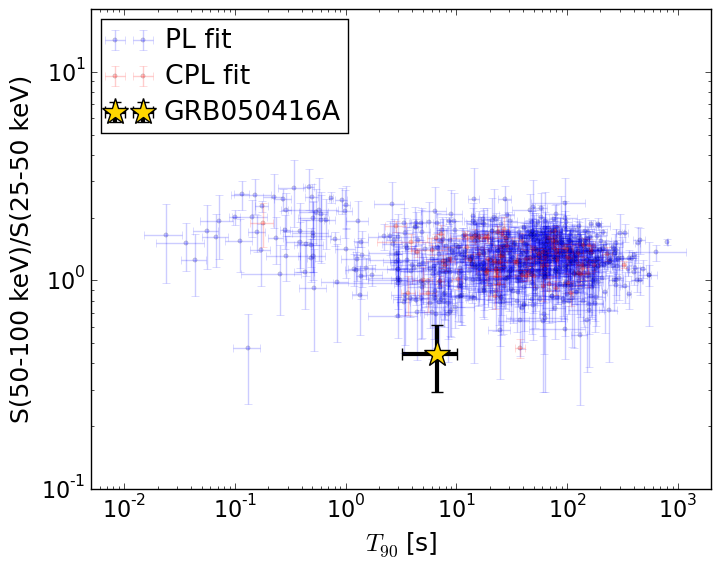
T90                                   = 6.668 sec.
Hardness ratio (energy fluence ratio) = 0.443220610297
S(15-50 keV) vs. S(50-150 keV) plot
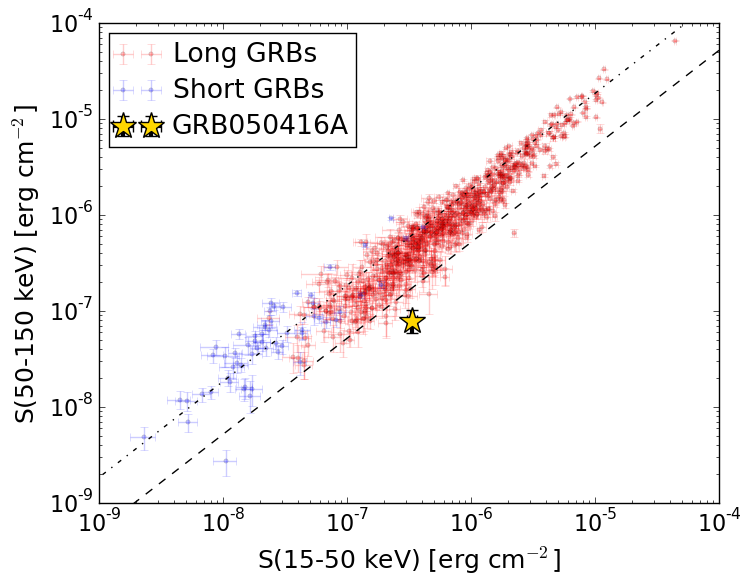
S(15-50 keV)  = 3.348595e-07
S(50-150 keV) = 7.801658e-08
The dash-dotted line and the dashed line traces the fluences calculated from the Band function with Epeak = 15 and 150 keV, respectively. Both lines assume a canonical values of alpha = -1 and beta = -2.5.
Mask shadow pattern
IMX = 1.385760221107429E-01, IMY = -7.204914652107425E-01
Spacecraft aspect plot
Bright source in the pre-burst/pre-slew/post-slew images
Pre-burst image of 15-350 keV band
Time interval of the image:
-299.968000 -0.012000

# RAcent  DECcent POSerr Theta    Phi  PeakCts   SNR AngSep     Name
#  [deg]    [deg]    ['] [deg]  [deg]                   [']
211.1648  42.3402    2.5  40.9   33.1   1.5331   4.6 ------	UNKNOWN
149.2186  19.7230    2.3  24.2  153.3   0.9291   5.1 ------	UNKNOWN
143.6562  36.2225    2.3  10.9 -166.9   0.8580   5.1 ------	UNKNOWN
176.6087  60.2915    2.9  21.5   -7.1   0.6519   4.1 ------	UNKNOWN
111.6727  -1.5350    3.0  59.0 -166.1   4.1083   3.9 ------	UNKNOWN
293.6117  77.6150    2.8  56.3  -28.5   4.0707   4.2 ------	UNKNOWN
Pre-slew background subtracted image of 15-350 keV band
Time interval of the image:
-0.012000 9.332590

# RAcent  DECcent POSerr Theta    Phi  PeakCts   SNR AngSep     Name
#  [deg]    [deg]    ['] [deg]  [deg]                   [']
188.4769  21.0538    0.8  36.3   79.1   0.9457  13.6 ------	UNKNOWN
161.3095   6.4395    2.7  37.6  130.2   0.2522   4.2 ------	UNKNOWN
137.0235   3.8980    2.2  42.5  167.7   0.2360   5.1 ------	UNKNOWN
Post-slew image of 15-350 keV band
Time interval of the image:
63.532590 302.065900

# RAcent  DECcent POSerr Theta    Phi  PeakCts   SNR AngSep     Name
#  [deg]    [deg]    ['] [deg]  [deg]                   [']
229.3219   6.5356    3.3  42.1   42.6   1.3705   3.6 ------	UNKNOWN
250.2189  36.4391    2.7  55.3   -2.0   2.2245   4.3 ------	UNKNOWN
190.6927  26.0788    2.6   5.4  -40.0   0.5806   4.5 ------	UNKNOWN
157.2431  19.7974    2.7  29.3 -148.3   0.6622   4.2 ------	UNKNOWN
157.4041  32.5332    3.1  29.9 -122.4   0.7169   3.7 ------	UNKNOWN
163.1037  43.1841    2.4  30.6  -99.4   1.0572   4.7 ------	UNKNOWN