Analysis Summary
Notes:
- 1) No attempt has been made to eliminate the non-significant decimal places.
- 2) This batgrbproduct analysis is done using the HEASARC data.
- 3) This batgrbproduct analysis is using the flight position for the mask-weighting calculation.
======================================================================
                  BAT GRB EVENT DATA PROCESSING REPORT
    Process Script Ver: batgrbproduct v2.46
    Process Start Time: Wed Jan 22 22:16:09 EST 2014
             Host Name: batevent1
   Current Working Dir: /local/data/batevent/batevent_reproc/trigger115135
======================================================================

  Trigger: 00115135      Segment: 000

  BAT Trigger Time: 135749511.104   [s; MET]
      Trigger Stop: 135749516.608   [s; MET]
               UTC: 2005-04-21T04:11:51.617220    [includes UTCF correction]
       Where From?: TDRSS position message

  BAT
    RA: 307.241049309564   Dec: 73.6651583611281  [deg; J2000]

     Catalogged Source?: NO
     Point Source?:      YES
     GRB Indicated?:     YES    [ by BAT flight software ]
     Image S/N Ratio:    6
     Image Trigger?:     NO
     Rate S/N Ratio:     9.8488578017961  [ if not an image trigger ]
     Image S/N Ratio:    6

  Analysis Position:   [ source = BAT ]
    RA: 307.241049309564   Dec: 73.6651583611281  [deg; J2000]

  Refined Position:   [ source = BAT pre-slew burst ]
    RA: 307.381074949612   Dec: 73.6735775238724  [deg; J2000]
        { 20h 29m 31.5s , +73d 40' 24.9" }
         +/- 2.80921756557008 [arcmin] (estimated 90% radius based on SNR)
         +/- 1.23115512917753 [arcmin] (formal 1-sigma fit error)
    SNR: 6.95475971002607

  Angular difference between the analysis and refined position is 2.415748 arcmin

  Partial Coding Fraction: 0.875    [ including projection effects ]

  Duration
     T90: 8.40800002217293 +/- 3.38710555700506
        Measured from: 0.199999988079071
                   to: 8.608000010252     [s; relative to TRIGTIME]
     T50: 4.02400001883507 +/- 3.04489934600471
        Measured from: 0.951999992132187
                   to: 4.97600001096725     [s; relative to TRIGTIME]


  Fluence
     Peak Flux  (peak 1 second)
        Measured from: 0.403999984264374
                   to: 1.40399998426437     [s; relative to TRIGTIME]
     Total Fluence
        Measured from: 0.0439999997615814
                   to: 8.74000000953674     [s; relative to TRIGTIME]

             Band 1     Band 2     Band 3     Band 4
              15-25      25-50     50-100    100-350     keV
 Total     0.047390   0.058978   0.041760   0.012214
           0.013194   0.013827   0.012153   0.010354 [error]
 Peak      0.016528   0.015836   0.016000   0.003038
           0.004604   0.004824   0.004292   0.003581 [error]

     [ fluence units of on-axis counts / fully illuminated detector ]

======================================================================


====== Table of the duration information =============================

        Value   tstart    tstop
T100    8.696    0.044    8.740
T90     8.408    0.200    8.608
T50     4.024    0.952    4.976
Peak    1.000    0.404    1.404


====== Spectral Analysis Summary =====================================

Model      : spectral model: simple power-law (PL) and cutoff power-law (CPL)
Ph_index   : photon index: E^{Ph_index}
Ph_90err   : 90% error of the photon index
Epeak      : Epeak in keV
Epeak_90err: 90% error of Epeak
Norm       : normalization at 50 keV in both the PL model and CPL model
Nomr_90err : 90% error of the normalization
chi2       : Chi-Squared
dof        : degree of freedo

=== Time-averaged spectral analysis ===
(Best model with acceptable fit: PL)

Model Ph_index Ph_90err_low Ph_90err_hi  Epeak  Epeak_90err_low  Epeak_90err_hi  Norm       Nomr_90err_low    Norm_90err_hi    chi2    dof
PL      -1.666    -0.452      0.416       -           -               -         1.15e-03     -3.24e-04          3.13e-04      31.140   57
CPL     -0.428    -1.706      3.056       58.096     -44.749       -58.096      5.37e-03     -5.37e-03          2.21e-01      30.070   56


=== 1-s peak spectral analysis ===
(Best model with acceptable fit: PL)

Model Ph_index Ph_90err_low Ph_90err_hi  Epeak  Epeak_90err_low  Epeak_90err_hi  Norm       Nomr_90err_low    Norm_90err_hi    chi2    dof
PL      -1.627     -0.497     0.458       -           -               -         3.33e-03     -9.87e-04          9.40e-04      52.850   57
CPL     -1.376     -1.045     1.959      117.892    -117.892      -117.892      4.54e-03     -4.54e-03          4.26e-02      52.880   56


=== Fluence/Peak Flux Summary ===

              Model    Band1     Band2     Band3     Band4     Band5     Total
                       15-25     25-50    50-100    100-350    15-150    15-350    keV
Fluence         PL   1.49e-08  2.48e-08  3.13e-08  7.86e-08  9.29e-08  1.50e-07   erg/cm2
      90%_error_low -5.27e-09 -6.15e-09 -1.14e-08 -4.54e-08 -2.68e-08 -5.92e-08   erg/cm2
      90%_error_hi   5.67e-09  6.13e-09  1.15e-08  7.34e-08  2.78e-08  8.16e-08   erg/cm2
Peak flux       PL   1.55e-01  1.44e-01  9.35e-02  9.35e-02  4.31e-01  4.86e-01   ph/cm2/s
      90%_error_low -6.08e-02 -3.85e-02 -3.51e-02 -5.47e-02 -1.13e-01 -1.30e-01   ph/cm2/s
      90%_error_hi   6.61e-02  3.82e-02  3.45e-02  8.58e-02  1.13e-01  1.32e-01   ph/cm2/s

Fluence        CPL   1.28e-08  2.85e-08  3.18e-08  1.62e-08  8.44e-08  8.94e-08   erg/cm2
      90%_error_low -6.60e-09 -1.03e-08 -1.40e-08    N/A    -2.67e-08 -3.14e-08   erg/cm2
      90%_error_hi   6.65e-09  9.16e-09  1.34e-08    N/A     3.08e-08  8.74e-08   erg/cm2
Peak flux      CPL   1.54e-01  1.45e-01  9.39e-02  8.72e-02  4.31e-01  4.80e-01   ph/cm2/s
      90%_error_low     N/A   -3.90e-02 -3.55e-02 -8.72e-02 -1.15e-01 -1.55e-01   ph/cm2/s
      90%_error_hi      N/A    5.05e-02  3.86e-02  5.25e-02  1.13e-01  1.35e-01   ph/cm2/s

======================================================================
Image
Pre-slew 15.0-350.0 keV image (Event data)
#   RAcent    DECcent   POSerr    Theta     Phi              Peak Cts       SNR   Name
  307.3811    73.6736   0.0276    25.3449     3.9284         0.1676551      6.955 TRIG_00115135

Foreground time interval of the image:
  0.044   8.740 (delta_t =   8.696 [sec])
Background time interval of the image:
-250.803   0.044 (delta_t = 250.847 [sec])
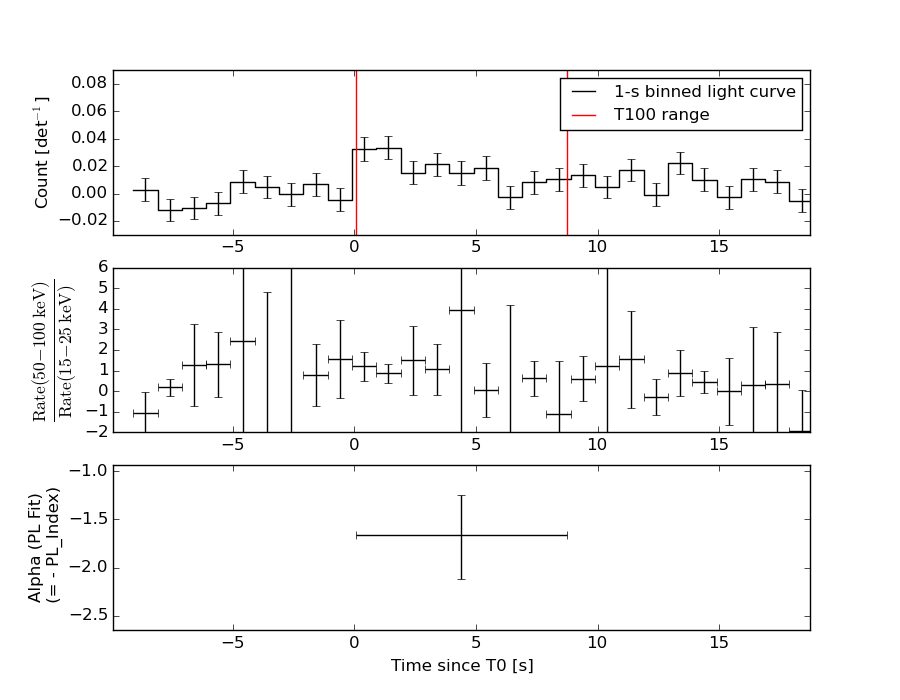
Light Curves
Note: The mask-weighted lightcurves have units of either count/det or counts/sec/det, where a det is 0.4 x 0.4 = 0.16 sq cm.
Full-time range; 1 s binning
Other quick-look light curves:
- 64 ms binning (zoomed)
- 16 ms binning (zoomed)
- 8 ms binning (zoomed)
- 2 ms binning (zoomed)
- SN=5 or 10 s binning (full-time range)
- Raw light curve
Spectra
- 64 ms binning (zoomed)
- 16 ms binning (zoomed)
- 8 ms binning (zoomed)
- 2 ms binning (zoomed)
- SN=5 or 10 s binning (full-time range)
- Raw light curve
Spectra
Notes:
- 1) The fitting includes the systematic errors.
- 2) When the burst includes telescope slew time periods, the fitting uses an average response file made from multiple 5-s response files through out the slew time plus single time preiod for the non-slew times, and weighted by the total counts in the corresponding time period using addrmf. An average response file is needed becuase a spectral fit using the pre-slew DRM will introduce some errors in both a spectral shape and a normalization if the PHA file contains a lot of the slew/post-slew time interval.
- 3) For fits to more complicated models (e.g. a power-law over a cutoff power-law), the BAT team has decided to require a chi-square improvement of more than 6 for each extra dof.
Time averaged spectrum fit using the average DRM
Power-law model
Time interval is from    0.044 sec. to    8.740 sec.

Spectral model in power-law:
------------------------------------------------------------
Parameters  : value       lower 90%   higher 90%
Photon index: -1.66565     ( -0.452092   0.415899 )
Norm@50keV  : 1.15066E-03    ( -0.000323846   0.000312581 )
------------------------------------------------------------
#Fit statistic : Chi-Squared =          31.14 using 59 PHA bins.
# Reduced chi-squared =         0.5464 for     57 degrees of freedom
# Null hypothesis probability =   9.979263e-01

Photon flux (15-150 keV)    in 8.696 sec: 0.151038 ( -0.037403  0.037422 ) ph/cm2/s
Energy fluence (15-150 keV)             : 9.29307e-08 ( -2.68142e-08  2.77977e-08 ) ergs/cm2
Cutoff power-law model
Time interval is from    0.044 sec. to    8.740 sec.
Spectral model in the cutoff power-law:
------------------------------------------------------------
Parameters  : value       lower 90%   higher 90%
Photon index: -0.4278     ( -1.70978   3.05239 )
Epeak [keV] : 58.0957      ( -44.7126 -58.0588 )
Norm@50keV  : 5.36831E-03    ( -0.00539887   0.221247 )
------------------------------------------------------------
#Fit statistic : Chi-Squared =          30.07 using 59 PHA bins.
# Reduced chi-squared =         0.5370 for     56 degrees of freedom
# Null hypothesis probability =   9.982266e-01

Photon flux (15-150 keV)    in 8.696 sec: 0.144767 ( -0.038974  0.038911 ) ph/cm2/s
Energy fluence (15-150 keV)             : 8.43995e-08 ( -2.66711e-08  3.07971e-08 ) ergs/cm2
1-s peak spectrum fit
Power-law model
Time interval is from    0.404 sec. to    1.404 sec.

Spectral model in power-law:
------------------------------------------------------------
Parameters  : value       lower 90%   higher 90%
Photon index: -1.62731     ( -0.497155   0.458429 )
Norm@50keV  : 3.32778E-03    ( -0.00098682   0.000940142 )
------------------------------------------------------------
#Fit statistic : Chi-Squared =          52.85 using 59 PHA bins.
# Reduced chi-squared =         0.9271 for     57 degrees of freedom
# Null hypothesis probability =   6.315865e-01

Photon flux (15-150 keV)    in 1 sec: 0.431348 ( -0.112845  0.112916 ) ph/cm2/s
Energy fluence (15-150 keV)             : 3.10277e-08 ( -9.48848e-09  9.78168e-09 ) ergs/cm2
Cutoff power-law model

Time interval is from    0.404 sec. to    1.404 sec.
Spectral model in the cutoff power-law:
------------------------------------------------------------
Parameters  : value       lower 90%   higher 90%
Photon index: -1.59496     ( -0.9523   2.0521 )
Epeak [keV] : 589.988      ( -567.36 -567.36 )
Norm@50keV  : 3.46381E-03    ( -0.00350064   0.0436363 )
------------------------------------------------------------
#Fit statistic : Chi-Squared =          52.84 using 59 PHA bins.
# Reduced chi-squared =         0.9436 for     56 degrees of freedom
# Null hypothesis probability =   5.950983e-01

Photon flux (15-150 keV)    in 1 sec: 0.430702 ( -0.115237  0.113433 ) ph/cm2/s
Energy fluence (15-150 keV)             : 3.09065e-08 ( -1.02684e-08  9.83997e-09 ) ergs/cm2
Time-resolved spectra
Distribution
T90 vs. Hardness ratio plot
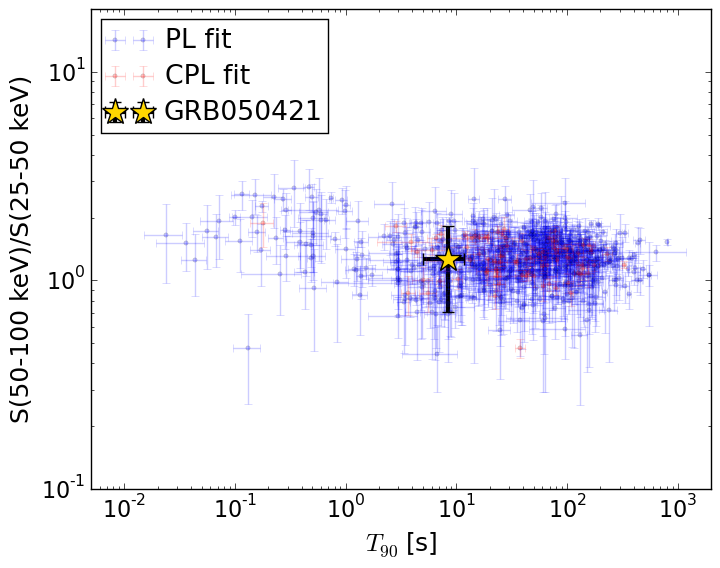
T90                                   = 8.408 sec.
Hardness ratio (energy fluence ratio) = 1.26081077484
S(15-50 keV) vs. S(50-150 keV) plot
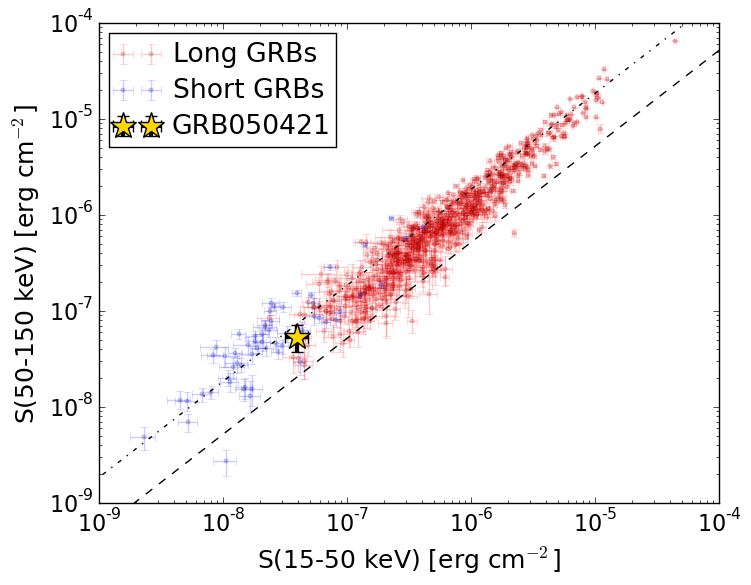
S(15-50 keV)  = 3.972598e-08
S(50-150 keV) = 5.320651e-08
The dash-dotted line and the dashed line traces the fluences calculated from the Band function with Epeak = 15 and 150 keV, respectively. Both lines assume a canonical values of alpha = -1 and beta = -2.5.
Mask shadow pattern
IMX = 4.725450849780354E-01, IMY = -3.245009793947397E-02
Spacecraft aspect plot

Bright source in the pre-burst/pre-slew/post-slew images
Pre-burst image of 15-350 keV band
Time interval of the image:
-250.803400 0.044000

# RAcent  DECcent POSerr Theta    Phi  PeakCts   SNR AngSep     Name
#  [deg]    [deg]    ['] [deg]  [deg]                   [']
308.0628  40.9984    4.6  57.4   -6.1   1.8859   2.5    3.5	Cyg X-3
326.0003  38.3083    5.2  57.9  -22.7   1.8428   2.2    8.1	Cyg X-2
253.9097  58.0731    2.7  42.0   40.1   1.4334   4.3 ------	UNKNOWN
153.1207  49.7330    3.2  36.6  131.9   1.0670   3.6 ------	UNKNOWN
295.2403  50.2489    2.2  49.3    6.3   1.7261   5.2 ------	UNKNOWN
 99.4789  38.2035    3.3  41.6 -163.9   0.8414   3.5 ------	UNKNOWN
350.6430  41.7161    2.7  50.7  -44.6   3.0143   4.2 ------	UNKNOWN
 57.5226  37.9424    2.3  43.5 -114.7   3.2236   5.0 ------	UNKNOWN
 70.4344  31.7454    3.4  48.5 -130.3   2.7811   3.4 ------	UNKNOWN
Pre-slew background subtracted image of 15-350 keV band
Time interval of the image:
0.044000 8.740000

# RAcent  DECcent POSerr Theta    Phi  PeakCts   SNR AngSep     Name
#  [deg]    [deg]    ['] [deg]  [deg]                   [']
308.1880  40.8724    7.5  57.5   -6.2   0.2152   1.6    6.0	Cyg X-3
325.9982  38.3266    6.3  57.9  -22.7  -0.2426  -1.8    8.2	Cyg X-2
307.3804  73.6743    1.6  25.3    3.9   0.1705   7.1 ------	UNKNOWN
301.0211  45.3782    2.5  53.7    0.7   0.3854   4.6 ------	UNKNOWN
Post-slew image of 15-350 keV band
Time interval of the image:
97.596600 302.964200

# RAcent  DECcent POSerr Theta    Phi  PeakCts   SNR AngSep     Name
#  [deg]    [deg]    ['] [deg]  [deg]                   [']
299.5853  35.2003    0.3  38.6    5.5   7.1891  38.5    0.3	Cyg X-1
308.0869  41.0028    1.7  32.7   -5.7   1.0812   7.0    3.2	Cyg X-3
325.9959  38.2290    5.0  36.6  -29.6   0.4617   2.3   10.0	Cyg X-2