Analysis Summary
Notes:
- 1) No attempt has been made to eliminate the non-significant decimal places.
- 2) This batgrbproduct analysis is done using the HEASARC data.
- 3) This batgrbproduct analysis is using the flight position for the mask-weighting calculation.
======================================================================
                  BAT GRB EVENT DATA PROCESSING REPORT
    Process Script Ver: batgrbproduct v2.46
    Process Start Time: Wed Jan 22 21:59:26 EST 2014
             Host Name: batevent1
   Current Working Dir: /local/data/batevent/batevent_reproc/trigger130088
======================================================================

  Trigger: 00130088      Segment: 000

  BAT Trigger Time: 138672173.056   [s; MET]
      Trigger Stop: 138672173.12   [s; MET]
               UTC: 2005-05-25T00:02:53.517080    [includes UTCF correction]
       Where From?: (*SHORT BURST*) TDRSS scaled map message

  BAT
    RA: 278.144062379166   Dec: 26.3398415321529  [deg; J2000]

     Catalogged Source?: NO
     Point Source?:      YES
     GRB Indicated?:     YES    [ by BAT flight software ]
     Image S/N Ratio:    18
     Image Trigger?:     NO
     Rate S/N Ratio:     81.2834546509928  [ if not an image trigger ]
     Image S/N Ratio:    18

  Analysis Position:   [ source = BAT ]
    RA: 278.144062379166   Dec: 26.3398415321529  [deg; J2000]

  Refined Position:   [ source = BAT pre-slew burst ]
    RA: 278.138110425539   Dec: 26.3393182721794  [deg; J2000]
        { 18h 32m 33.1s , +26d 20' 21.5" }
         +/- 0.339732639503496 [arcmin] (estimated 90% radius based on SNR)
         +/- 0.0981280526302253 [arcmin] (formal 1-sigma fit error)
    SNR: 142.207425874992

  Angular difference between the analysis and refined position is 0.321578 arcmin

  Partial Coding Fraction: 0.78125    [ including projection effects ]

  Duration
     T90: 8.83599999547005 +/- 0.0708802014549775
        Measured from: 0.328000009059906
                   to: 9.16400000452995     [s; relative to TRIGTIME]
     T50: 5.22400000691414 +/- 0.0256125069658732
        Measured from: 1.37200000882149
                   to: 6.59600001573563     [s; relative to TRIGTIME]


  Fluence
     Peak Flux  (peak 1 second)
        Measured from: 0.543999999761581
                   to: 1.54399999976158     [s; relative to TRIGTIME]
     Total Fluence
        Measured from: -0.120000004768372
                   to: 12.6759999990463     [s; relative to TRIGTIME]

             Band 1     Band 2     Band 3     Band 4
              15-25      25-50     50-100    100-350     keV
 Total     7.144629  10.285507   7.008009   1.181263
           0.038927   0.045504   0.039560   0.024059 [error]
 Peak      1.098535   1.982178   1.730768   0.376896
           0.014593   0.019074   0.018561   0.010591 [error]

     [ fluence units of on-axis counts / fully illuminated detector ]

======================================================================


====== Table of the duration information =============================

        Value   tstart    tstop
T100   12.796   -0.120   12.676
T90     8.836    0.328    9.164
T50     5.224    1.372    6.596
Peak    1.000    0.544    1.544


====== Spectral Analysis Summary =====================================

Model      : spectral model: simple power-law (PL) and cutoff power-law (CPL)
Ph_index   : photon index: E^{Ph_index}
Ph_90err   : 90% error of the photon index
Epeak      : Epeak in keV
Epeak_90err: 90% error of Epeak
Norm       : normalization at 50 keV in both the PL model and CPL model
Nomr_90err : 90% error of the normalization
chi2       : Chi-Squared
dof        : degree of freedo

=== Time-averaged spectral analysis ===
(Best model with acceptable fit: CPL)

Model Ph_index Ph_90err_low Ph_90err_hi  Epeak  Epeak_90err_low  Epeak_90err_hi  Norm       Nomr_90err_low    Norm_90err_hi    chi2    dof
PL      -1.783     N/A       N/A          -           -               -         1.32e-01        N/A               N/A        212.750   57
CPL     -1.026    -0.100      0.102       80.400      -2.918         3.478      2.67e-01     -2.29e-02          2.55e-02      25.900   56


=== 1-s peak spectral analysis ===
(Best model with acceptable fit: N/A)

Model Ph_index Ph_90err_low Ph_90err_hi  Epeak  Epeak_90err_low  Epeak_90err_hi  Norm       Nomr_90err_low    Norm_90err_hi    chi2    dof
PL      -1.400      N/A       N/A          -           -               -         3.60e-01        N/A               N/A        165.620   57
CPL     -0.603     -0.125     0.128      106.319      -6.786         8.837      7.76e-01     -8.54e-02          9.82e-02      31.120   56


=== Fluence/Peak Flux Summary ===

              Model    Band1     Band2     Band3     Band4     Band5     Total
                       15-25     25-50    50-100    100-350    15-150    15-350    keV
Fluence         PL   2.82e-06  4.36e-06  5.07e-06  1.13e-05  1.56e-05  2.36e-05   erg/cm2
      90%_error_low    N/A       N/A       N/A       N/A       N/A       N/A      erg/cm2
      90%_error_hi     N/A       N/A       N/A       N/A       N/A       N/A      erg/cm2
Peak flux       PL   1.35e+01  1.44e+01  1.09e+01  1.34e+01  4.39e+01  5.22e+01   ph/cm2/s
      90%_error_low     N/A       N/A       N/A       N/A       N/A       N/A     ph/cm2/s
      90%_error_hi      N/A       N/A       N/A       N/A       N/A       N/A     ph/cm2/s

Fluence        CPL   2.20e-06  4.40e-06  5.55e-06  6.21e-06  1.51e-05  1.84e-05   erg/cm2
      90%_error_low -9.69e-08 -7.64e-08 -8.80e-08 -4.12e-07 -2.00e-07 -4.60e-07   erg/cm2
      90%_error_hi   9.87e-08  7.63e-08  8.82e-08  4.51e-07  2.00e-07  4.93e-07   erg/cm2
Peak flux      CPL   1.26e+01  8.81e+00  4.24e+00  3.43e+00  2.71e+01  2.81e+01   ph/cm2/s
      90%_error_low     N/A       N/A       N/A       N/A       N/A       N/A     ph/cm2/s
      90%_error_hi      N/A       N/A       N/A       N/A       N/A       N/A     ph/cm2/s

======================================================================
Image
Pre-slew 15.0-350.0 keV image (Event data)

#   RAcent    DECcent   POSerr    Theta     Phi              Peak Cts       SNR   Name
  278.1381    26.3393   0.0014    26.0370    19.0621        25.2747729    142.207 TRIG_00130088

Foreground time interval of the image:
 -0.120   9.245 (delta_t =   9.365 [sec])
Background time interval of the image:
-136.355  -0.120 (delta_t = 136.235 [sec])
Light Curves
Note: The mask-weighted lightcurves have units of either count/det or counts/sec/det, where a det is 0.4 x 0.4 = 0.16 sq cm.
Full-time range; 1 s binning
Other quick-look light curves:
- 64 ms binning (zoomed)
- 16 ms binning (zoomed)
- 8 ms binning (zoomed)
- 2 ms binning (zoomed)
- SN=5 or 10 s binning (full-time range)
- Raw light curve
Spectra
- 64 ms binning (zoomed)
- 16 ms binning (zoomed)
- 8 ms binning (zoomed)
- 2 ms binning (zoomed)
- SN=5 or 10 s binning (full-time range)
- Raw light curve
Spectra
Notes:
- 1) The fitting includes the systematic errors.
- 2) When the burst includes telescope slew time periods, the fitting uses an average response file made from multiple 5-s response files through out the slew time plus single time preiod for the non-slew times, and weighted by the total counts in the corresponding time period using addrmf. An average response file is needed becuase a spectral fit using the pre-slew DRM will introduce some errors in both a spectral shape and a normalization if the PHA file contains a lot of the slew/post-slew time interval.
- 3) For fits to more complicated models (e.g. a power-law over a cutoff power-law), the BAT team has decided to require a chi-square improvement of more than 6 for each extra dof.
Time averaged spectrum fit using the average DRM
Power-law model

Time interval is from   -0.120 sec. to   12.676 sec.

Spectral model in power-law:
------------------------------------------------------------
Parameters  : value       lower 90%   higher 90%
Photon index: -1.78273     (       )
Norm@50keV  : 0.132077    (     )
------------------------------------------------------------
#Fit statistic : Chi-Squared =         212.75 using 59 PHA bins.
# Reduced chi-squared =         3.7325 for     57 degrees of freedom
# Null hypothesis probability =   8.108927e-20

Photon flux (15-150 keV)    in 12.8 sec: 18.0805 (    ) ph/cm2/s
Energy fluence (15-150 keV)             : 1.55764e-05 ( 0  0 ) ergs/cm2
Cutoff power-law model

Time interval is from   -0.120 sec. to   12.676 sec.
Spectral model in the cutoff power-law:
------------------------------------------------------------
Parameters  : value       lower 90%   higher 90%
Photon index: -1.02618     ( -0.0996255   0.101512 )
Epeak [keV] : 80.3998      ( -2.91784 3.47757 )
Norm@50keV  : 0.266806    ( -0.0229097   0.0254571 )
------------------------------------------------------------
#Fit statistic : Chi-Squared =          25.90 using 59 PHA bins.
# Reduced chi-squared =         0.4624 for     56 degrees of freedom
# Null hypothesis probability =   9.998081e-01

Photon flux (15-150 keV)    in 12.8 sec: 16.6595 ( -0.336  0.339 ) ph/cm2/s
Energy fluence (15-150 keV)             : 1.51314e-05 ( -1.99667e-07  1.9959e-07 ) ergs/cm2
1-s peak spectrum fit
Power-law model

Time interval is from    0.544 sec. to    1.544 sec.

Spectral model in power-law:
------------------------------------------------------------
Parameters  : value       lower 90%   higher 90%
Photon index: -1.39984     (       )
Norm@50keV  : 0.360102    (     )
------------------------------------------------------------
#Fit statistic : Chi-Squared =         165.62 using 59 PHA bins.
# Reduced chi-squared =         2.9057 for     57 degrees of freedom
# Null hypothesis probability =   1.569646e-12

Photon flux (15-150 keV)    in 1 sec: 43.8529 (    ) ph/cm2/s
Energy fluence (15-150 keV)             : 3.48009e-06 ( 0  0 ) ergs/cm2
Cutoff power-law model

Time interval is from    0.544 sec. to    1.544 sec.
Spectral model in the cutoff power-law:
------------------------------------------------------------
Parameters  : value       lower 90%   higher 90%
Photon index: -0.602717     ( -0.124694   0.127884 )
Epeak [keV] : 106.319      ( -6.78648 8.83628 )
Norm@50keV  : 0.776242    ( -0.0854009   0.0982065 )
------------------------------------------------------------
#Fit statistic : Chi-Squared =          31.12 using 59 PHA bins.
# Reduced chi-squared =         0.5557 for     56 degrees of freedom
# Null hypothesis probability =   9.971626e-01

Photon flux (15-150 keV)    in 1 sec: 27.1367 (    ) ph/cm2/s
Energy fluence (15-150 keV)             : 3.40479e-06 ( -5.66007e-08  5.65957e-08 ) ergs/cm2
Time-resolved spectra

Distribution
T90 vs. Hardness ratio plot

T90                                   = 8.836 sec.
Hardness ratio (energy fluence ratio) = 1.26197306569
S(15-50 keV) vs. S(50-150 keV) plot
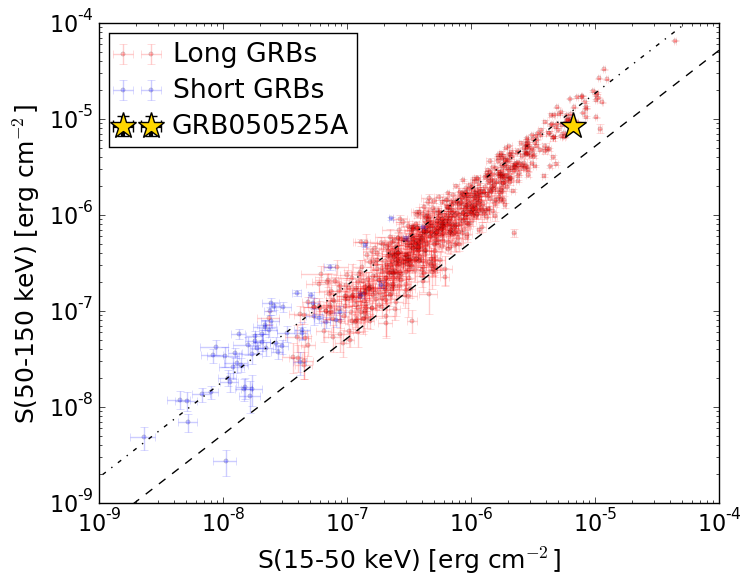
S(15-50 keV)  = 6.597985e-06
S(50-150 keV) = 8.533358e-06
The dash-dotted line and the dashed line traces the fluences calculated from the Band function with Epeak = 15 and 150 keV, respectively. Both lines assume a canonical values of alpha = -1 and beta = -2.5.
Mask shadow pattern

IMX = 4.617440444879775E-01, IMY = -1.595507843272130E-01
Spacecraft aspect plot

Bright source in the pre-burst/pre-slew/post-slew images
Pre-burst image of 15-350 keV band
Time interval of the image:
-136.355410 -0.120000

# RAcent  DECcent POSerr Theta    Phi  PeakCts   SNR AngSep     Name
#  [deg]    [deg]    ['] [deg]  [deg]                   [']
254.5945  35.3952    4.2   4.3   40.2   0.3087   2.7    7.4	Her X-1
288.7862  10.9243    2.5  43.7   28.4   1.2702   4.6    1.5	GRS 1915+105
299.5991  35.1987    0.5  39.0  -11.1   3.6847  23.8    0.5	Cyg X-1
308.1208  40.9801    3.8  43.6  -22.5   0.6055   3.1    1.7	Cyg X-3
326.0431  38.3955   70.9  57.4  -25.8  -0.1325  -0.2    7.5	Cyg X-2
274.7161  10.6811    2.6  35.0   45.5   0.9351   4.4 ------	UNKNOWN
238.2998  16.3173    2.0  24.4  119.5   0.8285   5.7 ------	UNKNOWN
302.7493  52.6102    2.6  38.4  -39.4   0.7630   4.5 ------	UNKNOWN
293.6158  61.3627    2.5  35.1  -55.3   0.8804   4.6 ------	UNKNOWN
177.3724  56.3464    2.5  50.1 -133.7   2.7702   4.6 ------	UNKNOWN
Pre-slew background subtracted image of 15-350 keV band
Time interval of the image:
-0.120000 9.244600

# RAcent  DECcent POSerr Theta    Phi  PeakCts   SNR AngSep     Name
#  [deg]    [deg]    ['] [deg]  [deg]                   [']
254.4333  35.4077    6.5   4.2   41.3   0.3069   1.7    4.1	Her X-1
288.7453  10.9751    8.9  43.6   28.4  -0.5472  -1.3    3.6	GRS 1915+105
299.7135  35.2747   12.8  39.0  -11.3   0.2108   0.9    7.5	Cyg X-1
308.0299  40.9430   26.9  43.6  -22.4  -0.1328  -0.4    3.7	Cyg X-3
326.1961  38.4433    4.5  57.5  -25.9   2.9603   2.6    7.4	Cyg X-2
274.2058   8.2890    2.4  36.8   48.5   1.5927   4.7 ------	UNKNOWN
260.2902  11.8518    2.3  27.8   69.2   1.2390   4.9 ------	UNKNOWN
278.1381  26.3393    0.1  26.0   19.1  25.2746 142.2 ------	UNKNOWN
314.9451  34.3311    2.3  51.0  -16.6   2.1117   5.0 ------	UNKNOWN
173.8636  46.0278    3.8  55.2 -145.4   3.8977   3.0 ------	UNKNOWN
279.2378  77.4252    3.1  41.0  -80.8   2.8729   3.7 ------	UNKNOWN
264.6866  78.6385    3.8  40.8  -85.8   2.4914   3.1 ------	UNKNOWN
Post-slew image of 15-350 keV band
Time interval of the image:
63.644600 302.966800

# RAcent  DECcent POSerr Theta    Phi  PeakCts   SNR AngSep     Name
#  [deg]    [deg]    ['] [deg]  [deg]                   [']
254.5164  35.4749    5.8  22.2  170.0   0.3325   2.0    8.5	Her X-1
268.1628  -1.4877    0.0  29.4   70.5   0.2810   1.1   12.5	SW J1753.5-0127
273.9890 -14.1650    3.7  40.7   56.1  -1.6015  -3.1    7.8	GX 17+2
288.8195  10.8686    2.2  18.4   14.7   0.8120   5.2    4.8	GRS 1915+105
299.5872  35.1987    0.3  20.4  -71.2   6.9792  37.3    0.2	Cyg X-1
308.0546  40.9633    1.5  28.7  -78.5   1.8790   7.8    2.6	Cyg X-3
326.1379  38.4411    4.8  41.8  -69.3   1.5982   2.4    7.3	Cyg X-2
315.4304  23.8280    3.7  33.7  -44.2   0.6634   3.1 ------	UNKNOWN
223.1184  69.1613    3.1  53.3 -151.4   2.1932   3.8 ------	UNKNOWN