Analysis Summary
Notes:
- 1) No attempt has been made to eliminate the non-significant decimal places.
- 2) This batgrbproduct analysis is done using the HEASARC data.
- 3) This batgrbproduct analysis is using the flight position for the mask-weighting calculation.
======================================================================
BAT GRB EVENT DATA PROCESSING REPORT
Process Script Ver: batgrbproduct v2.46
Process Start Time: Wed Jan 22 21:56:29 EST 2014
Host Name: batevent1
Current Working Dir: /local/data/batevent/batevent_reproc/trigger130679
======================================================================
Trigger: 00130679 Segment: 000
BAT Trigger Time: 138946004.672 [s; MET]
Trigger Stop: 138946008.768 [s; MET]
UTC: 2005-05-28T04:06:45.128040 [includes UTCF correction]
Where From?: TDRSS position message
BAT
RA: 353.529041992498 Dec: 45.9437076292292 [deg; J2000]
Catalogged Source?: NO
Point Source?: YES
GRB Indicated?: YES [ by BAT flight software ]
Image S/N Ratio: 8
Image Trigger?: NO
Rate S/N Ratio: 13.3041346956501 [ if not an image trigger ]
Image S/N Ratio: 8
Analysis Position: [ source = BAT ]
RA: 353.529041992498 Dec: 45.9437076292292 [deg; J2000]
Refined Position: [ source = BAT pre-slew burst ]
RA: 353.528902937186 Dec: 45.9583933346038 [deg; J2000]
{ 23h 34m 06.9s , +45d 57' 30.2" }
+/- 2.185302668337 [arcmin] (estimated 90% radius based on SNR)
+/- 0.760422857831697 [arcmin] (formal 1-sigma fit error)
SNR: 9.95638803477859
Angular difference between the analysis and refined position is 0.881161 arcmin
Partial Coding Fraction: 0.2734375 [ including projection effects ]
Duration
T90: 11.2480000257492 +/- 1.72823149014381
Measured from: -6.66400000452995
to: 4.58400002121925 [s; relative to TRIGTIME]
T50: 6.65999999642372 +/- 2.50901811119854
Measured from: -3.32799997925758
to: 3.33200001716614 [s; relative to TRIGTIME]
Fluence
Peak Flux (peak 1 second)
Measured from: 3.4200000166893
to: 4.4200000166893 [s; relative to TRIGTIME]
Total Fluence
Measured from: -8.11599999666214
to: 4.9839999973774 [s; relative to TRIGTIME]
Band 1 Band 2 Band 3 Band 4
15-25 25-50 50-100 100-350 keV
Total 0.262857 0.343895 0.111201 0.003653
0.036022 0.037750 0.031888 0.028884 [error]
Peak 0.032375 0.056285 0.036144 0.002430
0.010235 0.011378 0.009592 0.008389 [error]
[ fluence units of on-axis counts / fully illuminated detector ]
======================================================================
====== Table of the duration information =============================
Value tstart tstop
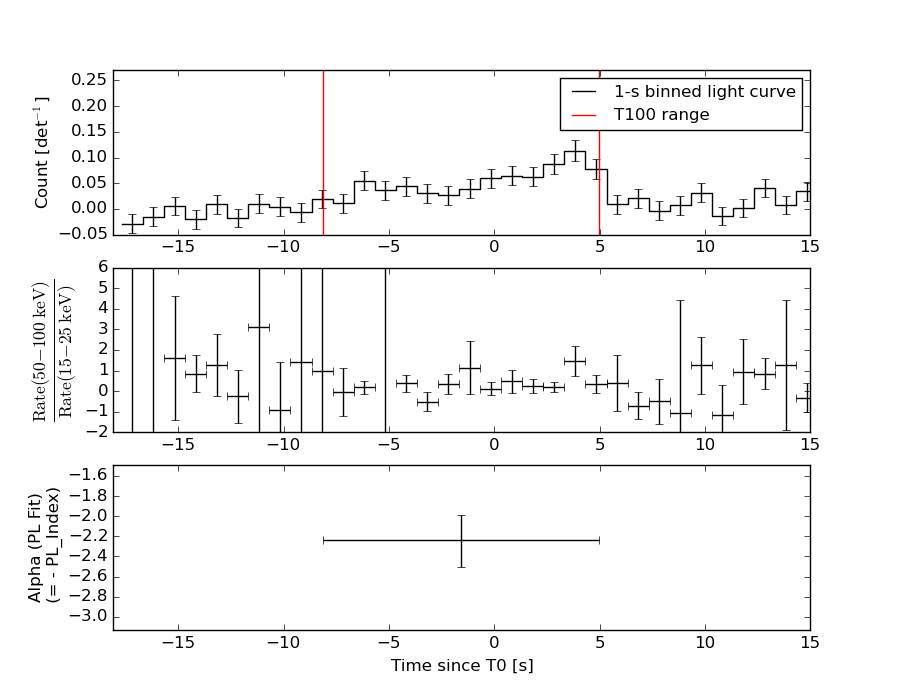
T100 13.100 -8.116 4.984
T90 11.248 -6.664 4.584
T50 6.660 -3.328 3.332
Peak 1.000 3.420 4.420
====== Spectral Analysis Summary =====================================
Model : spectral model: simple power-law (PL) and cutoff power-law (CPL)
Ph_index : photon index: E^{Ph_index}
Ph_90err : 90% error of the photon index
Epeak : Epeak in keV
Epeak_90err: 90% error of Epeak
Norm : normalization at 50 keV in both the PL model and CPL model
Nomr_90err : 90% error of the normalization
chi2 : Chi-Squared
dof : degree of freedo
=== Time-averaged spectral analysis ===
(Best model with acceptable fit: PL)
Model Ph_index Ph_90err_low Ph_90err_hi Epeak Epeak_90err_low Epeak_90err_hi Norm Nomr_90err_low Norm_90err_hi chi2 dof
PL -2.237 -0.268 0.245 - - - 3.58e-03 -6.62e-04 6.45e-04 47.730 57
CPL -0.443 -1.412 1.785 34.096 -20.980 8.054 4.18e-02 -4.18e-02 4.41e-01 42.800 56
=== 1-s peak spectral analysis ===
(Best model with acceptable fit: N/A)
Model Ph_index Ph_90err_low Ph_90err_hi Epeak Epeak_90err_low Epeak_90err_hi Norm Nomr_90err_low Norm_90err_hi chi2 dof
PL -1.522 -0.385 0.386 - - - 9.65e-03 -2.26e-03 2.25e-03 71.250 57
CPL -0.669 -1.183 2.850 77.857 -30.616 -77.857 2.63e-02 -2.63e-02 4.18e+00 70.580 56
=== Fluence/Peak Flux Summary ===
Model Band1 Band2 Band3 Band4 Band5 Total
15-25 25-50 50-100 100-350 15-150 15-350 keV
Fluence PL 1.20e-07 1.41e-07 1.20e-07 1.73e-07 4.43e-07 5.54e-07 erg/cm2
90%_error_low -2.15e-08 -1.98e-08 -2.91e-08 -6.94e-08 -6.95e-08 -1.11e-07 erg/cm2
90%_error_hi 2.21e-08 1.97e-08 3.02e-08 9.38e-08 7.10e-08 1.28e-07 erg/cm2
Peak flux PL 4.05e-01 4.03e-01 2.81e-01 3.09e-01 1.21e+00 1.40e+00 ph/cm2/s
90%_error_low -1.55e-01 -1.06e-01 -7.77e-02 -1.43e-01 -2.96e-01 -3.25e-01 ph/cm2/s
90%_error_hi 1.74e-01 1.03e-01 7.61e-02 1.98e-01 2.99e-01 3.25e-01 ph/cm2/s
Fluence CPL N/A N/A N/A N/A N/A N/A erg/cm2
90%_error_low -2.15e-08 -1.98e-08 -2.91e-08 -6.94e-08 -6.95e-08 -1.11e-07 erg/cm2
90%_error_hi 2.21e-08 1.97e-08 3.02e-08 9.38e-08 7.10e-08 1.28e-07 erg/cm2
Peak flux CPL 3.51e-01 4.39e-01 3.02e-01 1.35e-01 1.18e+00 1.23e+00 ph/cm2/s
90%_error_low -1.94e-01 -1.28e-01 -8.96e-02 -1.35e-01 -3.08e-01 -3.49e-01 ph/cm2/s
90%_error_hi 2.04e-01 1.56e-01 9.46e-02 2.32e-01 3.06e-01 3.99e-01 ph/cm2/s
======================================================================
Image
Pre-slew 15.0-350.0 keV image (Event data)
#   RAcent    DECcent   POSerr    Theta     Phi              Peak Cts       SNR   Name
  353.5289    45.9584   0.0193    50.2565  -173.8444         0.7368429      9.956 TRIG_00130679

Foreground time interval of the image:
 -8.116   4.984 (delta_t =  13.100 [sec])
Background time interval of the image:
-299.672  -8.116 (delta_t = 291.556 [sec])
Light Curves
Note: The mask-weighted lightcurves have units of either count/det or counts/sec/det, where a det is 0.4 x 0.4 = 0.16 sq cm.
Full-time range; 1 s binning
Other quick-look light curves:
- 64 ms binning (zoomed)
- 16 ms binning (zoomed)
- 8 ms binning (zoomed)
- 2 ms binning (zoomed)
- SN=5 or 10 s binning (full-time range)
- Raw light curve
Spectra
- 64 ms binning (zoomed)
- 16 ms binning (zoomed)
- 8 ms binning (zoomed)
- 2 ms binning (zoomed)
- SN=5 or 10 s binning (full-time range)
- Raw light curve
Spectra
Notes:
- 1) The fitting includes the systematic errors.
- 2) When the burst includes telescope slew time periods, the fitting uses an average response file made from multiple 5-s response files through out the slew time plus single time preiod for the non-slew times, and weighted by the total counts in the corresponding time period using addrmf. An average response file is needed becuase a spectral fit using the pre-slew DRM will introduce some errors in both a spectral shape and a normalization if the PHA file contains a lot of the slew/post-slew time interval.
- 3) For fits to more complicated models (e.g. a power-law over a cutoff power-law), the BAT team has decided to require a chi-square improvement of more than 6 for each extra dof.
Time averaged spectrum fit using the average DRM
Power-law model
Time interval is from   -8.116 sec. to    4.984 sec.

Spectral model in power-law:
------------------------------------------------------------
Parameters  : value       lower 90%   higher 90%
Photon index: -2.23705     ( -0.268361   0.245086 )
Norm@50keV  : 3.57836E-03    ( -0.000662073   0.00064465 )
------------------------------------------------------------
#Fit statistic : Chi-Squared =          47.73 using 59 PHA bins.
# Reduced chi-squared =         0.8373 for     57 degrees of freedom
# Null hypothesis probability =   8.042988e-01

Photon flux (15-150 keV)    in 13.1 sec: 0.604257 ( -0.082611  0.082659 ) ph/cm2/s
Energy fluence (15-150 keV)             : 4.43263e-07 ( -6.95305e-08  7.10186e-08 ) ergs/cm2
Cutoff power-law model
Time interval is from   -8.116 sec. to    4.984 sec.
Spectral model in the cutoff power-law:
------------------------------------------------------------
Parameters  : value       lower 90%   higher 90%
Photon index: -0.442977     ( -1.41153   1.7848 )
Epeak [keV] : 34.0964      ( -20.9797 8.05439 )
Norm@50keV  : 4.18419E-02    ( -0.0418439   0.440686 )
------------------------------------------------------------
#Fit statistic : Chi-Squared =          42.80 using 59 PHA bins.
# Reduced chi-squared =         0.7644 for     56 degrees of freedom
# Null hypothesis probability =   9.026213e-01

Photon flux (15-150 keV)    in 13.1 sec: 0.574450 ( -0.08503  0.08549 ) ph/cm2/s
Energy fluence (15-150 keV)             : 0 ( 0  0 ) ergs/cm2
1-s peak spectrum fit
Power-law model
Time interval is from    3.420 sec. to    4.420 sec.

Spectral model in power-law:
------------------------------------------------------------
Parameters  : value       lower 90%   higher 90%
Photon index: -1.52175     ( -0.38541   0.385637 )
Norm@50keV  : 9.64937E-03    ( -0.0022558   0.00225046 )
------------------------------------------------------------
#Fit statistic : Chi-Squared =          71.25 using 59 PHA bins.
# Reduced chi-squared =          1.250 for     57 degrees of freedom
# Null hypothesis probability =   9.709881e-02

Photon flux (15-150 keV)    in 1 sec: 1.21182 ( -0.296484  0.29878 ) ph/cm2/s
Energy fluence (15-150 keV)             : 9.12347e-08 ( -2.23377e-08  2.24809e-08 ) ergs/cm2
Cutoff power-law model
Time interval is from    3.420 sec. to    4.420 sec.
Spectral model in the cutoff power-law:
------------------------------------------------------------
Parameters  : value       lower 90%   higher 90%
Photon index: -0.669032     ( -1.18362   2.84982 )
Epeak [keV] : 77.8568      ( -30.5829 -77.824 )
Norm@50keV  : 2.62778E-02    ( -0.026306   4.18445 )
------------------------------------------------------------
#Fit statistic : Chi-Squared =          70.58 using 59 PHA bins.
# Reduced chi-squared =          1.260 for     56 degrees of freedom
# Null hypothesis probability =   9.093618e-02

Photon flux (15-150 keV)    in 1 sec: 1.18110 ( -0.307515  0.30579 ) ph/cm2/s
Energy fluence (15-150 keV)             : 8.69601e-08 ( -2.7446e-08  2.44668e-08 ) ergs/cm2
Time-resolved spectra
Distribution
T90 vs. Hardness ratio plot
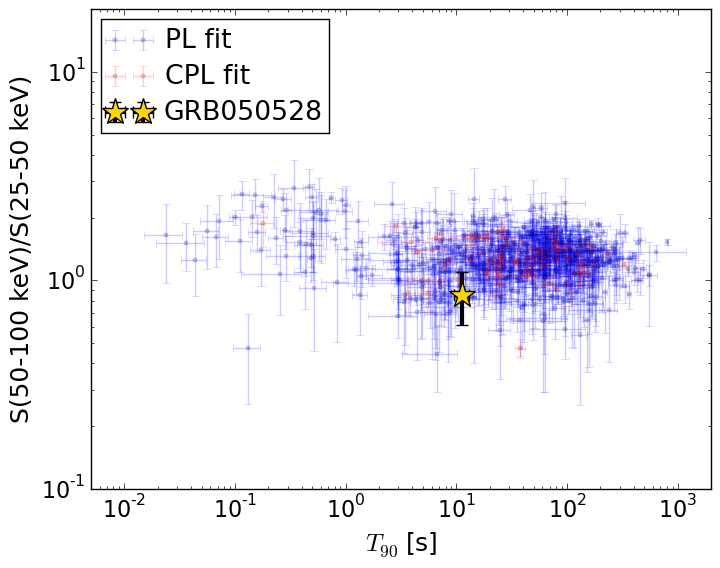
T90                                   = 11.248 sec.
Hardness ratio (energy fluence ratio) = 0.84851543943
S(15-50 keV) vs. S(50-150 keV) plot
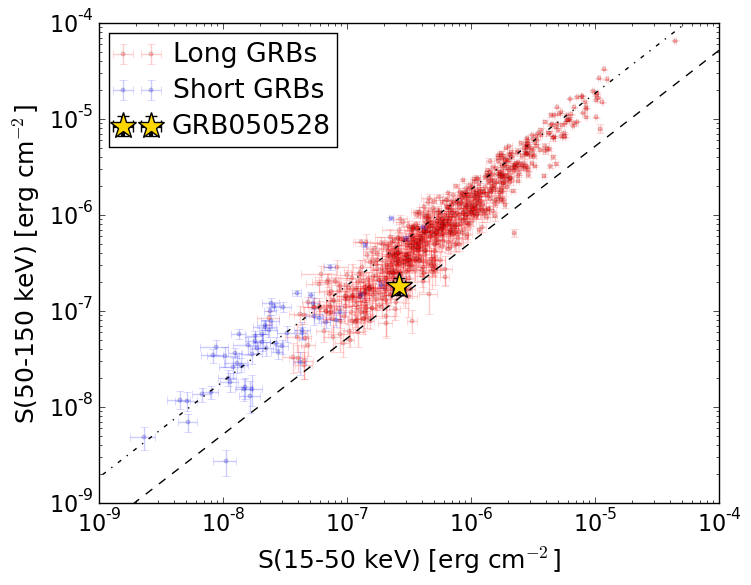
S(15-50 keV)  = 2.616468e-07
S(50-150 keV) = 1.8162059e-07
The dash-dotted line and the dashed line traces the fluences calculated from the Band function with Epeak = 15 and 150 keV, respectively. Both lines assume a canonical values of alpha = -1 and beta = -2.5.
Mask shadow pattern
IMX = -1.195712943438739E+00, IMY = 1.289594431820725E-01
Spacecraft aspect plot
Bright source in the pre-burst/pre-slew/post-slew images
Pre-burst image of 15-350 keV band
Time interval of the image:
-299.672000 -8.116000

# RAcent  DECcent POSerr Theta    Phi  PeakCts   SNR AngSep     Name
#  [deg]    [deg]    ['] [deg]  [deg]                   [']
349.5245  50.0493    2.6  55.1 -173.8   2.4988   4.5 ------	UNKNOWN
355.4470  56.6718    2.8  59.0 -166.2   4.3563   4.2 ------	UNKNOWN
Pre-slew background subtracted image of 15-350 keV band
Time interval of the image:
-8.116000 4.984000

# RAcent  DECcent POSerr Theta    Phi  PeakCts   SNR AngSep     Name
#  [deg]    [deg]    ['] [deg]  [deg]                   [']
353.5289  45.9584    1.2  50.3 -173.8   0.7369  10.0 ------	UNKNOWN
Post-slew image of 15-350 keV band
Time interval of the image:
111.428600 302.397300

# RAcent  DECcent POSerr Theta    Phi  PeakCts   SNR AngSep     Name
#  [deg]    [deg]    ['] [deg]  [deg]                   [']
308.0150  40.7808    8.8  33.2   97.3  -0.3730  -1.3   11.2	Cyg X-3
326.2971  38.4434  141.1  21.6   78.9  -0.0120  -0.1    9.4	Cyg X-2
307.3245  42.7390    2.9  32.9  101.0   1.0374   4.0 ------	UNKNOWN
 82.9093  58.3358    2.9  51.9 -138.6   2.5097   4.0 ------	UNKNOWN