Analysis Summary
Notes:
- 1) No attempt has been made to eliminate the non-significant decimal places.
- 2) This batgrbproduct analysis is done using the HEASARC data.
- 3) This batgrbproduct analysis is using the flight position for the mask-weighting calculation.
======================================================================
BAT GRB EVENT DATA PROCESSING REPORT
Process Script Ver: batgrbproduct v2.46
Process Start Time: Wed Jan 22 21:50:38 EST 2014
Host Name: batevent1
Current Working Dir: /local/data/batevent/batevent_reproc/trigger132247
======================================================================
Trigger: 00132247 Segment: 000
BAT Trigger Time: 139828282.368 [s; MET]
Trigger Stop: 139828283.392 [s; MET]
UTC: 2005-06-07T09:11:22.807560 [includes UTCF correction]
Where From?: TDRSS position message
BAT
RA: 300.166992902482 Dec: 9.13699352299647 [deg; J2000]
Catalogged Source?: NO
Point Source?: YES
GRB Indicated?: YES [ by BAT flight software ]
Image S/N Ratio: 9
Image Trigger?: NO
Rate S/N Ratio: 18.1383571472171 [ if not an image trigger ]
Image S/N Ratio: 9
Analysis Position: [ source = BAT ]
RA: 300.166992902482 Dec: 9.13699352299647 [deg; J2000]
Refined Position: [ source = BAT pre-slew burst ]
RA: 300.180869821667 Dec: 9.13111981264177 [deg; J2000]
{ 20h 00m 43.4s , +09d 07' 52.0" }
+/- 1.51118549977616 [arcmin] (estimated 90% radius based on SNR)
+/- 0.543115261093875 [arcmin] (formal 1-sigma fit error)
SNR: 16.8635935437948
Angular difference between the analysis and refined position is 0.894416 arcmin
Partial Coding Fraction: 0.8359375 [ including projection effects ]
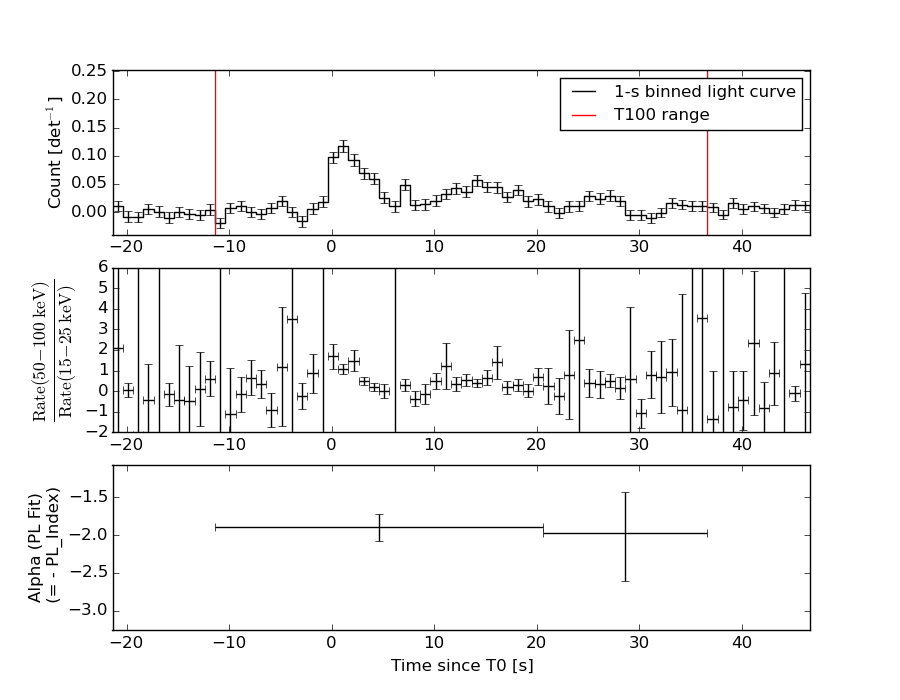
Duration
T90: 48 +/- 22.6274169979695
Measured from: -11.3680000007153
to: 36.6319999992847 [s; relative to TRIGTIME]
T50: 16 +/- 16
Measured from: -11.3680000007153
to: 4.63199999928474 [s; relative to TRIGTIME]
Fluence
Peak Flux (peak 1 second)
Measured from: 12.1319999992847
to: 13.1319999992847 [s; relative to TRIGTIME]
Total Fluence
Measured from: -11.3680000007153
to: 36.6319999992847 [s; relative to TRIGTIME]
Band 1 Band 2 Band 3 Band 4
15-25 25-50 50-100 100-350 keV
Total 0.387469 0.457089 0.218004 0.061574
0.035640 0.036169 0.030520 0.024851 [error]
Peak 0.018113 0.005771 0.005803 0.000973
0.005439 0.005379 0.004450 0.003626 [error]
[ fluence units of on-axis counts / fully illuminated detector ]
======================================================================
====== Table of the duration information =============================
Value tstart tstop
T100 48.000 -11.368 36.632
T90 48.000 -11.368 36.632
T50 16.000 -11.368 4.632
Peak 1.000 12.132 13.132
====== Spectral Analysis Summary =====================================
Model : spectral model: simple power-law (PL) and cutoff power-law (CPL)
Ph_index : photon index: E^{Ph_index}
Ph_90err : 90% error of the photon index
Epeak : Epeak in keV
Epeak_90err: 90% error of Epeak
Norm : normalization at 50 keV in both the PL model and CPL model
Nomr_90err : 90% error of the normalization
chi2 : Chi-Squared
dof : degree of freedo
=== Time-averaged spectral analysis ===
(Best model with acceptable fit: PL)
Model Ph_index Ph_90err_low Ph_90err_hi Epeak Epeak_90err_low Epeak_90err_hi Norm Nomr_90err_low Norm_90err_hi chi2 dof
PL -1.916 -0.181 0.174 - - - 1.38e-03 -1.59e-04 1.55e-04 66.170 57
CPL -1.797 -0.475 0.836 73.427 -73.349 -73.427 1.62e-03 -9.19e-04 3.20e-03 66.090 56
=== 1-s peak spectral analysis ===
(Best model with acceptable fit: N/A)
Model Ph_index Ph_90err_low Ph_90err_hi Epeak Epeak_90err_low Epeak_90err_hi Norm Nomr_90err_low Norm_90err_hi chi2 dof
PL -2.110 -1.281 0.885 - - - 1.67e-03 -1.67e-03 1.08e-03 55.990 57
CPL -1.596 N/A N/A 31.519 N/A N/A 3.40e-03 N/A N/A 55.950 56
=== Fluence/Peak Flux Summary ===
Model Band1 Band2 Band3 Band4 Band5 Total
15-25 25-50 50-100 100-350 15-150 15-350 keV
Fluence PL 1.26e-07 1.79e-07 1.90e-07 3.72e-07 6.11e-07 8.67e-07 erg/cm2
90%_error_low -1.74e-08 -1.68e-08 -2.95e-08 -1.05e-07 -6.77e-08 -1.38e-07 erg/cm2
90%_error_hi 1.79e-08 1.68e-08 2.98e-08 1.30e-07 6.87e-08 1.57e-07 erg/cm2
Peak flux PL 1.24e-01 8.71e-02 4.04e-02 2.62e-02 2.64e-01 2.78e-01 ph/cm2/s
90%_error_low -7.48e-02 -4.56e-02 -3.16e-02 -2.62e-02 -1.27e-01 -1.35e-01 ph/cm2/s
90%_error_hi 8.10e-02 4.28e-02 3.65e-02 6.84e-02 1.27e-01 1.37e-01 ph/cm2/s
Fluence CPL 1.24e-07 1.82e-07 1.89e-07 2.96e-07 6.03e-07 7.92e-07 erg/cm2
90%_error_low -1.95e-08 -1.91e-08 -3.12e-08 -2.16e-07 -8.25e-08 -2.37e-07 erg/cm2
90%_error_hi 1.93e-08 2.40e-08 3.04e-08 1.00e-07 7.48e-08 1.24e-07 erg/cm2
Peak flux CPL 1.20e-01 9.31e-02 3.97e-02 1.25e-02 2.61e-01 2.65e-01 ph/cm2/s
90%_error_low -1.20e-01 N/A -3.97e-02 -1.25e-02 N/A N/A ph/cm2/s
90%_error_hi 8.11e-02 N/A 3.92e-02 4.39e-02 N/A N/A ph/cm2/s
======================================================================
Image
Pre-slew 15.0-350.0 keV image (Event data)
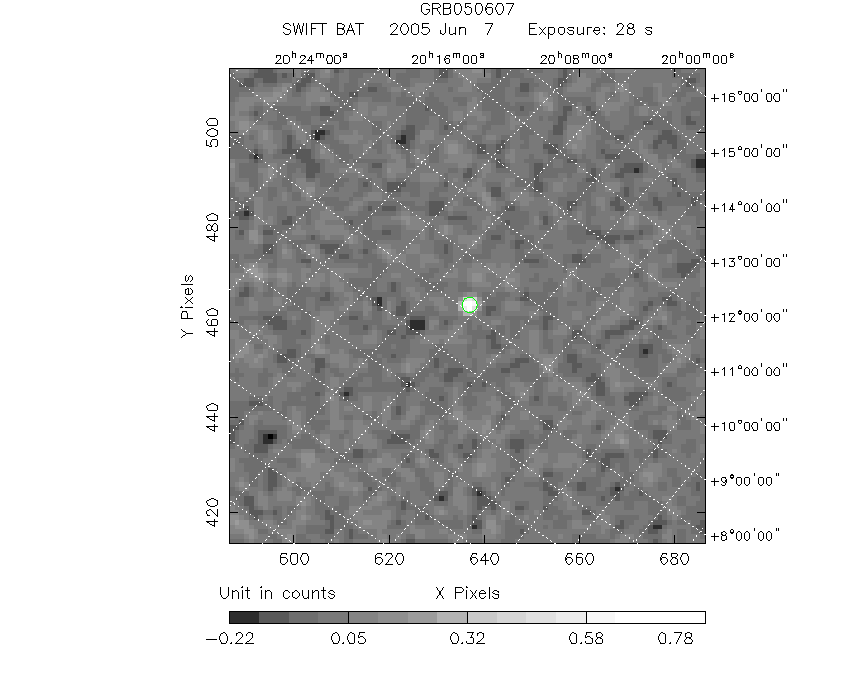
#   RAcent    DECcent   POSerr    Theta     Phi              Peak Cts       SNR   Name
  300.1809     9.1311   0.0114    27.0509     3.0420         0.9011650     16.864 TRIG_00132247

Foreground time interval of the image:
-11.368  16.533 (delta_t =  27.901 [sec])
Background time interval of the image:
-101.867 -11.368 (delta_t =  90.499 [sec])
Light Curves
Note: The mask-weighted lightcurves have units of either count/det or counts/sec/det, where a det is 0.4 x 0.4 = 0.16 sq cm.
Full-time range; 1 s binning
Other quick-look light curves:
- 64 ms binning (zoomed)
- 16 ms binning (zoomed)
- 8 ms binning (zoomed)
- 2 ms binning (zoomed)
- SN=5 or 10 s binning (full-time range)
- Raw light curve
Spectra
- 64 ms binning (zoomed)
- 16 ms binning (zoomed)
- 8 ms binning (zoomed)
- 2 ms binning (zoomed)
- SN=5 or 10 s binning (full-time range)
- Raw light curve
Spectra
Notes:
- 1) The fitting includes the systematic errors.
- 2) When the burst includes telescope slew time periods, the fitting uses an average response file made from multiple 5-s response files through out the slew time plus single time preiod for the non-slew times, and weighted by the total counts in the corresponding time period using addrmf. An average response file is needed becuase a spectral fit using the pre-slew DRM will introduce some errors in both a spectral shape and a normalization if the PHA file contains a lot of the slew/post-slew time interval.
- 3) For fits to more complicated models (e.g. a power-law over a cutoff power-law), the BAT team has decided to require a chi-square improvement of more than 6 for each extra dof.
Time averaged spectrum fit using the average DRM
Power-law model
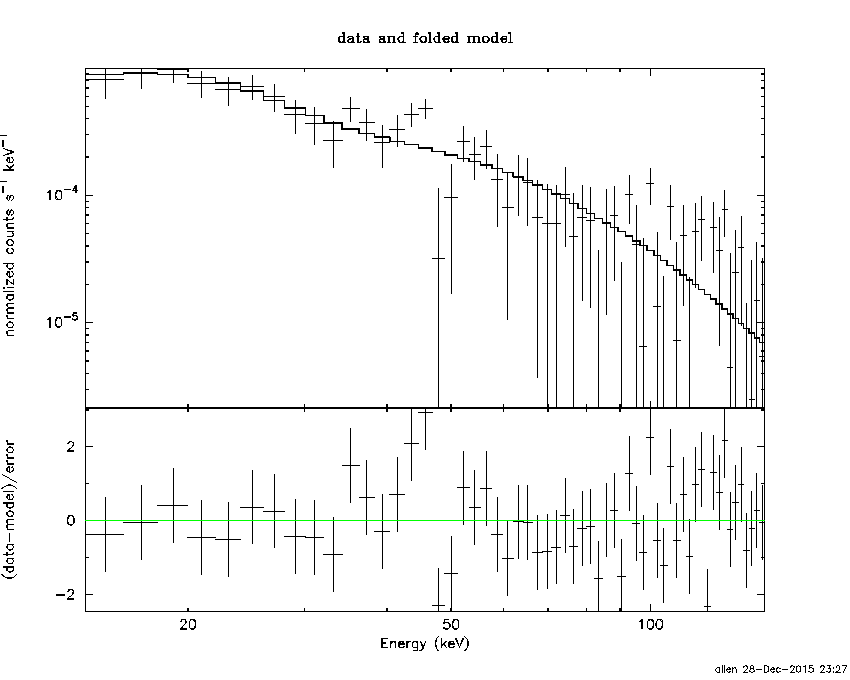
Time interval is from  -11.368 sec. to   36.632 sec.

Spectral model in power-law:
------------------------------------------------------------
Parameters  : value       lower 90%   higher 90%
Photon index: -1.91624     ( -0.181448   0.174385 )
Norm@50keV  : 1.38378E-03    ( -0.000158554   0.000155186 )
------------------------------------------------------------
#Fit statistic : Chi-Squared =          66.17 using 59 PHA bins.
# Reduced chi-squared =          1.161 for     57 degrees of freedom
# Null hypothesis probability =   1.898920e-01

Photon flux (15-150 keV)    in 48 sec: 0.199982 ( -0.018969  0.01898 ) ph/cm2/s
Energy fluence (15-150 keV)             : 6.10872e-07 ( -6.76954e-08  6.87245e-08 ) ergs/cm2
Cutoff power-law model
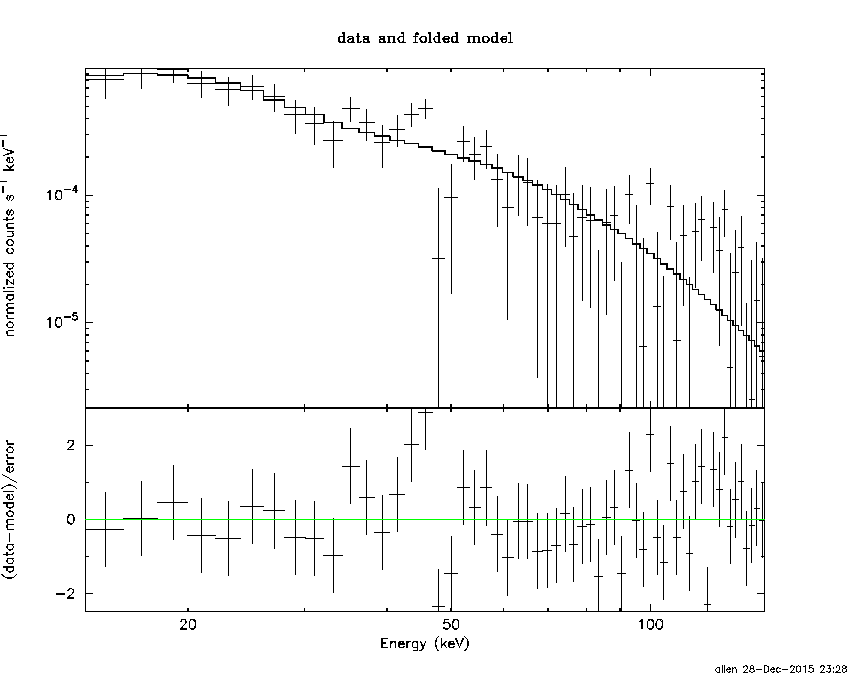
Time interval is from  -11.368 sec. to   36.632 sec.
Spectral model in the cutoff power-law:
------------------------------------------------------------
Parameters  : value       lower 90%   higher 90%
Photon index: -1.797     ( -0.474977   0.836444 )
Epeak [keV] : 73.4273      ( -73.5095 -73.588 )
Norm@50keV  : 1.61758E-03    ( -0.000917904   0.00320144 )
------------------------------------------------------------
#Fit statistic : Chi-Squared =          66.09 using 59 PHA bins.
# Reduced chi-squared =          1.180 for     56 degrees of freedom
# Null hypothesis probability =   1.675848e-01

Photon flux (15-150 keV)    in 48 sec: 0.199027 ( -0.019882  0.009828 ) ph/cm2/s
Energy fluence (15-150 keV)             : 6.0313e-07 ( -8.24851e-08  7.47792e-08 ) ergs/cm2
1-s peak spectrum fit
Power-law model
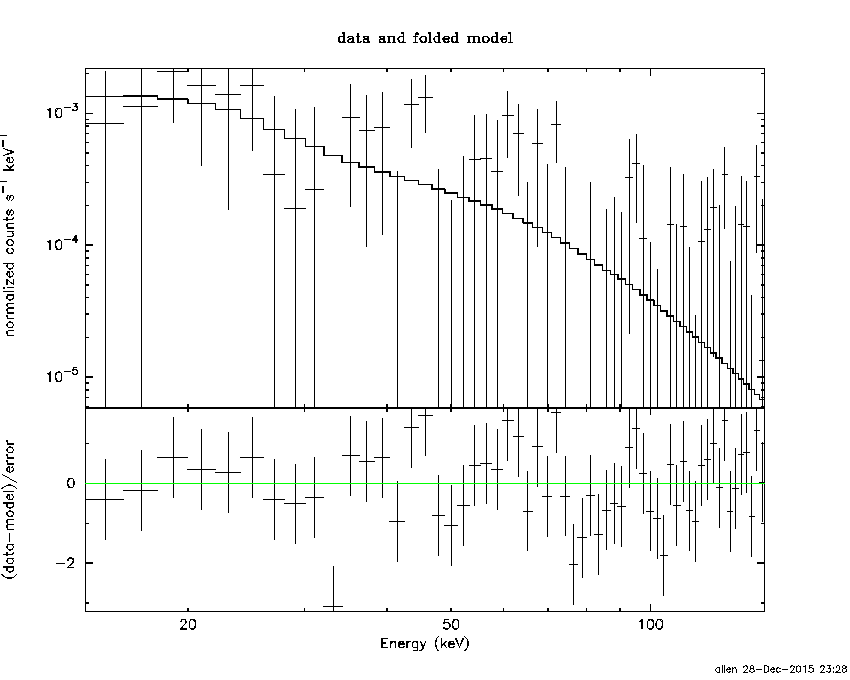
Time interval is from   12.132 sec. to   13.132 sec.

Spectral model in power-law:
------------------------------------------------------------
Parameters  : value       lower 90%   higher 90%
Photon index: -2.11048     ( -1.28118   0.885201 )
Norm@50keV  : 1.66970E-03    ( -0.0016697   0.00107546 )
------------------------------------------------------------
#Fit statistic : Chi-Squared =          55.99 using 59 PHA bins.
# Reduced chi-squared =         0.9823 for     57 degrees of freedom
# Null hypothesis probability =   5.128489e-01

Photon flux (15-150 keV)    in 1 sec: 0.264076 ( -0.127097  0.127117 ) ph/cm2/s
Energy fluence (15-150 keV)             : 1.55321e-08 ( -8.86296e-09  9.87938e-09 ) ergs/cm2
Cutoff power-law model

Time interval is from   12.132 sec. to   13.132 sec.
Spectral model in the cutoff power-law:
------------------------------------------------------------
Parameters  : value       lower 90%   higher 90%
Photon index: -1.59608     (       )
Epeak [keV] : 31.5193      (   )
Norm@50keV  : 3.39505E-03    (     )
------------------------------------------------------------
#Fit statistic : Chi-Squared =          55.95 using 59 PHA bins.
# Reduced chi-squared =         0.9990 for     56 degrees of freedom
# Null hypothesis probability =   4.769273e-01

Photon flux (15-150 keV)    in 1 sec: 0.261128 (    ) ph/cm2/s
Energy fluence (15-150 keV)             : 1.48177e-08 ( 0  0 ) ergs/cm2
Time-resolved spectra
Distribution
T90 vs. Hardness ratio plot
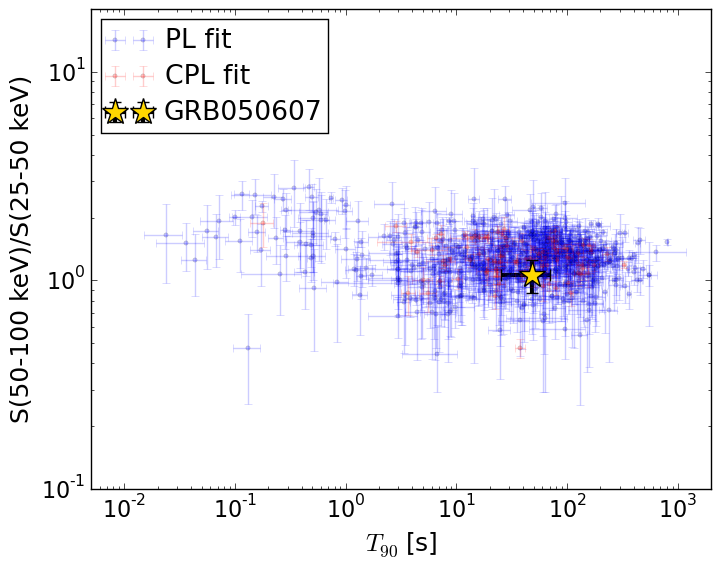
T90                                   = 48.0 sec.
Hardness ratio (energy fluence ratio) = 1.05981496303
S(15-50 keV) vs. S(50-150 keV) plot
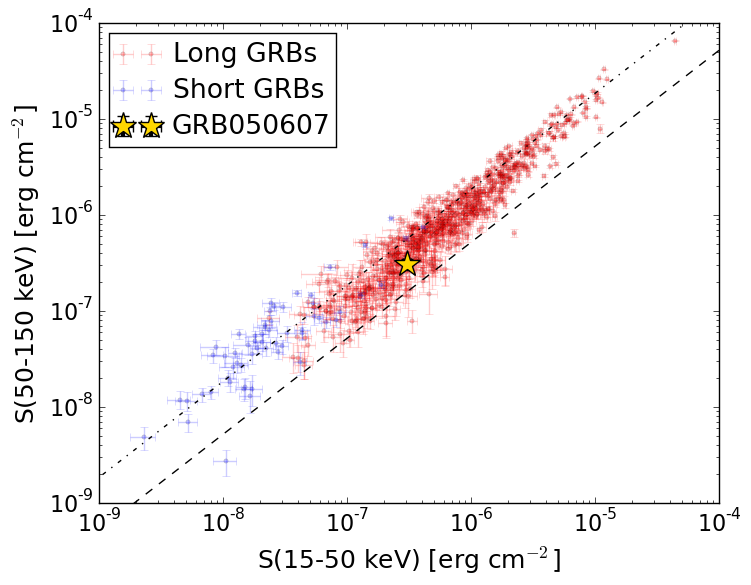
S(15-50 keV)  = 3.047126e-07
S(50-150 keV) = 3.061679e-07
The dash-dotted line and the dashed line traces the fluences calculated from the Band function with Epeak = 15 and 150 keV, respectively. Both lines assume a canonical values of alpha = -1 and beta = -2.5.
Mask shadow pattern
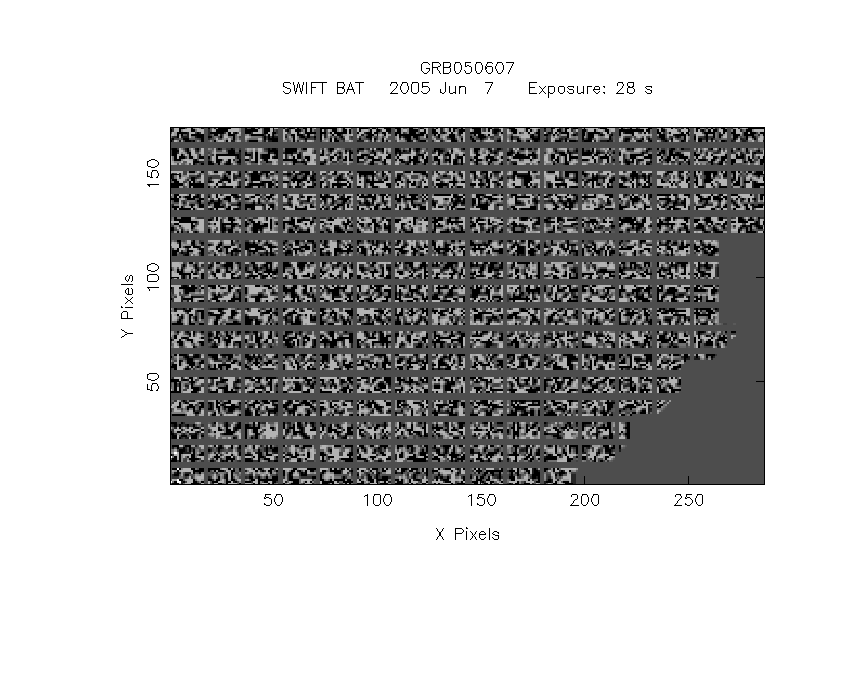
IMX = 5.099258376762459E-01, IMY = -2.709861638310307E-02
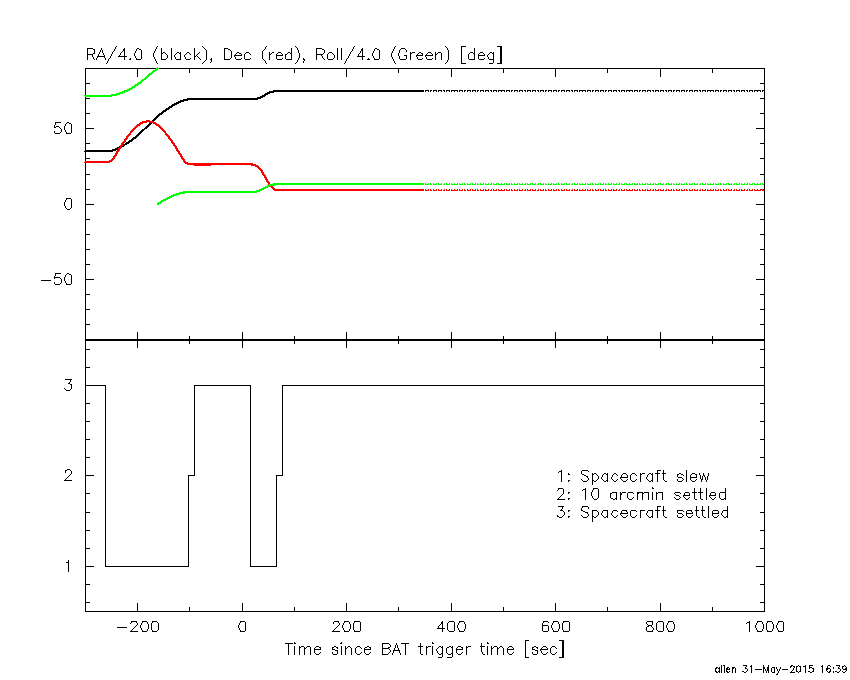
Spacecraft aspect plot
Bright source in the pre-burst/pre-slew/post-slew images
Pre-burst image of 15-350 keV band
Time interval of the image:
-101.867410 -11.368000

# RAcent  DECcent POSerr Theta    Phi  PeakCts   SNR AngSep     Name
#  [deg]    [deg]    ['] [deg]  [deg]                   [']
254.3745  35.3822    4.7  22.2  177.4   0.2167   2.4    4.7	Her X-1
268.1795  -1.5187   14.1  29.4   78.2   0.1279   0.8   12.0	SW J1753.5-0127
273.8709 -14.1304   36.7  40.7   64.0  -0.1089  -0.3    9.7	GX 17+2
288.6952  10.8412    3.4  18.4   22.9   0.3043   3.3    8.7	GRS 1915+105
299.5895  35.1941    0.4  20.4  -63.3   3.0103  30.7    0.5	Cyg X-1
308.0900  40.9411    2.1  28.7  -70.6   0.6806   5.6    1.1	Cyg X-3
326.2431  38.4584    5.6  41.9  -61.6  -0.5794  -2.1    8.9	Cyg X-2
298.0005   6.6955    1.8  27.3   10.2   0.6183   6.3 ------	UNKNOWN
232.5064  37.2358    2.1  39.9  175.1   0.6850   5.5 ------	UNKNOWN
335.9641  21.0621    2.3  52.8  -39.7   2.1708   5.0 ------	UNKNOWN
Pre-slew background subtracted image of 15-350 keV band
Time interval of the image:
-11.368000 16.532600

# RAcent  DECcent POSerr Theta    Phi  PeakCts   SNR AngSep     Name
#  [deg]    [deg]    ['] [deg]  [deg]                   [']
254.2555  35.3275    9.1  22.3  177.2  -0.0638  -1.3    9.9	Her X-1
268.4070  -1.5447    6.5  29.4   77.7  -0.1573  -1.8    6.0	SW J1753.5-0127
274.0983 -13.9375   15.5  40.4   63.7   0.1548   0.7    8.0	GX 17+2
288.5981  10.9071    5.1  18.3   23.0  -0.1139  -2.2   12.0	GRS 1915+105
299.7356  35.1206    4.9  20.5  -63.0   0.1302   2.3    8.6	Cyg X-1
307.9088  40.9060    5.8  28.6  -70.6  -0.1465  -2.0    9.5	Cyg X-3
326.1398  38.1467    7.6  41.8  -61.1   0.2249   1.5   10.6	Cyg X-2
300.1802   9.1309    0.7  27.1    3.0   0.9000  16.8 ------	UNKNOWN
209.1542  40.1198    2.5  57.9 -179.8   1.4591   4.6 ------	UNKNOWN
Post-slew image of 15-350 keV band
Time interval of the image:
66.132590 302.714300

# RAcent  DECcent POSerr Theta    Phi  PeakCts   SNR AngSep     Name
#  [deg]    [deg]    ['] [deg]  [deg]                   [']
254.4103  35.2776    5.0  49.2  166.3   1.0990   2.3    4.5	Her X-1
268.3893  -1.6074   21.9  33.4  109.8  -0.1729  -0.5    9.4	SW J1753.5-0127
274.0025 -13.9993    3.5  34.8   85.6   1.2454   3.3    2.2	GX 17+2
285.0072 -24.8838    6.4  37.1   60.1  -0.7245  -1.8    2.7	HT1900.1-2455
288.8742  11.0267    3.9  11.3  137.7   0.4316   2.9    6.6	GRS 1915+105
299.5915  35.2045    0.2  26.1 -144.1   8.1105  49.1    0.2	Cyg X-1
308.1168  40.9738    1.4  32.6 -131.9   1.7669   8.5    1.3	Cyg X-3
326.1576  38.4492   15.6  37.5 -108.7   0.3040   0.7    7.7	Cyg X-2