Analysis Summary
Notes:
- 1) No attempt has been made to eliminate the non-significant decimal places.
- 2) This batgrbproduct analysis is done using the HEASARC data.
- 3) This batgrbproduct analysis is using the flight position for the mask-weighting calculation.
======================================================================
                  BAT GRB EVENT DATA PROCESSING REPORT
    Process Script Ver: batgrbproduct v2.46
    Process Start Time: Wed Jan 22 21:49:13 EST 2014
             Host Name: batevent1
   Current Working Dir: /local/data/batevent/batevent_reproc/trigger143708
======================================================================

  Trigger: 00143708      Segment: 000

  BAT Trigger Time: 141910979.072   [s; MET]
      Trigger Stop: 141910980.096   [s; MET]
               UTC: 2005-07-01T11:42:59.472220    [includes UTCF correction]
       Where From?: TDRSS position message

  BAT
    RA: 227.286665301381   Dec: -59.4186472467233  [deg; J2000]

     Catalogged Source?: YES
     Point Source?:      YES
     GRB Indicated?:     NO    [ by BAT flight software ]
     Image S/N Ratio:    14.22
     Image Trigger?:     NO
     Rate S/N Ratio:     26.3628526529281  [ if not an image trigger ]
     Image S/N Ratio:    14.22

  Analysis Position:   [ source = BAT ]
    RA: 227.286665301381   Dec: -59.4186472467233  [deg; J2000]

  Refined Position:   [ source = BAT pre-slew burst ]
    RA: 227.244707200737   Dec: -59.4002520490514  [deg; J2000]
        { 15h 08m 58.7s , -59d 24' 00.9" }
         +/- 2.12745724446889 [arcmin] (estimated 90% radius based on SNR)
         +/- 1.05145821860101 [arcmin] (formal 1-sigma fit error)
    SNR: 10.345363389834

  Angular difference between the analysis and refined position is 1.691011 arcmin

  Partial Coding Fraction: 0.6796875    [ including projection effects ]

  Duration
     T90: 21.6960000097752 +/- 9.94378159478707
        Measured from: -3.64800000190735
                   to: 18.0480000078678     [s; relative to TRIGTIME]
     T50: 7.74400001764297 +/- 0.641760070223944
        Measured from: -0.0119999945163727
                   to: 7.7320000231266     [s; relative to TRIGTIME]


  Fluence
     Peak Flux  (peak 1 second)
        Measured from: 7.36399999260902
                   to: 8.36399999260902     [s; relative to TRIGTIME]
     Total Fluence
        Measured from: -4.73199999332428
                   to: 28.4079999923706     [s; relative to TRIGTIME]

             Band 1     Band 2     Band 3     Band 4
              15-25      25-50     50-100    100-350     keV
 Total     0.701489   0.925556   0.564948   0.165227
           0.031706   0.032800   0.028640   0.024377 [error]
 Peak      0.090507   0.124604   0.097765   0.039742
           0.006585   0.007245   0.006473   0.005329 [error]

     [ fluence units of on-axis counts / fully illuminated detector ]

======================================================================


====== Table of the duration information =============================

        Value   tstart    tstop
T100   33.140   -4.732   28.408
T90    21.696   -3.648   18.048
T50     7.744   -0.012    7.732
Peak    1.000    7.364    8.364


====== Spectral Analysis Summary =====================================

Model      : spectral model: simple power-law (PL) and cutoff power-law (CPL)
Ph_index   : photon index: E^{Ph_index}
Ph_90err   : 90% error of the photon index
Epeak      : Epeak in keV
Epeak_90err: 90% error of Epeak
Norm       : normalization at 50 keV in both the PL model and CPL model
Nomr_90err : 90% error of the normalization
chi2       : Chi-Squared
dof        : degree of freedo

=== Time-averaged spectral analysis ===
(Best model with acceptable fit: PL)

Model Ph_index Ph_90err_low Ph_90err_hi  Epeak  Epeak_90err_low  Epeak_90err_hi  Norm       Nomr_90err_low    Norm_90err_hi    chi2    dof
PL      -1.684    -0.085      0.084       -           -               -         4.43e-03     -2.07e-04          2.06e-04      61.470   57
CPL     -1.573    -0.186      0.333      186.154      N/A           N/A         5.06e-03        N/A               N/A         61.110   56


=== 1-s peak spectral analysis ===
(Best model with acceptable fit: PL)

Model Ph_index Ph_90err_low Ph_90err_hi  Epeak  Epeak_90err_low  Epeak_90err_hi  Norm       Nomr_90err_low    Norm_90err_hi    chi2    dof
PL      -1.339     -0.116     0.117       -           -               -         2.28e-02     -1.43e-03          1.43e-03      56.930   57
CPL     -1.338     -0.115     0.203     9999.270    -9999.270      -9999.270      2.29e-02     -1.43e-03          5.02e-03      56.980   56


=== Fluence/Peak Flux Summary ===

              Model    Band1     Band2     Band3     Band4     Band5     Total
                       15-25     25-50    50-100    100-350    15-150    15-350    keV
Fluence         PL   2.23e-07  3.66e-07  4.56e-07  1.13e-06  1.36e-06  2.17e-06   erg/cm2
      90%_error_low -1.71e-08 -1.68e-08 -2.89e-08 -1.47e-07 -6.71e-08 -1.71e-07   erg/cm2
      90%_error_hi   1.75e-08  1.67e-08  2.89e-08  1.62e-07  6.76e-08  1.83e-07   erg/cm2
Peak flux       PL   8.04e-01  8.90e-01  7.04e-01  9.19e-01  2.74e+00  3.32e+00   ph/cm2/s
      90%_error_low -9.42e-02 -6.27e-02 -5.53e-02 -1.47e-01 -1.74e-01 -2.15e-01   ph/cm2/s
      90%_error_hi   9.75e-02  6.21e-02  5.49e-02  1.65e-01  1.74e-01  2.17e-01   ph/cm2/s

Fluence        CPL   2.19e-07  3.70e-07  4.58e-07  9.35e-07  1.35e-06  1.98e-06   erg/cm2
      90%_error_low -2.05e-08 -1.95e-08 -2.96e-08 -3.69e-07 -7.85e-08 -3.77e-07   erg/cm2
      90%_error_hi   1.78e-08  2.01e-08  2.99e-08  2.39e-07  7.72e-08  2.52e-07   erg/cm2
Peak flux      CPL   8.04e-01  8.91e-01  7.04e-01  9.15e-01  2.74e+00  3.33e+00   ph/cm2/s
      90%_error_low -9.44e-02 -6.29e-02     N/A       N/A   -1.74e-01 -2.74e-01   ph/cm2/s
      90%_error_hi   9.75e-02  6.20e-02     N/A       N/A    1.74e-01  1.81e-01   ph/cm2/s

======================================================================
Image
Pre-slew 15.0-350.0 keV image (Event data)
#   RAcent    DECcent   POSerr    Theta     Phi              Peak Cts       SNR   Name
  227.2447   -59.4003   0.0186    19.4777    82.1230         1.5764245     10.345 TRIG_00143708

Foreground time interval of the image:
 -4.732  28.408 (delta_t =  33.140 [sec])
Background time interval of the image:
-10.072  -4.732 (delta_t =   5.340 [sec])
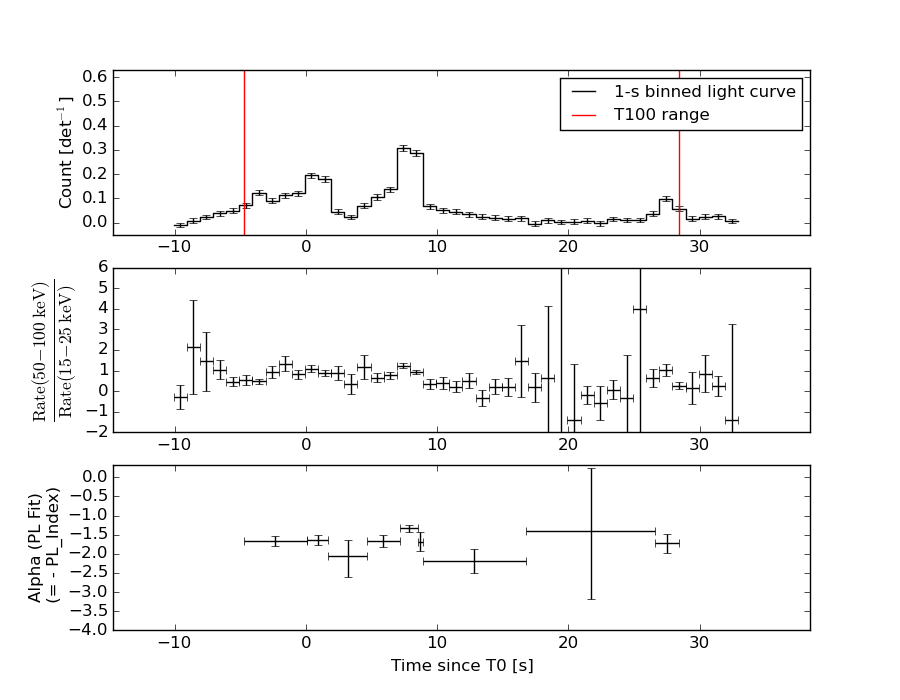
Light Curves
Note: The mask-weighted lightcurves have units of either count/det or counts/sec/det, where a det is 0.4 x 0.4 = 0.16 sq cm.
Full-time range; 1 s binning
Other quick-look light curves:
- 64 ms binning (zoomed)
- 16 ms binning (zoomed)
- 8 ms binning (zoomed)
- 2 ms binning (zoomed)
- SN=5 or 10 s binning (full-time range)
- Raw light curve
Spectra
- 64 ms binning (zoomed)
- 16 ms binning (zoomed)
- 8 ms binning (zoomed)
- 2 ms binning (zoomed)
- SN=5 or 10 s binning (full-time range)
- Raw light curve
Spectra
Notes:
- 1) The fitting includes the systematic errors.
- 2) When the burst includes telescope slew time periods, the fitting uses an average response file made from multiple 5-s response files through out the slew time plus single time preiod for the non-slew times, and weighted by the total counts in the corresponding time period using addrmf. An average response file is needed becuase a spectral fit using the pre-slew DRM will introduce some errors in both a spectral shape and a normalization if the PHA file contains a lot of the slew/post-slew time interval.
- 3) For fits to more complicated models (e.g. a power-law over a cutoff power-law), the BAT team has decided to require a chi-square improvement of more than 6 for each extra dof.
Time averaged spectrum fit using the average DRM
Power-law model
Time interval is from   -4.732 sec. to   28.408 sec.

Spectral model in power-law:
------------------------------------------------------------
Parameters  : value       lower 90%   higher 90%
Photon index: -1.68442     ( -0.0848213   0.0840815 )
Norm@50keV  : 4.43188E-03    ( -0.000207115   0.000206145 )
------------------------------------------------------------
#Fit statistic : Chi-Squared =          61.47 using 59 PHA bins.
# Reduced chi-squared =          1.079 for     57 degrees of freedom
# Null hypothesis probability =   3.189229e-01

Photon flux (15-150 keV)    in 33.14 sec: 0.585460 ( -0.02689  0.02694 ) ph/cm2/s
Energy fluence (15-150 keV)             : 1.3618e-06 ( -6.71486e-08  6.75642e-08 ) ergs/cm2
Cutoff power-law model
Time interval is from   -4.732 sec. to   28.408 sec.
Spectral model in the cutoff power-law:
------------------------------------------------------------
Parameters  : value       lower 90%   higher 90%
Photon index: -1.57299     ( -0.185941   0.333411 )
Epeak [keV] : 186.154      (   )
Norm@50keV  : 5.05511E-03    (     )
------------------------------------------------------------
#Fit statistic : Chi-Squared =          61.11 using 59 PHA bins.
# Reduced chi-squared =          1.091 for     56 degrees of freedom
# Null hypothesis probability =   2.974469e-01

Photon flux (15-150 keV)    in 33.14 sec: 0.581368 ( -0.02916  0.029134 ) ph/cm2/s
Energy fluence (15-150 keV)             : 1.34736e-06 ( -7.85e-08  7.71764e-08 ) ergs/cm2
1-s peak spectrum fit
Power-law model
Time interval is from    7.364 sec. to    8.364 sec.

Spectral model in power-law:
------------------------------------------------------------
Parameters  : value       lower 90%   higher 90%
Photon index: -1.33944     ( -0.116288   0.116605 )
Norm@50keV  : 2.27875E-02    ( -0.00143074   0.0014267 )
------------------------------------------------------------
#Fit statistic : Chi-Squared =          56.93 using 59 PHA bins.
# Reduced chi-squared =         0.9988 for     57 degrees of freedom
# Null hypothesis probability =   4.776745e-01

Photon flux (15-150 keV)    in 1 sec: 2.73938 ( -0.17404  0.17437 ) ph/cm2/s
Energy fluence (15-150 keV)             : 2.23121e-07 ( -1.58875e-08  1.60068e-08 ) ergs/cm2
Cutoff power-law model

Time interval is from    7.364 sec. to    8.364 sec.
Spectral model in the cutoff power-law:
------------------------------------------------------------
Parameters  : value       lower 90%   higher 90%
Photon index: -1.33791     ( -0.115324   0.203177 )
Epeak [keV] : 9999.27      ( -9999.36 -9999.36 )
Norm@50keV  : 2.28717E-02    ( -0.00143182   0.00502221 )
------------------------------------------------------------
#Fit statistic : Chi-Squared =          56.98 using 59 PHA bins.
# Reduced chi-squared =          1.017 for     56 degrees of freedom
# Null hypothesis probability =   4.385559e-01

Photon flux (15-150 keV)    in 1 sec: 2.73892 ( -0.17414  0.17429 ) ph/cm2/s
Energy fluence (15-150 keV)             : 2.24642e-07 ( -1.7523e-08  1.43922e-08 ) ergs/cm2
Time-resolved spectra
Distribution
T90 vs. Hardness ratio plot
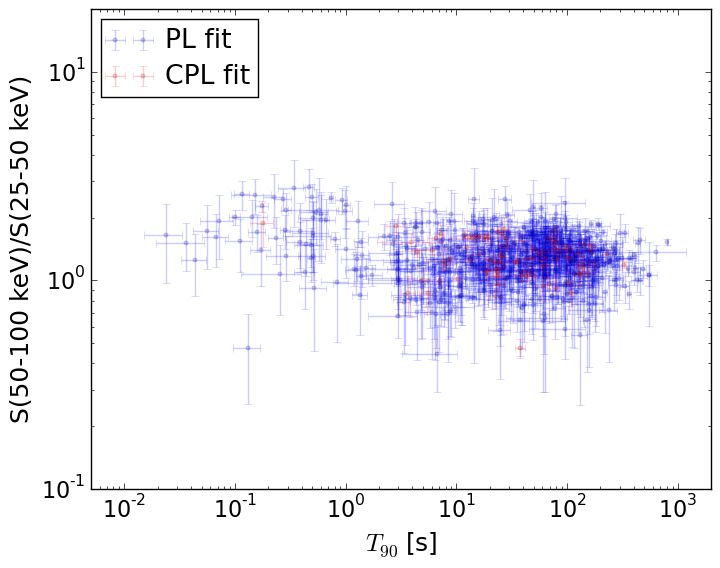
T90                                   = N/A sec.
Hardness ratio (energy fluence ratio) = N/A
S(15-50 keV) vs. S(50-150 keV) plot
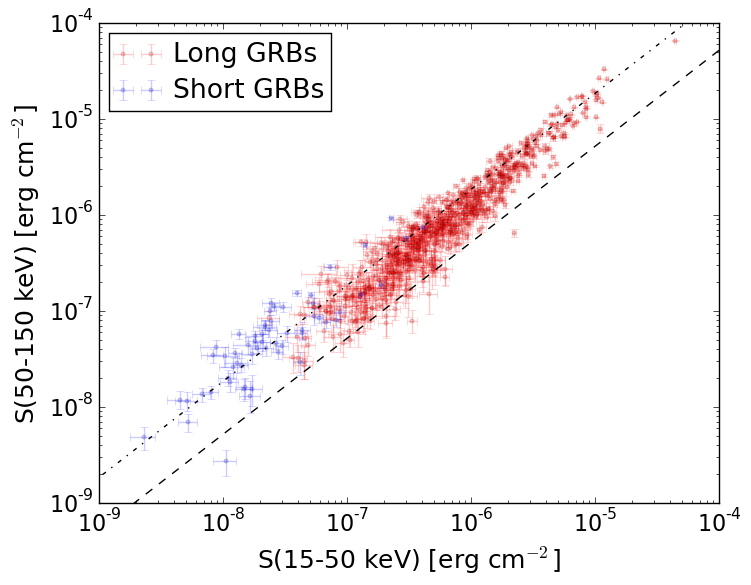
S(15-50 keV)  = N/A
S(50-150 keV) = N/A
The dash-dotted line and the dashed line traces the fluences calculated from the Band function with Epeak = 15 and 150 keV, respectively. Both lines assume a canonical values of alpha = -1 and beta = -2.5.
Mask shadow pattern
IMX = 4.847090538993031E-02, IMY = -3.503441877668790E-01
Spacecraft aspect plot
Bright source in the pre-burst/pre-slew/post-slew images
Pre-burst image of 15-350 keV band
Time interval of the image:
-10.072000 -4.732000

# RAcent  DECcent POSerr Theta    Phi  PeakCts   SNR AngSep     Name
#  [deg]    [deg]    ['] [deg]  [deg]                   [']
135.6411 -40.6780   11.6  37.2  -93.1  -0.0500  -1.0    9.0	Vela X-1
170.2044 -60.7621   82.1   8.1  -96.2   0.0026   0.1    9.0	Cen X-3
186.2514 -62.8738    0.0   0.3  -61.6   0.0293   1.7   12.7	GX 301-2
227.2846 -59.4519    1.8  19.5   82.3   0.1483   6.3 ------	UNKNOWN
208.1890 -11.5160    2.5  53.8   10.8   0.3861   4.6 ------	UNKNOWN
Pre-slew background subtracted image of 15-350 keV band
Time interval of the image:
-4.732000 28.408000

# RAcent  DECcent POSerr Theta    Phi  PeakCts   SNR AngSep     Name
#  [deg]    [deg]    ['] [deg]  [deg]                   [']
135.7644 -40.6168    0.0  37.2  -92.9   0.2718   0.8   11.4	Vela X-1
170.7263 -60.5729   22.5   8.0  -94.2   0.0617   0.5   12.5	Cen X-3
186.2514 -62.8738    0.0   0.3  -61.6  -0.2432  -2.2   12.7	GX 301-2
227.2447 -59.4002    1.1  19.5   82.1   1.5747  10.3 ------	UNKNOWN
 82.1541 -68.6268    2.4  37.9 -160.5   0.8296   4.9 ------	UNKNOWN
Post-slew image of 15-350 keV band
Time interval of the image:
-10.072000 32.998000

# RAcent  DECcent POSerr Theta    Phi  PeakCts   SNR AngSep     Name
#  [deg]    [deg]    ['] [deg]  [deg]                   [']
135.5428 -40.6387    6.7  37.3  -93.2  -0.3250  -1.7    5.1	Vela X-1
170.6544 -60.5710    5.0   8.0  -94.3   0.1479   2.3   10.5	Cen X-3
186.4304 -62.5853    0.0   0.5  -32.0   0.0222   0.3   12.7	GX 301-2
356.2718 -66.4253    2.1  50.3  159.1   1.1453   5.4 ------	UNKNOWN
227.2623 -59.4255    0.3  19.5   82.2   2.7438  35.3 ------	UNKNOWN
 50.9465 -52.8983    3.4  59.0 -166.1   1.3023   3.4 ------	UNKNOWN
106.8834 -57.6921    2.9  37.2 -135.1   0.3700   4.0 ------	UNKNOWN
129.4186 -39.2781    3.8  41.1  -98.0   0.8555   3.0 ------	UNKNOWN