Analysis Summary
Notes:
- 1) No attempt has been made to eliminate the non-significant decimal places.
- 2) This batgrbproduct analysis is done using the HEASARC data.
- 3) This batgrbproduct analysis is using the flight position for the mask-weighting calculation.
======================================================================
BAT GRB EVENT DATA PROCESSING REPORT
Process Script Ver: batgrbproduct v2.46
Process Start Time: Wed Jan 22 21:46:50 EST 2014
Host Name: batevent1
Current Working Dir: /local/data/batevent/batevent_reproc/trigger145581
======================================================================
Trigger: 00145581 Segment: 000
BAT Trigger Time: 142869627.136 [s; MET]
Trigger Stop: 142869654.016 [s; MET]
UTC: 2005-07-12T14:00:27.517820 [includes UTCF correction]
Where From?: TDRSS position message
BAT
RA: 77.6928992397336 Dec: 64.898850024641 [deg; J2000]
Catalogged Source?: NO
Point Source?: YES
GRB Indicated?: YES [ by BAT flight software ]
Image S/N Ratio: 8.89
Image Trigger?: NO
Rate S/N Ratio: 11.7898261225516 [ if not an image trigger ]
Image S/N Ratio: 8.89
Analysis Position: [ source = BAT ]
RA: 77.6928992397336 Dec: 64.898850024641 [deg; J2000]
Refined Position: [ source = BAT pre-slew burst ]
RA: 77.7221924188025 Dec: 64.9273059944435 [deg; J2000]
{ 05h 10m 53.3s , +64d 55' 38.3" }
+/- 1.69697651428425 [arcmin] (estimated 90% radius based on SNR)
+/- 0.74800414987494 [arcmin] (formal 1-sigma fit error)
SNR: 14.2892702092692
Angular difference between the analysis and refined position is 1.862902 arcmin
Partial Coding Fraction: 0.46875 [ including projection effects ]
Duration
T90: 51.3560000061989 +/- 7.86838358834463
Measured from: -12.9839999973774
to: 38.3720000088215 [s; relative to TRIGTIME]
T50: 26.9280000030994 +/- 6.96220945189602
Measured from: -1.95600000023842
to: 24.972000002861 [s; relative to TRIGTIME]
Fluence
Peak Flux (peak 1 second)
Measured from: 17.3879999816418
to: 18.3879999816418 [s; relative to TRIGTIME]
Total Fluence
Measured from: -20.444000005722
to: 40.1239999830723 [s; relative to TRIGTIME]
Band 1 Band 2 Band 3 Band 4
15-25 25-50 50-100 100-350 keV
Total 0.403036 0.634953 0.475121 0.119167
0.052820 0.055280 0.049318 0.043393 [error]
Peak 0.022065 0.026576 0.011826 0.010359
0.006927 0.006970 0.006228 0.005321 [error]
[ fluence units of on-axis counts / fully illuminated detector ]
======================================================================
====== Table of the duration information =============================
Value tstart tstop
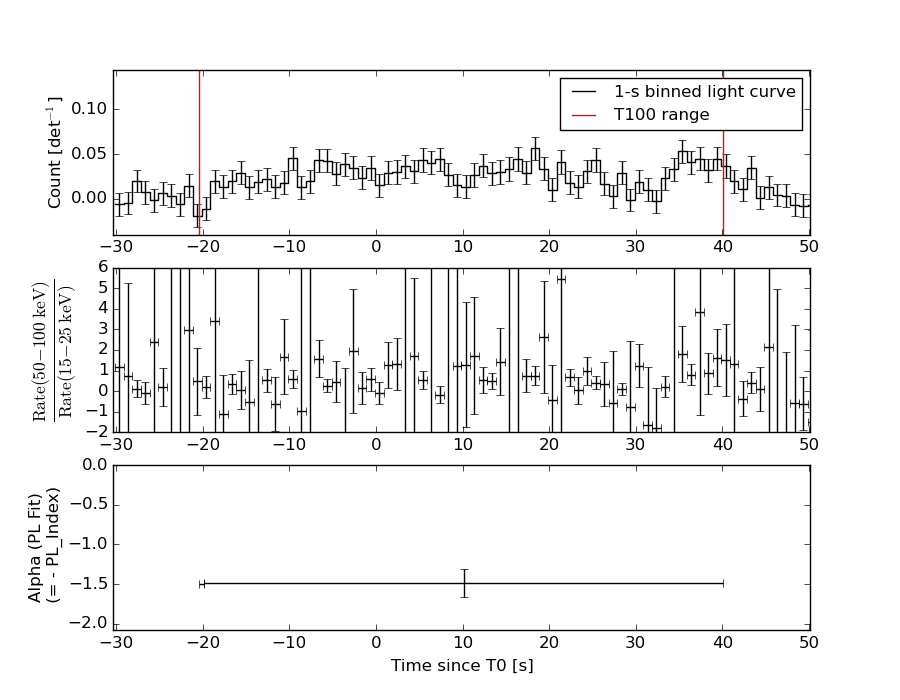
T100 60.568 -20.444 40.124
T90 51.356 -12.984 38.372
T50 26.928 -1.956 24.972
Peak 1.000 17.388 18.388
====== Spectral Analysis Summary =====================================
Model : spectral model: simple power-law (PL) and cutoff power-law (CPL)
Ph_index : photon index: E^{Ph_index}
Ph_90err : 90% error of the photon index
Epeak : Epeak in keV
Epeak_90err: 90% error of Epeak
Norm : normalization at 50 keV in both the PL model and CPL model
Nomr_90err : 90% error of the normalization
chi2 : Chi-Squared
dof : degree of freedo
=== Time-averaged spectral analysis ===
(Best model with acceptable fit: PL)
Model Ph_index Ph_90err_low Ph_90err_hi Epeak Epeak_90err_low Epeak_90err_hi Norm Nomr_90err_low Norm_90err_hi chi2 dof
PL -1.496 -0.177 0.176 - - - 1.90e-03 -1.90e-04 1.89e-04 57.800 57
CPL -1.448 -1.298 0.579 584.950 -584.950 -584.950 2.00e-03 N/A N/A 57.840 56
=== 1-s peak spectral analysis ===
(Best model with acceptable fit: N/A)
Model Ph_index Ph_90err_low Ph_90err_hi Epeak Epeak_90err_low Epeak_90err_hi Norm Nomr_90err_low Norm_90err_hi chi2 dof
PL -2.001 -0.635 0.539 - - - 3.68e-03 -1.54e-03 1.48e-03 68.020 57
CPL -0.333 -1.795 0.333 37.997 N/A N/A 3.86e-02 N/A N/A 66.860 56
=== Fluence/Peak Flux Summary ===
Model Band1 Band2 Band3 Band4 Band5 Total
15-25 25-50 50-100 100-350 15-150 15-350 keV
Fluence PL 1.46e-07 2.69e-07 3.82e-07 1.14e-06 1.09e-06 1.94e-06 erg/cm2
90%_error_low -2.48e-08 -2.83e-08 -4.97e-08 -2.91e-07 -1.19e-07 -3.33e-07 erg/cm2
90%_error_hi 2.59e-08 2.80e-08 4.92e-08 3.53e-07 1.20e-07 3.83e-07 erg/cm2
Peak flux PL 2.46e-01 1.84e-01 9.19e-02 6.56e-02 5.52e-01 5.87e-01 ph/cm2/s
90%_error_low -5.71e-02 -6.06e-02 -2.63e-02 -6.56e-02 -1.81e-01 -1.94e-01 ph/cm2/s
90%_error_hi 1.11e-01 6.05e-02 4.95e-02 8.42e-02 1.81e-01 1.95e-01 ph/cm2/s
Fluence CPL 1.47e-07 2.69e-07 3.81e-07 1.17e-06 1.09e-06 1.93e-06 erg/cm2
90%_error_low -2.66e-08 -2.76e-08 -4.99e-08 -7.14e-07 -1.30e-07 -6.73e-07 erg/cm2
90%_error_hi 2.38e-08 3.35e-08 5.47e-08 1.65e-08 1.01e-07 2.00e-07 erg/cm2
Peak flux CPL 2.22e-01 2.24e-01 7.88e-02 7.48e-03 5.32e-01 5.33e-01 ph/cm2/s
90%_error_low -2.22e-01 -8.55e-02 -7.88e-02 -7.48e-03 -2.05e-01 -2.05e-01 ph/cm2/s
90%_error_hi 1.19e-01 1.17e-01 6.57e-02 8.40e-02 1.84e-01 2.02e-01 ph/cm2/s
======================================================================
Image
Pre-slew 15.0-350.0 keV image (Event data)
#   RAcent    DECcent   POSerr    Theta     Phi              Peak Cts       SNR   Name
   77.7222    64.9273   0.0134    38.3947  -141.0804         1.7209023     14.289 TRIG_00145581

Foreground time interval of the image:
-20.444  40.124 (delta_t =  60.568 [sec])
Background time interval of the image:
-299.136 -20.444 (delta_t = 278.692 [sec])
Light Curves
Note: The mask-weighted lightcurves have units of either count/det or counts/sec/det, where a det is 0.4 x 0.4 = 0.16 sq cm.
Full-time range; 1 s binning
Other quick-look light curves:
- 64 ms binning (zoomed)
- 16 ms binning (zoomed)
- 8 ms binning (zoomed)
- 2 ms binning (zoomed)
- SN=5 or 10 s binning (full-time range)
- Raw light curve
Spectra
- 64 ms binning (zoomed)
- 16 ms binning (zoomed)
- 8 ms binning (zoomed)
- 2 ms binning (zoomed)
- SN=5 or 10 s binning (full-time range)
- Raw light curve
Spectra
Notes:
- 1) The fitting includes the systematic errors.
- 2) When the burst includes telescope slew time periods, the fitting uses an average response file made from multiple 5-s response files through out the slew time plus single time preiod for the non-slew times, and weighted by the total counts in the corresponding time period using addrmf. An average response file is needed becuase a spectral fit using the pre-slew DRM will introduce some errors in both a spectral shape and a normalization if the PHA file contains a lot of the slew/post-slew time interval.
- 3) For fits to more complicated models (e.g. a power-law over a cutoff power-law), the BAT team has decided to require a chi-square improvement of more than 6 for each extra dof.
Time averaged spectrum fit using the average DRM
Power-law model
Time interval is from  -20.444 sec. to   40.124 sec.

Spectral model in power-law:
------------------------------------------------------------
Parameters  : value       lower 90%   higher 90%
Photon index: -1.49638     ( -0.17681   0.175702 )
Norm@50keV  : 1.89709E-03    ( -0.000190186   0.000189299 )
------------------------------------------------------------
#Fit statistic : Chi-Squared =          57.80 using 59 PHA bins.
# Reduced chi-squared =          1.014 for     57 degrees of freedom
# Null hypothesis probability =   4.454281e-01

Photon flux (15-150 keV)    in 60.57 sec: 0.236607 ( -0.023919  0.02398 ) ph/cm2/s
Energy fluence (15-150 keV)             : 1.09085e-06 ( -1.19187e-07  1.201e-07 ) ergs/cm2
Cutoff power-law model
Time interval is from  -20.444 sec. to   40.124 sec.
Spectral model in the cutoff power-law:
------------------------------------------------------------
Parameters  : value       lower 90%   higher 90%
Photon index: -1.49374     ( -1.26079   0.616355 )
Epeak [keV] : 1.00000E+04      ( -10000 -10000 )
Norm@50keV  : 1.90287E-03    (     )
------------------------------------------------------------
#Fit statistic : Chi-Squared =          57.80 using 59 PHA bins.
# Reduced chi-squared =          1.032 for     56 degrees of freedom
# Null hypothesis probability =   4.084649e-01

Photon flux (15-150 keV)    in 60.57 sec: 0.236890 ( -0.024566  0.024007 ) ph/cm2/s
Energy fluence (15-150 keV)             : 1.09284e-06 ( -1.30236e-07  1.01416e-07 ) ergs/cm2
1-s peak spectrum fit
Power-law model
Time interval is from   17.388 sec. to   18.388 sec.

Spectral model in power-law:
------------------------------------------------------------
Parameters  : value       lower 90%   higher 90%
Photon index: -2.00149     ( -0.635481   0.537988 )
Norm@50keV  : 3.67768E-03    ( -0.00153992   0.00147723 )
------------------------------------------------------------
#Fit statistic : Chi-Squared =          68.02 using 59 PHA bins.
# Reduced chi-squared =          1.193 for     57 degrees of freedom
# Null hypothesis probability =   1.506281e-01

Photon flux (15-150 keV)    in 1 sec: 0.552066 ( -0.180732  0.180763 ) ph/cm2/s
Energy fluence (15-150 keV)             : 3.39297e-08 ( -1.284e-08  1.3652e-08 ) ergs/cm2
Cutoff power-law model
Time interval is from   17.388 sec. to   18.388 sec.
Spectral model in the cutoff power-law:
------------------------------------------------------------
Parameters  : value       lower 90%   higher 90%
Photon index: -0.333077     ( -1.82698   0.300948 )
Epeak [keV] : 37.9970      (   )
Norm@50keV  : 3.85922E-02    (     )
------------------------------------------------------------
#Fit statistic : Chi-Squared =          66.86 using 59 PHA bins.
# Reduced chi-squared =          1.194 for     56 degrees of freedom
# Null hypothesis probability =   1.518330e-01

Photon flux (15-150 keV)    in 1 sec: 0.531740 ( -0.204529  0.183731 ) ph/cm2/s
Energy fluence (15-150 keV)             : 2.89514e-08 ( -1.37515e-08  1.56995e-08 ) ergs/cm2
Time-resolved spectra
Distribution
T90 vs. Hardness ratio plot
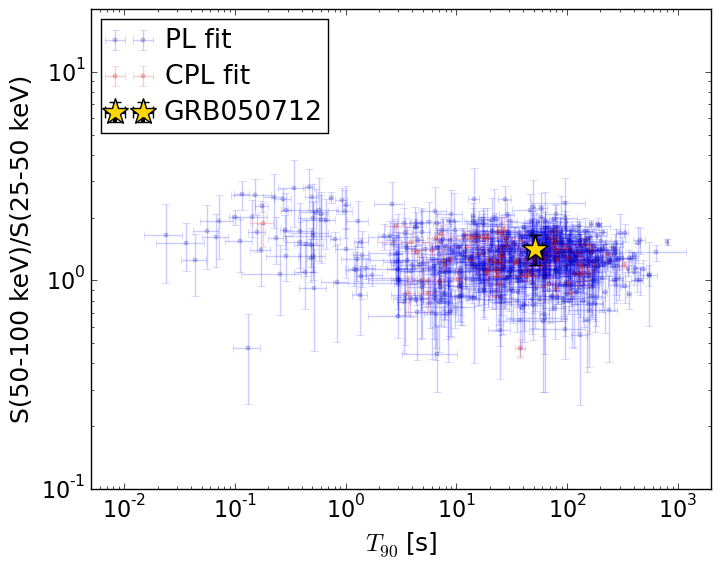
T90                                   = 51.356 sec.
Hardness ratio (energy fluence ratio) = 1.41778334954
S(15-50 keV) vs. S(50-150 keV) plot
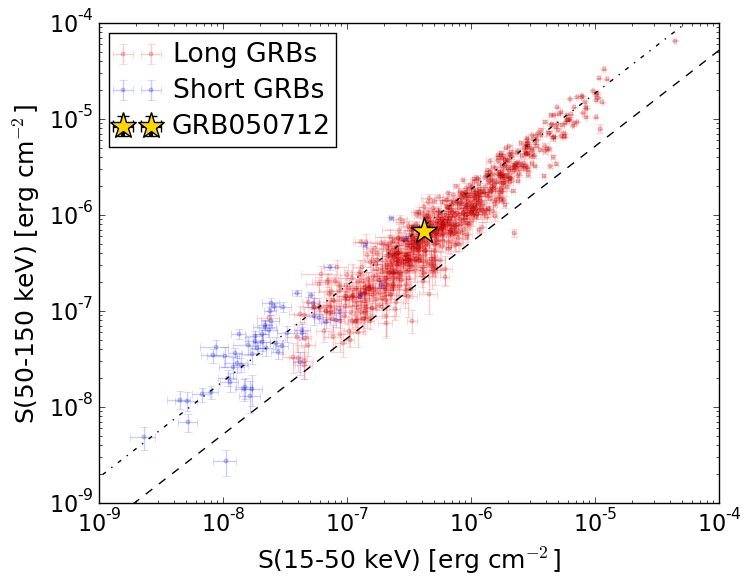
S(15-50 keV)  = 4.155216e-07
S(50-150 keV) = 6.753281e-07
The dash-dotted line and the dashed line traces the fluences calculated from the Band function with Epeak = 15 and 150 keV, respectively. Both lines assume a canonical values of alpha = -1 and beta = -2.5.
Mask shadow pattern
IMX = -6.165415413715893E-01, IMY = 4.978340875213606E-01
Spacecraft aspect plot
Bright source in the pre-burst/pre-slew/post-slew images
Pre-burst image of 15-350 keV band
Time interval of the image:
-299.136000 -20.444000

# RAcent  DECcent POSerr Theta    Phi  PeakCts   SNR AngSep     Name
#  [deg]    [deg]    ['] [deg]  [deg]                   [']
325.0044  63.8838    3.3  49.4  158.3   2.5437   3.5 ------	UNKNOWN
340.7965  85.8343    3.0  51.6 -173.0   2.3375   3.8 ------	UNKNOWN
 74.6342  20.3574    3.1  38.1  -65.4   2.0123   3.8 ------	UNKNOWN
Pre-slew background subtracted image of 15-350 keV band
Time interval of the image:
-20.444000 40.124000

# RAcent  DECcent POSerr Theta    Phi  PeakCts   SNR AngSep     Name
#  [deg]    [deg]    ['] [deg]  [deg]                   [']
 37.3452  10.7202    2.2  25.4    5.5   0.4550   5.3 ------	UNKNOWN
350.4155  80.7617    2.7  47.7 -177.5   0.6508   4.3 ------	UNKNOWN
 30.0142  65.7389    2.4  29.9 -172.7   0.3946   4.9 ------	UNKNOWN
 59.4658  85.0970    1.9  49.6 -166.1   0.9466   6.1 ------	UNKNOWN
 77.7222  64.9273    0.8  38.4 -141.1   1.7207  14.3 ------	UNKNOWN
Post-slew image of 15-350 keV band
Time interval of the image:
149.964600 302.936100

# RAcent  DECcent POSerr Theta    Phi  PeakCts   SNR AngSep     Name
#  [deg]    [deg]    ['] [deg]  [deg]                   [']
 83.6289  22.0148    0.6  43.0  -53.8   6.1936  19.8    0.2	Crab
192.9908  47.5057    3.4  57.0 -178.9   2.2795   3.4 ------	UNKNOWN
 63.3757  22.3059    2.4  43.6  -26.3   0.8893   4.8 ------	UNKNOWN
179.6562  39.8505    3.3  59.2 -164.7   2.9796   3.5 ------	UNKNOWN
100.5050  42.4310    2.4  25.9  -86.7   0.7420   4.9 ------	UNKNOWN