Analysis Summary
Notes:
- 1) No attempt has been made to eliminate the non-significant decimal places.
- 2) This batgrbproduct analysis is done using the HEASARC data.
- 3) This batgrbproduct analysis is using the flight position for the mask-weighting calculation.
======================================================================
                  BAT GRB EVENT DATA PROCESSING REPORT
    Process Script Ver: batgrbproduct v2.46
    Process Start Time: Wed Jan 22 21:43:35 EST 2014
             Host Name: batevent1
   Current Working Dir: /local/data/batevent/batevent_reproc/trigger145675
======================================================================

  Trigger: 00145675      Segment: 000

  BAT Trigger Time: 142921742.016   [s; MET]
      Trigger Stop: 142921742.528   [s; MET]
               UTC: 2005-07-13T04:29:02.396820    [includes UTCF correction]
       Where From?: TDRSS position message

  BAT
    RA: 320.536539185524   Dec: 77.0721719432608  [deg; J2000]

     Catalogged Source?: NO
     Point Source?:      YES
     GRB Indicated?:     YES    [ by BAT flight software ]
     Image S/N Ratio:    11.32
     Image Trigger?:     NO
     Rate S/N Ratio:     31.2729915422238  [ if not an image trigger ]
     Image S/N Ratio:    11.32

  Analysis Position:   [ source = BAT ]
    RA: 320.536539185524   Dec: 77.0721719432608  [deg; J2000]

  Refined Position:   [ source = BAT pre-slew burst ]
    RA: 320.56737432516   Dec: 77.0719723903794  [deg; J2000]
        { 21h 22m 16.2s , +77d 04' 19.1" }
         +/- 1.06397059669473 [arcmin] (estimated 90% radius based on SNR)
         +/- 0.345355816260137 [arcmin] (formal 1-sigma fit error)
    SNR: 27.8386060603808

  Angular difference between the analysis and refined position is 0.414089 arcmin

  Partial Coding Fraction: 0.3046875    [ including projection effects ]

  Duration
     T90: 124.67199999094 +/- 62.407646704848
        Measured from: -52.7439999878407
                   to: 71.9280000030994     [s; relative to TRIGTIME]
     T50: 10.5600000023842 +/- 1.39778108223621
        Measured from: 2.87200000882149
                   to: 13.4320000112057     [s; relative to TRIGTIME]


  Fluence
     Peak Flux  (peak 1 second)
        Measured from: 1.06000000238419
                   to: 2.06000000238419     [s; relative to TRIGTIME]
     Total Fluence
        Measured from: -69.3840000033379
                   to: 121.33599999547     [s; relative to TRIGTIME]

             Band 1     Band 2     Band 3     Band 4
              15-25      25-50     50-100    100-350     keV
 Total     2.241787   2.883991   2.394183   0.690508
           0.092815   0.097730   0.086758   0.075941 [error]
 Peak      0.110138   0.210724   0.169536   0.074298
           0.011133   0.012580   0.011785   0.009701 [error]

     [ fluence units of on-axis counts / fully illuminated detector ]

======================================================================


====== Table of the duration information =============================

        Value   tstart    tstop
T100  190.720  -69.384  121.336
T90   124.672  -52.744   71.928
T50    10.560    2.872   13.432
Peak    1.000    1.060    2.060


====== Spectral Analysis Summary =====================================

Model      : spectral model: simple power-law (PL) and cutoff power-law (CPL)
Ph_index   : photon index: E^{Ph_index}
Ph_90err   : 90% error of the photon index
Epeak      : Epeak in keV
Epeak_90err: 90% error of Epeak
Norm       : normalization at 50 keV in both the PL model and CPL model
Nomr_90err : 90% error of the normalization
chi2       : Chi-Squared
dof        : degree of freedo

=== Time-averaged spectral analysis ===
(Best model with acceptable fit: PL)

Model Ph_index Ph_90err_low Ph_90err_hi  Epeak  Epeak_90err_low  Epeak_90err_hi  Norm       Nomr_90err_low    Norm_90err_hi    chi2    dof
PL      -1.529    -0.072      0.072       -           -               -         2.85e-03     -1.09e-04          1.09e-04      54.870   57
CPL     -1.405    -0.160      0.282      252.625    -252.625      -252.625      3.27e-03     -5.05e-04          1.15e-03      54.250   56


=== 1-s peak spectral analysis ===
(Best model with acceptable fit: PL)

Model Ph_index Ph_90err_low Ph_90err_hi  Epeak  Epeak_90err_low  Epeak_90err_hi  Norm       Nomr_90err_low    Norm_90err_hi    chi2    dof
PL      -1.234     -0.120     0.121       -           -               -         3.82e-02     -2.59e-03          2.59e-03      66.730   57
CPL     -1.176     -0.168     0.475      752.779    -752.779      -752.779      4.08e-02     -4.81e-03          2.75e-02      66.680   56


=== Fluence/Peak Flux Summary ===

              Model    Band1     Band2     Band3     Band4     Band5     Total
                       15-25     25-50    50-100    100-350    15-150    15-350    keV
Fluence         PL   7.13e-07  1.29e-06  1.78e-06  5.15e-06  5.13e-06  8.93e-06   erg/cm2
      90%_error_low -5.09e-08 -5.40e-08 -8.84e-08 -5.51e-07 -2.12e-07 -6.10e-07   erg/cm2
      90%_error_hi   5.22e-08  5.38e-08  8.81e-08  5.96e-07  2.12e-07  6.46e-07   erg/cm2
Peak flux       PL   1.22e+00  1.44e+00  1.22e+00  1.77e+00  4.51e+00  5.65e+00   ph/cm2/s
      90%_error_low -1.57e-01 -1.14e-01 -9.80e-02 -2.85e-01 -3.14e-01 -4.02e-01   ph/cm2/s
      90%_error_hi   1.63e-01  1.13e-01  9.72e-02  3.18e-01  3.14e-01  4.06e-01   ph/cm2/s

Fluence        CPL   6.94e-07  1.30e-06  1.80e-06  4.29e-06  5.08e-06  8.08e-06   erg/cm2
      90%_error_low -6.36e-08 -5.84e-08 -9.45e-08 -1.36e-06 -2.37e-07 -1.38e-06   erg/cm2
      90%_error_hi   5.89e-08  6.05e-08  9.57e-08  1.41e-06  2.31e-07  1.08e-06   erg/cm2
Peak flux      CPL   1.21e+00  1.45e+00  1.23e+00  1.83e+00  4.50e+00  5.53e+00   ph/cm2/s
      90%_error_low -1.89e-01 -1.19e-01 -1.04e-01 -8.76e-01 -3.25e-01 -7.56e-01   ph/cm2/s
      90%_error_hi   1.53e-01  1.28e-01  1.13e-01  1.30e-01  3.17e-01  4.95e-01   ph/cm2/s

======================================================================
Image
Pre-slew 15.0-350.0 keV image (Event data)
#   RAcent    DECcent   POSerr    Theta     Phi              Peak Cts       SNR   Name
  320.5674    77.0720   0.0069    32.9653   114.3292         5.0628015     27.839 TRIG_00145675

Foreground time interval of the image:
-69.384   9.485 (delta_t =  78.869 [sec])
Background time interval of the image:
-244.315 -69.384 (delta_t = 174.931 [sec])
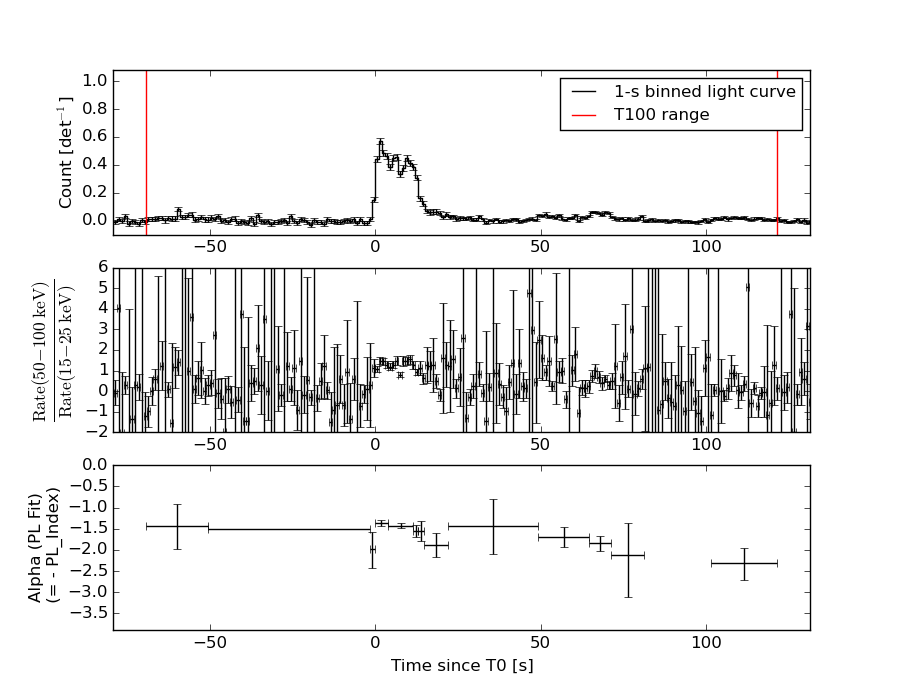
Light Curves
Note: The mask-weighted lightcurves have units of either count/det or counts/sec/det, where a det is 0.4 x 0.4 = 0.16 sq cm.
Full-time range; 1 s binning
Other quick-look light curves:
- 64 ms binning (zoomed)
- 16 ms binning (zoomed)
- 8 ms binning (zoomed)
- 2 ms binning (zoomed)
- SN=5 or 10 s binning (full-time range)
- Raw light curve
Spectra
- 64 ms binning (zoomed)
- 16 ms binning (zoomed)
- 8 ms binning (zoomed)
- 2 ms binning (zoomed)
- SN=5 or 10 s binning (full-time range)
- Raw light curve
Spectra
Notes:
- 1) The fitting includes the systematic errors.
- 2) When the burst includes telescope slew time periods, the fitting uses an average response file made from multiple 5-s response files through out the slew time plus single time preiod for the non-slew times, and weighted by the total counts in the corresponding time period using addrmf. An average response file is needed becuase a spectral fit using the pre-slew DRM will introduce some errors in both a spectral shape and a normalization if the PHA file contains a lot of the slew/post-slew time interval.
- 3) For fits to more complicated models (e.g. a power-law over a cutoff power-law), the BAT team has decided to require a chi-square improvement of more than 6 for each extra dof.
Time averaged spectrum fit using the average DRM
Power-law model
Time interval is from  -69.384 sec. to  121.336 sec.

Spectral model in power-law:
------------------------------------------------------------
Parameters  : value       lower 90%   higher 90%
Photon index: -1.52889     ( -0.071837   0.0716782 )
Norm@50keV  : 2.84867E-03    ( -0.000109224   0.000109067 )
------------------------------------------------------------
#Fit statistic : Chi-Squared =          54.87 using 59 PHA bins.
# Reduced chi-squared =         0.9626 for     57 degrees of freedom
# Null hypothesis probability =   5.555126e-01

Photon flux (15-150 keV)    in 190.7 sec: 0.358470 ( -0.014522  0.014576 ) ph/cm2/s
Energy fluence (15-150 keV)             : 5.13075e-06 ( -2.11587e-07  2.12323e-07 ) ergs/cm2
Cutoff power-law model
Time interval is from  -69.384 sec. to  121.336 sec.
Spectral model in the cutoff power-law:
------------------------------------------------------------
Parameters  : value       lower 90%   higher 90%
Photon index: -1.40526     ( -0.159753   0.282257 )
Epeak [keV] : 252.625      ( -252.618 -252.618 )
Norm@50keV  : 3.26543E-03    ( -0.000504689   0.0011549 )
------------------------------------------------------------
#Fit statistic : Chi-Squared =          54.25 using 59 PHA bins.
# Reduced chi-squared =         0.9688 for     56 degrees of freedom
# Null hypothesis probability =   5.412890e-01

Photon flux (15-150 keV)    in 190.7 sec: 0.355522 ( -0.015797  0.015786 ) ph/cm2/s
Energy fluence (15-150 keV)             : 5.08231e-06 ( -2.36561e-07  2.31069e-07 ) ergs/cm2
1-s peak spectrum fit
Power-law model
Time interval is from    1.060 sec. to    2.060 sec.

Spectral model in power-law:
------------------------------------------------------------
Parameters  : value       lower 90%   higher 90%
Photon index: -1.23367     ( -0.119777   0.120659 )
Norm@50keV  : 3.82497E-02    ( -0.00258645   0.00258622 )
------------------------------------------------------------
#Fit statistic : Chi-Squared =          66.73 using 59 PHA bins.
# Reduced chi-squared =          1.171 for     57 degrees of freedom
# Null hypothesis probability =   1.772949e-01

Photon flux (15-150 keV)    in 1 sec: 4.51221 ( -0.31409  0.31447 ) ph/cm2/s
Energy fluence (15-150 keV)             : 3.84512e-07 ( -2.90035e-08  2.91923e-08 ) ergs/cm2
Cutoff power-law model
Time interval is from    1.060 sec. to    2.060 sec.
Spectral model in the cutoff power-law:
------------------------------------------------------------
Parameters  : value       lower 90%   higher 90%
Photon index: -1.17551     ( -0.16768   0.474647 )
Epeak [keV] : 752.779      ( -753.484 -753.484 )
Norm@50keV  : 4.08123E-02    ( -0.00480845   0.0274934 )
------------------------------------------------------------
#Fit statistic : Chi-Squared =          66.68 using 59 PHA bins.
# Reduced chi-squared =          1.191 for     56 degrees of freedom
# Null hypothesis probability =   1.554199e-01

Photon flux (15-150 keV)    in 1 sec: 4.50127 ( -0.32458  0.31715 ) ph/cm2/s
Energy fluence (15-150 keV)             : 3.82992e-07 ( -3.14882e-08  2.90581e-08 ) ergs/cm2
Time-resolved spectra
Distribution
T90 vs. Hardness ratio plot
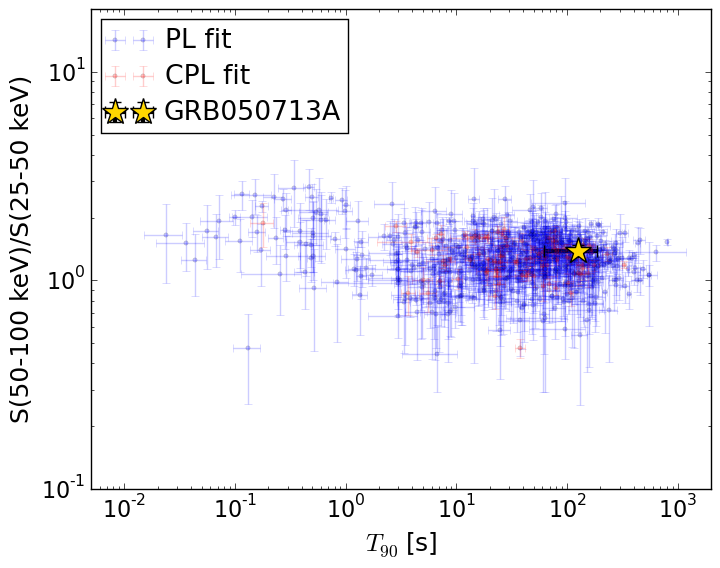
T90                                   = 124.672 sec.
Hardness ratio (energy fluence ratio) = 1.38621244385
S(15-50 keV) vs. S(50-150 keV) plot
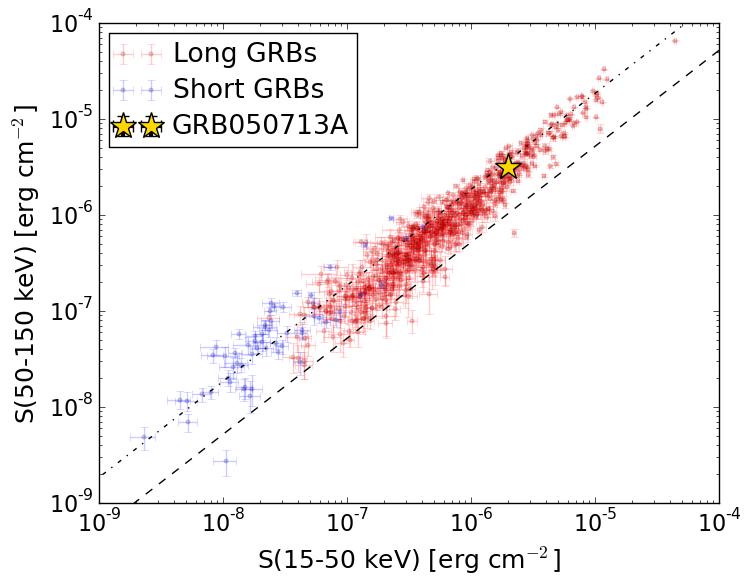
S(15-50 keV)  = 1.9994629e-06
S(50-150 keV) = 3.131263e-06
The dash-dotted line and the dashed line traces the fluences calculated from the Band function with Epeak = 15 and 150 keV, respectively. Both lines assume a canonical values of alpha = -1 and beta = -2.5.
Mask shadow pattern
IMX = -2.671879836225824E-01, IMY = -5.909513842115559E-01
Spacecraft aspect plot
Bright source in the pre-burst/pre-slew/post-slew images
Pre-burst image of 15-350 keV band
Time interval of the image:
-244.315400 -69.384000

# RAcent  DECcent POSerr Theta    Phi  PeakCts   SNR AngSep     Name
#  [deg]    [deg]    ['] [deg]  [deg]                   [']
 83.6208  22.0128    0.6  43.0  -52.2   6.9691  20.0    0.7	Crab
 40.1639  60.5879    2.4  17.4   49.1   0.6344   4.9 ------	UNKNOWN
Pre-slew background subtracted image of 15-350 keV band
Time interval of the image:
-69.384000 9.484600

# RAcent  DECcent POSerr Theta    Phi  PeakCts   SNR AngSep     Name
#  [deg]    [deg]    ['] [deg]  [deg]                   [']
 83.8243  21.9672    3.8  43.1  -52.5   0.7361   3.0   11.0	Crab
320.5673  77.0720    0.4  33.0  114.3   5.0622  27.8 ------	UNKNOWN
Post-slew image of 15-350 keV band
Time interval of the image:
61.684600 303.035300

# RAcent  DECcent POSerr Theta    Phi  PeakCts   SNR AngSep     Name
#  [deg]    [deg]    ['] [deg]  [deg]                   [']
308.1241  40.8971    4.0  36.6   79.7   1.1629   2.9    3.4	Cyg X-3
326.0056  38.2270    7.0  38.9   57.0   0.6495   1.6    9.7	Cyg X-2
  1.6679  35.7724    2.7  45.0   14.9   1.2688   4.3 ------	UNKNOWN
320.6142  77.0663    1.6   0.0   96.3   1.0312   7.4 ------	UNKNOWN
 36.5615  48.9031    2.5  39.6  -27.4   0.9536   4.6 ------	UNKNOWN
187.5988  44.2187    2.6  55.2 -155.9   2.3176   4.5 ------	UNKNOWN