Analysis Summary
Notes:
- 1) No attempt has been made to eliminate the non-significant decimal places.
- 2) This batgrbproduct analysis is done using the HEASARC data.
- 3) This batgrbproduct analysis is using the flight position for the mask-weighting calculation.
======================================================================
BAT GRB EVENT DATA PROCESSING REPORT
Process Script Ver: batgrbproduct v2.46
Process Start Time: Thu Sep 11 19:45:38 EDT 2014
Host Name: batevent1
Current Working Dir: /local/data/batevent/batevent_reproc/trigger145994
======================================================================
Trigger: 00145994 Segment: 000
BAT Trigger Time: 143073632 [s; MET]
Trigger Stop: 143073696 [s; MET]
UTC: 2005-07-14T22:40:32.377900 [includes UTCF correction]
Where From?: TDRSS position message
BAT
RA: 169.69397915696 Dec: -15.5277825312379 [deg; J2000]
Catalogged Source?: NO
Point Source?: YES
GRB Indicated?: YES [ by BAT flight software ]
Image S/N Ratio: 10.07
Image Trigger?: YES
Rate S/N Ratio: 0 [ if not an image trigger ]
Image S/N Ratio: 10.07
Analysis Position: [ source = BAT ]
RA: 169.69397915696 Dec: -15.5277825312379 [deg; J2000]
Refined Position: [ source = BAT pre-slew burst ]
RA: 169.685757439453 Dec: -15.5446774461554 [deg; J2000]
{ 11h 18m 44.6s , -15d 32' 40.8" }
+/- 2.45400806630531 [arcmin] (estimated 90% radius based on SNR)
+/- 1.09681943183775 [arcmin] (formal 1-sigma fit error)
SNR: 8.43631302857758
Angular difference between the analysis and refined position is 1.119583 arcmin
Partial Coding Fraction: 0.3945312 [ including projection effects ]
Duration
T90: 49.363999992609 +/- 11.2912489990715
Measured from: 17.7080000042915
to: 67.0719999969006 [s; relative to TRIGTIME]
T50: 24.5600000023842 +/- 8.26910682771996
Measured from: 29.2759999930859
to: 53.83599999547 [s; relative to TRIGTIME]
Fluence
Peak Flux (peak 1 second)
Measured from: 55.1680000126362
to: 56.1680000126362 [s; relative to TRIGTIME]
Total Fluence
Measured from: 13.4920000135899
to: 68.2479999959469 [s; relative to TRIGTIME]
Band 1 Band 2 Band 3 Band 4
15-25 25-50 50-100 100-350 keV
Total 0.495592 0.527384 0.104254 0.076400
0.059257 0.061745 0.054307 0.048546 [error]
Peak 0.017635 0.028582 0.011863 0.005873
0.007865 0.008419 0.007342 0.006494 [error]
[ fluence units of on-axis counts / fully illuminated detector ]
======================================================================
====== Table of the duration information =============================
Value tstart tstop
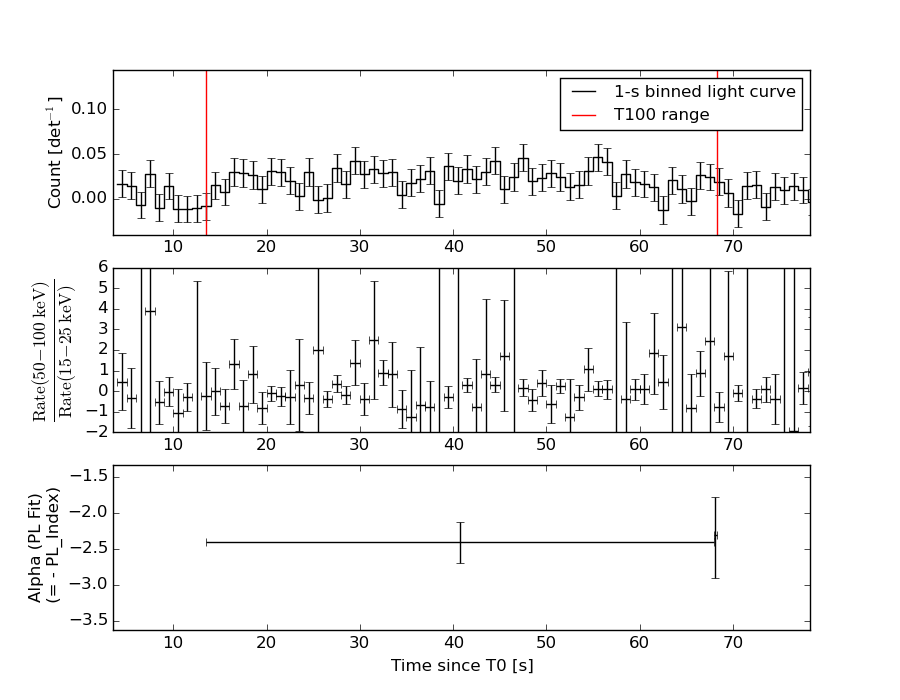
T100 54.756 13.492 68.248
T90 49.364 17.708 67.072
T50 24.560 29.276 53.836
Peak 1.000 55.168 56.168
====== Spectral Analysis Summary =====================================
Model : spectral model: simple power-law (PL) and cutoff power-law (CPL)
Ph_index : photon index: E^{Ph_index}
Ph_90err : 90% error of the photon index
Epeak : Epeak in keV
Epeak_90err: 90% error of Epeak
Norm : normalization at 50 keV in both the PL model and CPL model
Nomr_90err : 90% error of the normalization
chi2 : Chi-Squared
dof : degree of freedo
=== Time-averaged spectral analysis ===
(Best model with acceptable fit: PL)
Model Ph_index Ph_90err_low Ph_90err_hi Epeak Epeak_90err_low Epeak_90err_hi Norm Nomr_90err_low Norm_90err_hi chi2 dof
PL -2.396 -0.291 0.261 - - - 1.18e-03 -2.54e-04 2.51e-04 59.860 57
CPL -0.009 -1.445 2.072 30.079 -10.423 6.230 3.67e-02 -3.67e-02 7.65e-01 50.770 56
=== 1-s peak spectral analysis ===
(Best model with acceptable fit: N/A)
Model Ph_index Ph_90err_low Ph_90err_hi Epeak Epeak_90err_low Epeak_90err_hi Norm Nomr_90err_low Norm_90err_hi chi2 dof
PL -2.012 -0.904 0.720 - - - 3.67e-03 -3.67e-03 1.79e-03 57.330 57
CPL -1.879 -0.542 1.879 38.797 N/A N/A 4.38e-03 N/A N/A 57.310 56
=== Fluence/Peak Flux Summary ===
Model Band1 Band2 Band3 Band4 Band5 Total
15-25 25-50 50-100 100-350 15-150 15-350 keV
Fluence PL 1.93e-07 2.06e-07 1.57e-07 1.94e-07 6.30e-07 7.51e-07 erg/cm2
90%_error_low -3.35e-08 -3.23e-08 -4.34e-08 -8.52e-08 -1.07e-07 -1.57e-07 erg/cm2
90%_error_hi 3.41e-08 3.19e-08 4.66e-08 1.21e-07 1.11e-07 1.82e-07 erg/cm2
Peak flux PL 2.47e-01 1.84e-01 9.14e-02 6.46e-02 5.53e-01 5.87e-01 ph/cm2/s
90%_error_low -1.31e-01 -7.35e-02 -5.77e-02 -6.46e-02 -2.20e-01 -2.34e-01 ph/cm2/s
90%_error_hi 1.44e-01 7.31e-02 6.13e-02 1.18e-01 2.20e-01 2.36e-01 ph/cm2/s
Fluence CPL 1.73e-07 2.62e-07 1.08e-07 7.09e-09 5.50e-07 5.51e-07 erg/cm2
90%_error_low -3.89e-08 -4.60e-08 -5.37e-08 -6.57e-09 -9.18e-08 -9.21e-08 erg/cm2
90%_error_hi 3.84e-08 4.71e-08 6.16e-08 3.91e-08 1.02e-07 1.06e-07 erg/cm2
Peak flux CPL 2.44e-01 1.87e-01 9.15e-02 5.31e-02 5.51e-01 5.77e-01 ph/cm2/s
90%_error_low -1.42e-01 N/A N/A -5.31e-02 -2.21e-01 -2.43e-01 ph/cm2/s
90%_error_hi 1.37e-01 N/A N/A 5.70e-02 2.21e-01 2.51e-01 ph/cm2/s
======================================================================
Image
Pre-slew 15.0-350.0 keV image (Event data)
#   RAcent    DECcent   POSerr    Theta     Phi              Peak Cts       SNR   Name
  169.6858   -15.5447   0.0226    46.3730  -171.4621         1.0907411      8.436 TRIG_00145994

Foreground time interval of the image:
 13.492  68.248 (delta_t =  54.756 [sec])
Background time interval of the image:
-159.299 -83.000 (delta_t =  76.300 [sec])
-82.000  13.492 (delta_t =  95.492 [sec])
Light Curves
Note: The mask-weighted lightcurves have units of either count/det or counts/sec/det, where a det is 0.4 x 0.4 = 0.16 sq cm.
Full-time range; 1 s binning
Other quick-look light curves:
- 64 ms binning (zoomed)
- 16 ms binning (zoomed)
- 8 ms binning (zoomed)
- 2 ms binning (zoomed)
- SN=5 or 10 s binning (full-time range)
- Raw light curve
Spectra
- 64 ms binning (zoomed)
- 16 ms binning (zoomed)
- 8 ms binning (zoomed)
- 2 ms binning (zoomed)
- SN=5 or 10 s binning (full-time range)
- Raw light curve
Spectra
Notes:
- 1) The fitting includes the systematic errors.
- 2) When the burst includes telescope slew time periods, the fitting uses an average response file made from multiple 5-s response files through out the slew time plus single time preiod for the non-slew times, and weighted by the total counts in the corresponding time period using addrmf. An average response file is needed becuase a spectral fit using the pre-slew DRM will introduce some errors in both a spectral shape and a normalization if the PHA file contains a lot of the slew/post-slew time interval.
- 3) For fits to more complicated models (e.g. a power-law over a cutoff power-law), the BAT team has decided to require a chi-square improvement of more than 6 for each extra dof.
Time averaged spectrum fit using the average DRM
Power-law model
Time interval is from   13.492 sec. to   68.248 sec.

Spectral model in power-law:
------------------------------------------------------------
Parameters  : value       lower 90%   higher 90%
Photon index: -2.39618     ( -0.290435   0.261876 )
Norm@50keV  : 1.18008E-03    ( -0.000253678   0.000251516 )
------------------------------------------------------------
#Fit statistic : Chi-Squared =          59.86 using 59 PHA bins.
# Reduced chi-squared =          1.050 for     57 degrees of freedom
# Null hypothesis probability =   3.722271e-01

Photon flux (15-150 keV)    in 54.76 sec: 0.217884 ( -0.031132  0.031131 ) ph/cm2/s
Energy fluence (15-150 keV)             : 6.29888e-07 ( -1.07235e-07  1.10985e-07 ) ergs/cm2
Cutoff power-law model
Time interval is from   13.492 sec. to   68.248 sec.
Spectral model in the cutoff power-law:
------------------------------------------------------------
Parameters  : value       lower 90%   higher 90%
Photon index: -0.00920015     ( -1.48238   2.03486 )
Epeak [keV] : 30.0786      ( -10.5289 6.12426 )
Norm@50keV  : 3.67320E-02    ( -0.0401858   0.762033 )
------------------------------------------------------------
#Fit statistic : Chi-Squared =          50.77 using 59 PHA bins.
# Reduced chi-squared =         0.9067 for     56 degrees of freedom
# Null hypothesis probability =   6.724104e-01

Photon flux (15-150 keV)    in 54.76 sec: 0.208904 ( -0.030772  0.030947 ) ph/cm2/s
Energy fluence (15-150 keV)             : 5.50179e-07 ( -9.18013e-08  1.02476e-07 ) ergs/cm2
1-s peak spectrum fit
Power-law model
Time interval is from   55.168 sec. to   56.168 sec.

Spectral model in power-law:
------------------------------------------------------------
Parameters  : value       lower 90%   higher 90%
Photon index: -2.01151     ( -0.904169   0.720297 )
Norm@50keV  : 3.66710E-03    ( -0.0036671   0.00178842 )
------------------------------------------------------------
#Fit statistic : Chi-Squared =          57.33 using 59 PHA bins.
# Reduced chi-squared =          1.006 for     57 degrees of freedom
# Null hypothesis probability =   4.629935e-01

Photon flux (15-150 keV)    in 1 sec: 0.553039 ( -0.219608  0.219717 ) ph/cm2/s
Energy fluence (15-150 keV)             : 3.38446e-08 ( -1.55876e-08  1.6682e-08 ) ergs/cm2
Cutoff power-law model
Time interval is from   55.168 sec. to   56.168 sec.
Spectral model in the cutoff power-law:
------------------------------------------------------------
Parameters  : value       lower 90%   higher 90%
Photon index: -1.87923     ( -0.540345   1.88136 )
Epeak [keV] : 38.7967      (   )
Norm@50keV  : 4.37537E-03    (     )
------------------------------------------------------------
#Fit statistic : Chi-Squared =          57.31 using 59 PHA bins.
# Reduced chi-squared =          1.023 for     56 degrees of freedom
# Null hypothesis probability =   4.261634e-01

Photon flux (15-150 keV)    in 1 sec: 0.551207 ( -0.220781  0.221174 ) ph/cm2/s
Energy fluence (15-150 keV)             : 3.34464e-08 ( -1.92261e-08  1.50992e-08 ) ergs/cm2
Time-resolved spectra
Distribution
T90 vs. Hardness ratio plot
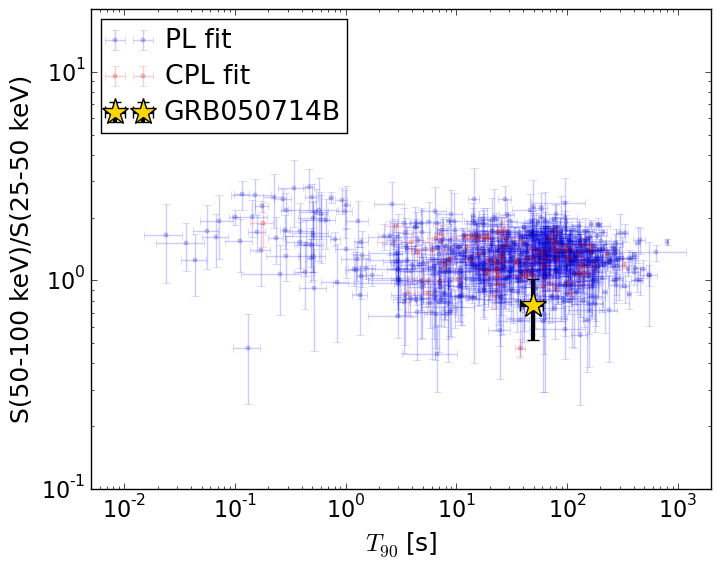
T90                                   = 49.364 sec.
Hardness ratio (energy fluence ratio) = 0.75976637044
S(15-50 keV) vs. S(50-150 keV) plot
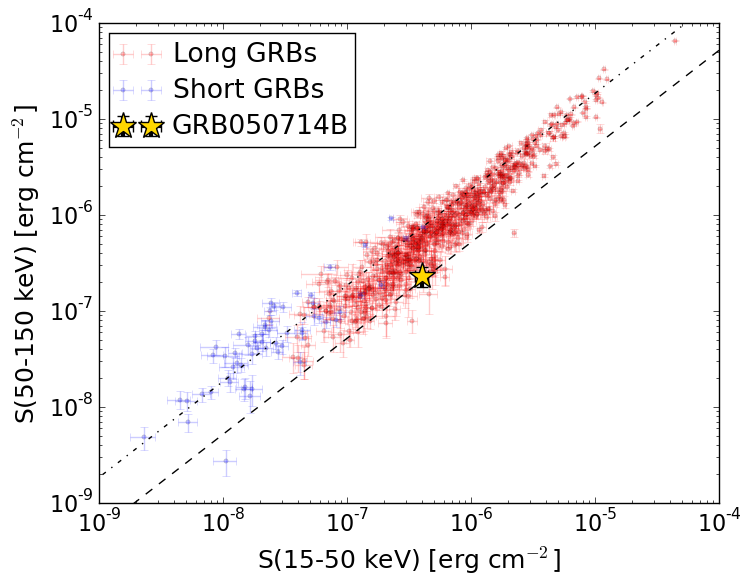
S(15-50 keV)  = 3.993864e-07
S(50-150 keV) = 2.3051592e-07
The dash-dotted line and the dashed line traces the fluences calculated from the Band function with Epeak = 15 and 150 keV, respectively. Both lines assume a canonical values of alpha = -1 and beta = -2.5.
Mask shadow pattern
IMX = -1.037486857582655E+00, IMY = 1.557545036574831E-01
Spacecraft aspect plot
Bright source in the pre-burst/pre-slew/post-slew images
Pre-burst image of 15-350 keV band
Time interval of the image:
-159.299400 -82.999600
-82.000000 13.492000

# RAcent  DECcent POSerr Theta    Phi  PeakCts   SNR AngSep     Name
#  [deg]    [deg]    ['] [deg]  [deg]                   [']
Pre-slew background subtracted image of 15-350 keV band
Time interval of the image:
13.492000 68.248000

# RAcent  DECcent POSerr Theta    Phi  PeakCts   SNR AngSep     Name
#  [deg]    [deg]    ['] [deg]  [deg]                   [']
216.8186  42.4002    2.8  29.0   39.9   0.3602   4.1 ------	UNKNOWN
169.6857 -15.5447    1.4  46.4 -171.5   1.0906   8.4 ------	UNKNOWN
Post-slew image of 15-350 keV band
Time interval of the image:
137.700600 303.047800

# RAcent  DECcent POSerr Theta    Phi  PeakCts   SNR AngSep     Name
#  [deg]    [deg]    ['] [deg]  [deg]                   [']
135.3561 -40.5859   66.9  38.9 -169.9   0.0288   0.2    8.1	Vela X-1
170.2992 -60.7195    5.0  45.2  146.7   0.8953   2.3    5.8	Cen X-3
182.7583 -60.8693    2.9  46.3  138.4   2.0378   4.0 ------	UNKNOWN
202.1198  32.1615    2.2  56.9   -0.1   4.0612   5.2 ------	UNKNOWN
184.2853  35.6777    2.4  53.0  -18.1   1.7173   4.8 ------	UNKNOWN