Analysis Summary
Notes:
- 1) No attempt has been made to eliminate the non-significant decimal places.
- 2) This batgrbproduct analysis is done using the HEASARC data.
- 3) This batgrbproduct analysis is using the flight position for the mask-weighting calculation.
======================================================================
BAT GRB EVENT DATA PROCESSING REPORT
Process Script Ver: batgrbproduct v2.46
Process Start Time: Wed Jan 22 21:32:50 EST 2014
Host Name: batevent1
Current Working Dir: /local/data/batevent/batevent_reproc/trigger146129
======================================================================
Trigger: 00146129 Segment: 000
BAT Trigger Time: 143159426.048 [s; MET]
Trigger Stop: 143159430.144 [s; MET]
UTC: 2005-07-15T22:30:26.424240 [includes UTCF correction]
Where From?: TDRSS position message
BAT
RA: 155.669314942153 Dec: -0.0590341924076137 [deg; J2000]
Catalogged Source?: NO
Point Source?: YES
GRB Indicated?: YES [ by BAT flight software ]
Image S/N Ratio: 9.08
Image Trigger?: NO
Rate S/N Ratio: 11.8321595661992 [ if not an image trigger ]
Image S/N Ratio: 9.08
Analysis Position: [ source = BAT ]
RA: 155.669314942153 Dec: -0.0590341924076137 [deg; J2000]
Refined Position: [ source = BAT pre-slew burst ]
RA: 155.64228118609 Dec: -0.0267825690351626 [deg; J2000]
{ 10h 22m 34.1s , -00d 01' 36.4" }
+/- 1.3668130249648 [arcmin] (estimated 90% radius based on SNR)
+/- 0.627240573879364 [arcmin] (formal 1-sigma fit error)
SNR: 19.46472286326
Angular difference between the analysis and refined position is 2.524988 arcmin
Partial Coding Fraction: 0.734375 [ including projection effects ]
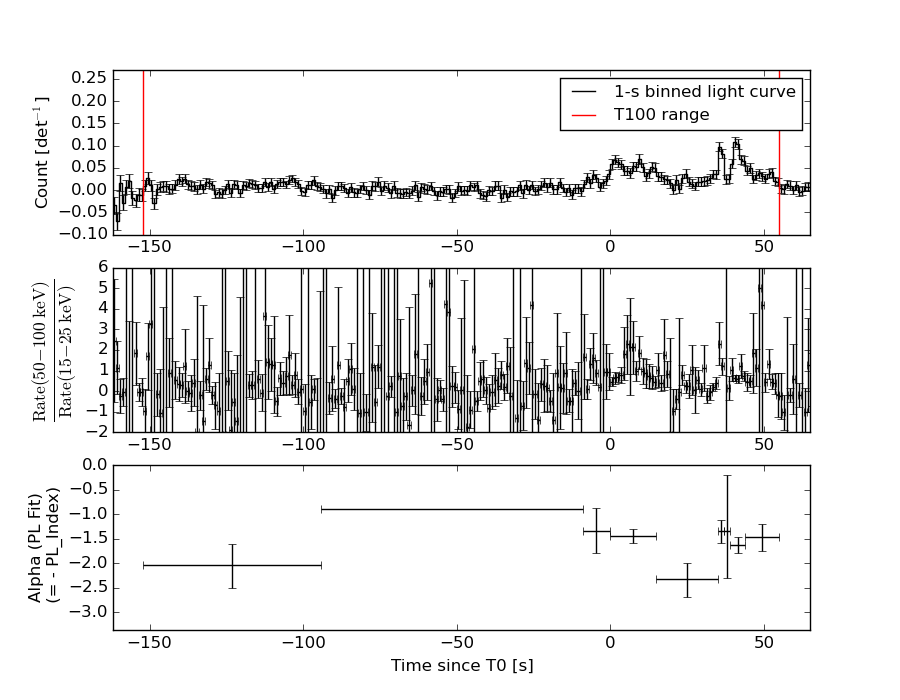
Duration
T90: 187 +/- 21.5870331449229
Measured from: -138.048000007868
to: 48.9519999921322 [s; relative to TRIGTIME]
T50: 44 +/- 69.1158447825099
Measured from: -5.04800000786781
to: 38.9519999921322 [s; relative to TRIGTIME]
Fluence
Peak Flux (peak 1 second)
Measured from: 39.9519999921322
to: 40.9519999921322 [s; relative to TRIGTIME]
Total Fluence
Measured from: -152.048000007868
to: 54.9519999921322 [s; relative to TRIGTIME]
Band 1 Band 2 Band 3 Band 4
15-25 25-50 50-100 100-350 keV
Total 0.995077 1.113695 0.723864 0.216974
0.073628 0.076948 0.068437 0.063416 [error]
Peak 0.040132 0.043785 0.025482 -0.000746
0.005668 0.005823 0.005330 0.004441 [error]
[ fluence units of on-axis counts / fully illuminated detector ]
======================================================================
====== Table of the duration information =============================
Value tstart tstop
T100 207.000 -152.048 54.952
T90 187.000 -138.048 48.952
T50 44.000 -5.048 38.952
Peak 1.000 39.952 40.952
====== Spectral Analysis Summary =====================================
Model : spectral model: simple power-law (PL) and cutoff power-law (CPL)
Ph_index : photon index: E^{Ph_index}
Ph_90err : 90% error of the photon index
Epeak : Epeak in keV
Epeak_90err: 90% error of Epeak
Norm : normalization at 50 keV in both the PL model and CPL model
Nomr_90err : 90% error of the normalization
chi2 : Chi-Squared
dof : degree of freedo
=== Time-averaged spectral analysis ===
(Best model with acceptable fit: PL)
Model Ph_index Ph_90err_low Ph_90err_hi Epeak Epeak_90err_low Epeak_90err_hi Norm Nomr_90err_low Norm_90err_hi chi2 dof
PL -1.658 -0.148 0.146 - - - 9.10e-04 -7.74e-05 7.63e-05 40.830 57
CPL -1.663 -0.589 0.287 9999.360 N/A N/A 9.08e-04 N/A N/A 40.850 56
=== 1-s peak spectral analysis ===
(Best model with acceptable fit: N/A)
Model Ph_index Ph_90err_low Ph_90err_hi Epeak Epeak_90err_low Epeak_90err_hi Norm Nomr_90err_low Norm_90err_hi chi2 dof
PL -1.781 -0.295 0.277 - - - 6.37e-03 -1.23e-03 1.19e-03 71.130 57
CPL -1.135 -1.034 1.400 56.561 -48.932 -56.561 1.50e-02 -9.56e-03 8.41e-02 70.060 56
=== Fluence/Peak Flux Summary ===
Model Band1 Band2 Band3 Band4 Band5 Total
15-25 25-50 50-100 100-350 15-150 15-350 keV
Fluence PL 2.79e-07 4.66e-07 5.90e-07 1.50e-06 1.75e-06 2.83e-06 erg/cm2
90%_error_low -3.48e-08 -3.59e-08 -6.91e-08 -3.40e-07 -1.59e-07 -4.04e-07 erg/cm2
90%_error_hi 3.59e-08 3.59e-08 6.92e-08 4.05e-07 1.61e-07 4.57e-07 erg/cm2
Peak flux PL 3.44e-01 2.93e-01 1.71e-01 1.48e-01 8.72e-01 9.56e-01 ph/cm2/s
90%_error_low -7.69e-02 -4.61e-02 -4.22e-02 -6.06e-02 -1.37e-01 -1.55e-01 ph/cm2/s
90%_error_hi 8.02e-02 4.61e-02 4.30e-02 8.22e-02 1.37e-01 1.57e-01 ph/cm2/s
Fluence CPL 2.79e-07 4.60e-07 5.89e-07 1.84e-06 1.78e-06 2.82e-06 erg/cm2
90%_error_low -3.49e-08 N/A N/A N/A -1.91e-07 -6.58e-07 erg/cm2
90%_error_hi 3.59e-08 N/A N/A N/A 1.28e-07 4.15e-07 erg/cm2
Peak flux CPL 3.23e-01 3.17e-01 1.70e-01 6.20e-02 8.51e-01 8.71e-01 ph/cm2/s
90%_error_low -8.71e-02 -6.21e-02 -5.08e-02 -6.20e-02 -1.41e-01 -1.54e-01 ph/cm2/s
90%_error_hi 8.75e-02 6.29e-02 4.76e-02 1.11e-01 1.41e-01 1.97e-01 ph/cm2/s
======================================================================
Image
Pre-slew 15.0-350.0 keV image (Event data)
#   RAcent    DECcent   POSerr    Theta     Phi              Peak Cts       SNR   Name
  155.6423    -0.0268   0.0099    20.7989   -76.4775         2.4420073     19.465 TRIG_00146129

Foreground time interval of the image:
-73.147  54.952 (delta_t = 128.099 [sec])
Background time interval of the image:
Light Curves
Note: The mask-weighted lightcurves have units of either count/det or counts/sec/det, where a det is 0.4 x 0.4 = 0.16 sq cm.
Full-time range; 1 s binning
Other quick-look light curves:
- 64 ms binning (zoomed)
- 16 ms binning (zoomed)
- 8 ms binning (zoomed)
- 2 ms binning (zoomed)
- SN=5 or 10 s binning (full-time range)
- Raw light curve
Spectra
- 64 ms binning (zoomed)
- 16 ms binning (zoomed)
- 8 ms binning (zoomed)
- 2 ms binning (zoomed)
- SN=5 or 10 s binning (full-time range)
- Raw light curve
Spectra
Notes:
- 1) The fitting includes the systematic errors.
- 2) When the burst includes telescope slew time periods, the fitting uses an average response file made from multiple 5-s response files through out the slew time plus single time preiod for the non-slew times, and weighted by the total counts in the corresponding time period using addrmf. An average response file is needed becuase a spectral fit using the pre-slew DRM will introduce some errors in both a spectral shape and a normalization if the PHA file contains a lot of the slew/post-slew time interval.
- 3) For fits to more complicated models (e.g. a power-law over a cutoff power-law), the BAT team has decided to require a chi-square improvement of more than 6 for each extra dof.
Time averaged spectrum fit using the average DRM
Power-law model
Time interval is from -152.048 sec. to   54.952 sec.

Spectral model in power-law:
------------------------------------------------------------
Parameters  : value       lower 90%   higher 90%
Photon index: -1.65796     ( -0.148025   0.145915 )
Norm@50keV  : 9.10084E-04    ( -7.7398e-05   7.63475e-05 )
------------------------------------------------------------
#Fit statistic : Chi-Squared =          40.83 using 59 PHA bins.
# Reduced chi-squared =         0.7163 for     57 degrees of freedom
# Null hypothesis probability =   9.477576e-01

Photon flux (15-150 keV)    in 207 sec: 0.119153 ( -0.00919  0.009201 ) ph/cm2/s
Energy fluence (15-150 keV)             : 1.75094e-06 ( -1.58726e-07  1.61074e-07 ) ergs/cm2
Cutoff power-law model
Time interval is from -152.048 sec. to   54.952 sec.
Spectral model in the cutoff power-law:
------------------------------------------------------------
Parameters  : value       lower 90%   higher 90%
Photon index: -2.17765     ( -0.0746556   0.801248 )
Epeak [keV] : 67.9356      (   )
Norm@50keV  : 4.92504E-04    (     )
------------------------------------------------------------
#Fit statistic : Chi-Squared =          40.57 using 59 PHA bins.
# Reduced chi-squared =         0.7244 for     56 degrees of freedom
# Null hypothesis probability =   9.399471e-01

Photon flux (15-150 keV)    in 207 sec: 0.120290 ( -0.010339  0.008053 ) ph/cm2/s
Energy fluence (15-150 keV)             : 1.78304e-06 ( -1.91378e-07  1.28401e-07 ) ergs/cm2
1-s peak spectrum fit
Power-law model
Time interval is from   39.952 sec. to   40.952 sec.

Spectral model in power-law:
------------------------------------------------------------
Parameters  : value       lower 90%   higher 90%
Photon index: -1.7807     ( -0.295139   0.27725 )
Norm@50keV  : 6.37436E-03    ( -0.001228   0.0011925 )
------------------------------------------------------------
#Fit statistic : Chi-Squared =          71.13 using 59 PHA bins.
# Reduced chi-squared =          1.248 for     57 degrees of freedom
# Null hypothesis probability =   9.878573e-02

Photon flux (15-150 keV)    in 1 sec: 0.871932 ( -0.137018  0.137018 ) ph/cm2/s
Energy fluence (15-150 keV)             : 5.87368e-08 ( -1.13323e-08  1.17358e-08 ) ergs/cm2
Cutoff power-law model
Time interval is from   39.952 sec. to   40.952 sec.
Spectral model in the cutoff power-law:
------------------------------------------------------------
Parameters  : value       lower 90%   higher 90%
Photon index: -1.13475     ( -1.03444   1.4005 )
Epeak [keV] : 56.5608      ( -48.9316 -56.5608 )
Norm@50keV  : 1.49983E-02    ( -0.00955667   0.0840506 )
------------------------------------------------------------
#Fit statistic : Chi-Squared =          70.06 using 59 PHA bins.
# Reduced chi-squared =          1.251 for     56 degrees of freedom
# Null hypothesis probability =   9.805894e-02

Photon flux (15-150 keV)    in 1 sec: 0.851414 ( -0.140652  0.1409 ) ph/cm2/s
Energy fluence (15-150 keV)             : 5.45884e-08 ( -1.25128e-08  1.34478e-08 ) ergs/cm2
Time-resolved spectra
Distribution
T90 vs. Hardness ratio plot
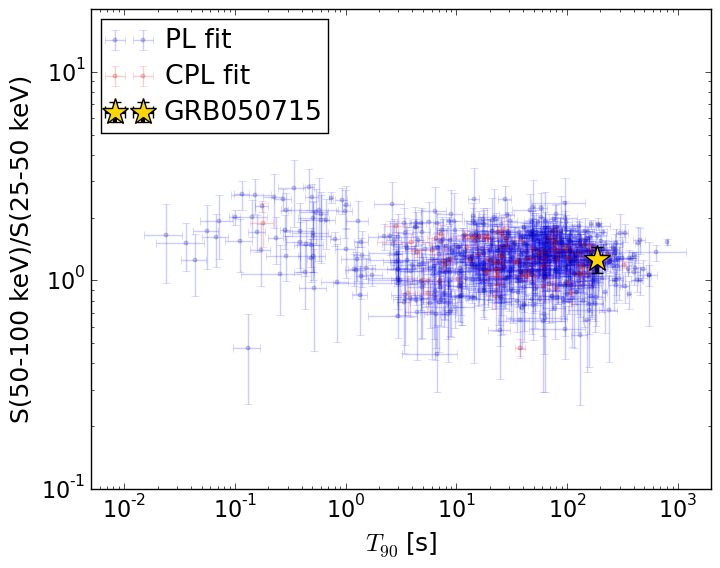
T90                                   = 187.0 sec.
Hardness ratio (energy fluence ratio) = 1.26756404221
S(15-50 keV) vs. S(50-150 keV) plot
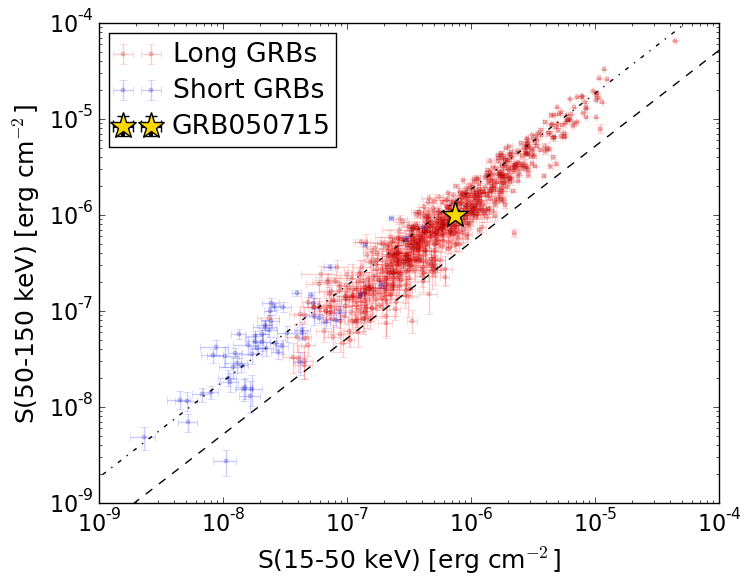
S(15-50 keV)  = 7.446976e-07
S(50-150 keV) = 1.0062435e-06
The dash-dotted line and the dashed line traces the fluences calculated from the Band function with Epeak = 15 and 150 keV, respectively. Both lines assume a canonical values of alpha = -1 and beta = -2.5.
Mask shadow pattern
IMX = 8.881739870735185E-02, IMY = 3.693123778236507E-01
Spacecraft aspect plot
Bright source in the pre-burst/pre-slew/post-slew images
Pre-burst image of 15-350 keV band
Time interval of the image:
Pre-slew background subtracted image of 15-350 keV band
Time interval of the image:
-73.147400 54.952000

# RAcent  DECcent POSerr Theta    Phi  PeakCts   SNR AngSep     Name
#  [deg]    [deg]    ['] [deg]  [deg]                   [']
135.5571 -40.5675    2.3  38.8 -170.3   0.7486   5.1    1.5	Vela X-1
170.1517 -60.6468    4.5  45.1  146.4   0.8015   2.5    5.0	Cen X-3
134.7994 -64.1533    2.6  54.2  164.7   2.4622   4.5 ------	UNKNOWN
201.9929  25.8735    2.3  51.9    4.4   1.5868   5.0 ------	UNKNOWN
124.8658 -46.0112    2.6  48.2 -172.2   0.8956   4.4 ------	UNKNOWN
155.6422  -0.0268    0.6  20.8  -76.5   2.4408  19.5 ------	UNKNOWN
Post-slew image of 15-350 keV band
Time interval of the image:
-299.048000 302.982500

# RAcent  DECcent POSerr Theta    Phi  PeakCts   SNR AngSep     Name
#  [deg]    [deg]    ['] [deg]  [deg]                   [']
135.5293 -40.5307    2.2  38.8 -170.3   2.0013   5.3    1.4	Vela X-1
169.9306 -60.6494    4.2  45.2  146.6   2.4685   2.7   11.4	Cen X-3
187.2392 -23.5969    3.6  18.4   85.6   0.9447   3.2 ------	UNKNOWN
155.6105  -0.0109    1.5  20.8  -76.5   2.5744   7.8 ------	UNKNOWN
165.4564  23.4044    2.7  39.1  -39.5   1.9134   4.3 ------	UNKNOWN
111.2478 -26.7376    5.0  55.2 -145.3   4.8600   2.3 ------	UNKNOWN
133.0447   3.8790    3.5  41.1  -98.2   5.8000   3.3 ------	UNKNOWN