Analysis Summary
Notes:
- 1) No attempt has been made to eliminate the non-significant decimal places.
- 2) This batgrbproduct analysis is done using the HEASARC data.
- 3) This batgrbproduct analysis is using the flight position for the mask-weighting calculation.
======================================================================
                  BAT GRB EVENT DATA PROCESSING REPORT
    Process Script Ver: batgrbproduct v2.46
    Process Start Time: Wed Jan 22 21:29:59 EST 2014
             Host Name: batevent1
   Current Working Dir: /local/data/batevent/batevent_reproc/trigger146227
======================================================================

  Trigger: 00146227      Segment: 000

  BAT Trigger Time: 143210163.264   [s; MET]
      Trigger Stop: 143210165.312   [s; MET]
               UTC: 2005-07-16T12:36:03.639280    [includes UTCF correction]
       Where From?: TDRSS position message

  BAT
    RA: 338.597596475194   Dec: 38.6960690450086  [deg; J2000]

     Catalogged Source?: NO
     Point Source?:      YES
     GRB Indicated?:     YES    [ by BAT flight software ]
     Image S/N Ratio:    8
     Image Trigger?:     NO
     Rate S/N Ratio:     9.38083151964686  [ if not an image trigger ]
     Image S/N Ratio:    8

  Analysis Position:   [ source = BAT ]
    RA: 338.597596475194   Dec: 38.6960690450086  [deg; J2000]

  Refined Position:   [ source = BAT pre-slew burst ]
    RA: 338.594337878481   Dec: 38.6846567074294  [deg; J2000]
        { 22h 34m 22.6s , +38d 41' 04.8" }
         +/- 1.03431979783523 [arcmin] (estimated 90% radius based on SNR)
         +/- 0.363424505934964 [arcmin] (formal 1-sigma fit error)
    SNR: 28.9856402513656

  Angular difference between the analysis and refined position is 0.701540 arcmin

  Partial Coding Fraction: 0.2304688    [ including projection effects ]

  Duration
     T90: 69.0200000107288 +/- 5.28801364282444
        Measured from: -8.34799998998642
                   to: 60.6720000207424     [s; relative to TRIGTIME]
     T50: 35.4240000247955 +/- 2.01619441985393
        Measured from: 5.24799999594688
                   to: 40.6720000207424     [s; relative to TRIGTIME]


  Fluence
     Peak Flux  (peak 1 second)
        Measured from: 12.2199999988079
                   to: 13.2199999988079     [s; relative to TRIGTIME]
     Total Fluence
        Measured from: -13.6759999990463
                   to: 76.3880000114441     [s; relative to TRIGTIME]

             Band 1     Band 2     Band 3     Band 4
              15-25      25-50     50-100    100-350     keV
 Total     1.898998   3.328691   2.973365   0.818287
           0.102201   0.104854   0.090755   0.072139 [error]
 Peak      0.056977   0.098305   0.077562   0.029747
           0.012744   0.014055   0.011910   0.008729 [error]

     [ fluence units of on-axis counts / fully illuminated detector ]

======================================================================


====== Table of the duration information =============================

        Value   tstart    tstop
T100   90.064  -13.676   76.388
T90    69.020   -8.348   60.672
T50    35.424    5.248   40.672
Peak    1.000   12.220   13.220


====== Spectral Analysis Summary =====================================

Model      : spectral model: simple power-law (PL) and cutoff power-law (CPL)
Ph_index   : photon index: E^{Ph_index}
Ph_90err   : 90% error of the photon index
Epeak      : Epeak in keV
Epeak_90err: 90% error of Epeak
Norm       : normalization at 50 keV in both the PL model and CPL model
Nomr_90err : 90% error of the normalization
chi2       : Chi-Squared
dof        : degree of freedo

=== Time-averaged spectral analysis ===
(Best model with acceptable fit: CPL)

Model Ph_index Ph_90err_low Ph_90err_hi  Epeak  Epeak_90err_low  Epeak_90err_hi  Norm       Nomr_90err_low    Norm_90err_hi    chi2    dof
PL      -1.340    -0.060      0.061       -           -               -         7.18e-03     -2.49e-04          2.49e-04      58.350   57
CPL     -0.789    -0.254      0.270      122.331     -22.908        55.537      1.28e-02     -2.92e-03          4.04e-03      43.730   56


=== 1-s peak spectral analysis ===
(Best model with acceptable fit: PL)

Model Ph_index Ph_90err_low Ph_90err_hi  Epeak  Epeak_90err_low  Epeak_90err_hi  Norm       Nomr_90err_low    Norm_90err_hi    chi2    dof
PL      -1.411     -0.248     0.252       -           -               -         1.74e-02     -2.71e-03          2.70e-03      46.000   57
CPL     -0.942     -0.813     1.114      116.278     -52.424      -116.278      3.00e-02     -1.48e-02          7.49e-02      45.240   56


=== Fluence/Peak Flux Summary ===

              Model    Band1     Band2     Band3     Band4     Band5     Total
                       15-25     25-50    50-100    100-350    15-150    15-350    keV
Fluence         PL   7.11e-07  1.44e-06  2.28e-06  7.97e-06  6.33e-06  1.24e-05   erg/cm2
      90%_error_low -4.85e-08 -5.95e-08 -9.03e-08 -6.87e-07 -2.29e-07 -7.38e-07   erg/cm2
      90%_error_hi   4.96e-08  5.93e-08  9.01e-08  7.30e-07  2.29e-07  7.73e-07   erg/cm2
Peak flux       PL   6.59e-01  6.99e-01  5.26e-01  6.42e-01  2.13e+00  2.52e+00   ph/cm2/s
      90%_error_low -1.74e-01 -1.23e-01 -9.52e-02 -2.06e-01 -3.44e-01 -3.93e-01   ph/cm2/s
      90%_error_hi   1.86e-01  1.21e-01  9.38e-02  2.56e-01  3.45e-01  3.95e-01   ph/cm2/s

Fluence        CPL   6.23e-07  1.49e-06  2.40e-06  4.11e-06  6.15e-06  8.63e-06   erg/cm2
      90%_error_low -6.04e-08 -6.63e-08 -1.07e-07 -9.79e-07 -2.46e-07 -9.90e-07   erg/cm2
      90%_error_hi   6.18e-08  6.68e-08  1.08e-07  1.37e-06  2.45e-07  1.36e-06   erg/cm2
Peak flux      CPL   6.06e-01  7.34e-01  5.54e-01  3.93e-01  2.10e+00  2.29e+00   ph/cm2/s
      90%_error_low -2.00e-01 -1.41e-01 -1.09e-01 -2.45e-01 -3.47e-01 -4.38e-01   ph/cm2/s
      90%_error_hi   2.10e-01  1.48e-01  1.14e-01  3.34e-01  3.48e-01  5.03e-01   ph/cm2/s

======================================================================
Image
Pre-slew 15.0-350.0 keV image (Event data)

#   RAcent    DECcent   POSerr    Theta     Phi              Peak Cts       SNR   Name
  338.5943    38.6847   0.0066    39.1591    42.6777         5.6777049     28.986 TRIG_00146227

Foreground time interval of the image:
-13.676  30.037 (delta_t =  43.713 [sec])
Background time interval of the image:
-299.264 -13.676 (delta_t = 285.588 [sec])
Light Curves
Note: The mask-weighted lightcurves have units of either count/det or counts/sec/det, where a det is 0.4 x 0.4 = 0.16 sq cm.
Full-time range; 1 s binning
Other quick-look light curves:
- 64 ms binning (zoomed)
- 16 ms binning (zoomed)
- 8 ms binning (zoomed)
- 2 ms binning (zoomed)
- SN=5 or 10 s binning (full-time range)
- Raw light curve
Spectra
- 64 ms binning (zoomed)
- 16 ms binning (zoomed)
- 8 ms binning (zoomed)
- 2 ms binning (zoomed)
- SN=5 or 10 s binning (full-time range)
- Raw light curve
Spectra
Notes:
- 1) The fitting includes the systematic errors.
- 2) When the burst includes telescope slew time periods, the fitting uses an average response file made from multiple 5-s response files through out the slew time plus single time preiod for the non-slew times, and weighted by the total counts in the corresponding time period using addrmf. An average response file is needed becuase a spectral fit using the pre-slew DRM will introduce some errors in both a spectral shape and a normalization if the PHA file contains a lot of the slew/post-slew time interval.
- 3) For fits to more complicated models (e.g. a power-law over a cutoff power-law), the BAT team has decided to require a chi-square improvement of more than 6 for each extra dof.
Time averaged spectrum fit using the average DRM
Power-law model
Time interval is from  -13.676 sec. to   76.388 sec.

Spectral model in power-law:
------------------------------------------------------------
Parameters  : value       lower 90%   higher 90%
Photon index: -1.34036     ( -0.060376   0.0607487 )
Norm@50keV  : 7.18035E-03    ( -0.000248932   0.000248859 )
------------------------------------------------------------
#Fit statistic : Chi-Squared =          58.35 using 59 PHA bins.
# Reduced chi-squared =          1.024 for     57 degrees of freedom
# Null hypothesis probability =   4.254947e-01

Photon flux (15-150 keV)    in 90.06 sec: 0.863339 ( -0.032574  0.032657 ) ph/cm2/s
Energy fluence (15-150 keV)             : 6.33041e-06 ( -2.28552e-07  2.28809e-07 ) ergs/cm2
Cutoff power-law model
Time interval is from  -13.676 sec. to   76.388 sec.
Spectral model in the cutoff power-law:
------------------------------------------------------------
Parameters  : value       lower 90%   higher 90%
Photon index: -0.788979     ( -0.254423   0.270334 )
Epeak [keV] : 122.331      ( -22.908 55.5365 )
Norm@50keV  : 1.28050E-02    ( -0.00292424   0.00403891 )
------------------------------------------------------------
#Fit statistic : Chi-Squared =          43.73 using 59 PHA bins.
# Reduced chi-squared =         0.7809 for     56 degrees of freedom
# Null hypothesis probability =   8.835406e-01

Photon flux (15-150 keV)    in 90.06 sec: 0.837389 ( -0.034449  0.034534 ) ph/cm2/s
Energy fluence (15-150 keV)             : 6.14953e-06 ( -2.45863e-07  2.45048e-07 ) ergs/cm2
1-s peak spectrum fit
Power-law model
Time interval is from   12.220 sec. to   13.220 sec.

Spectral model in power-law:
------------------------------------------------------------
Parameters  : value       lower 90%   higher 90%
Photon index: -1.41115     ( -0.248371   0.252059 )
Norm@50keV  : 1.74255E-02    ( -0.00270609   0.00270165 )
------------------------------------------------------------
#Fit statistic : Chi-Squared =          46.00 using 59 PHA bins.
# Reduced chi-squared =         0.8070 for     57 degrees of freedom
# Null hypothesis probability =   8.511634e-01

Photon flux (15-150 keV)    in 1 sec: 2.12757 ( -0.34373  0.34474 ) ph/cm2/s
Energy fluence (15-150 keV)             : 1.6802e-07 ( -2.77612e-08  2.7896e-08 ) ergs/cm2
Cutoff power-law model

Time interval is from   12.220 sec. to   13.220 sec.
Spectral model in the cutoff power-law:
------------------------------------------------------------
Parameters  : value       lower 90%   higher 90%
Photon index: -0.941502     ( -0.812614   1.11383 )
Epeak [keV] : 116.278      ( -52.4259 -116.28 )
Norm@50keV  : 2.99875E-02    ( -0.014787   0.0749501 )
------------------------------------------------------------
#Fit statistic : Chi-Squared =          45.24 using 59 PHA bins.
# Reduced chi-squared =         0.8079 for     56 degrees of freedom
# Null hypothesis probability =   8.475965e-01

Photon flux (15-150 keV)    in 1 sec: 2.10474 ( -0.34733  0.34795 ) ph/cm2/s
Energy fluence (15-150 keV)             : 1.64384e-07 ( -2.9295e-08  2.89686e-08 ) ergs/cm2
Time-resolved spectra

Distribution
T90 vs. Hardness ratio plot

T90                                   = 69.02 sec.
Hardness ratio (energy fluence ratio) = 1.60457457938
S(15-50 keV) vs. S(50-150 keV) plot
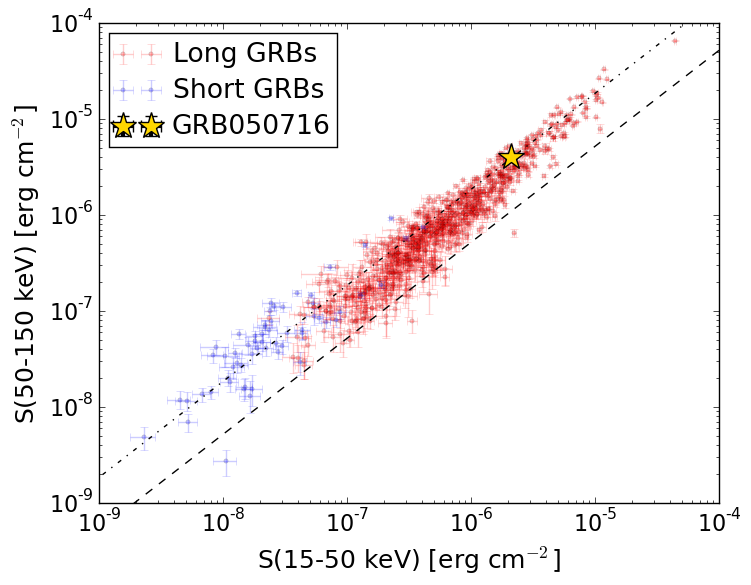
S(15-50 keV)  = 2.1172885e-06
S(50-150 keV) = 4.032199e-06
The dash-dotted line and the dashed line traces the fluences calculated from the Band function with Epeak = 15 and 150 keV, respectively. Both lines assume a canonical values of alpha = -1 and beta = -2.5.
Mask shadow pattern
IMX = 5.987233751923549E-01, IMY = -5.520548339040845E-01
Spacecraft aspect plot
Bright source in the pre-burst/pre-slew/post-slew images
Pre-burst image of 15-350 keV band
Time interval of the image:
-299.264000 -13.676000

# RAcent  DECcent POSerr Theta    Phi  PeakCts   SNR AngSep     Name
#  [deg]    [deg]    ['] [deg]  [deg]                   [']
308.1998  40.7858    7.6  36.6   80.9   0.9171   1.5   10.8	Cyg X-3
326.1587  38.3041   40.1  38.8   58.2   0.1764   0.3    1.2	Cyg X-2
  9.0027  61.7834    3.4  21.7   -7.8   0.7329   3.4 ------	UNKNOWN
 95.6953  74.9287    2.9  25.9  -89.9   1.0925   3.9 ------	UNKNOWN
 69.5988  49.8086    3.0  45.8  -56.5   4.1784   3.8 ------	UNKNOWN
Pre-slew background subtracted image of 15-350 keV band
Time interval of the image:
-13.676000 30.036580

# RAcent  DECcent POSerr Theta    Phi  PeakCts   SNR AngSep     Name
#  [deg]    [deg]    ['] [deg]  [deg]                   [']
308.3222  41.0715    0.0  36.4   80.8   0.2240   1.0   12.0	Cyg X-3
326.0374  38.2134   10.1  38.9   58.3   0.2822   1.1    9.1	Cyg X-2
338.5944  38.6847    0.4  39.2   42.7   5.6766  29.0 ------	UNKNOWN
359.4052  66.3542    2.2  15.7   -3.3   0.4044   5.2 ------	UNKNOWN
Post-slew image of 15-350 keV band
Time interval of the image:
85.436600 302.787000

# RAcent  DECcent POSerr Theta    Phi  PeakCts   SNR AngSep     Name
#  [deg]    [deg]    ['] [deg]  [deg]                   [']
299.6067  35.1851    0.6  31.1  144.3   5.2865  20.7    1.3	Cyg X-1
308.1175  40.9616    1.2  23.4  153.8   1.8893   9.8    0.6	Cyg X-3
325.9104  38.2809    0.0   9.9  140.1  -0.2520  -1.6   12.5	Cyg X-2
255.2353  57.8840    3.1  54.7 -171.8   2.3228   3.8 ------	UNKNOWN
331.3209  58.3015    2.8  20.2 -142.7   0.6440   4.1 ------	UNKNOWN