Analysis Summary
Notes:
- 1) No attempt has been made to eliminate the non-significant decimal places.
- 2) This batgrbproduct analysis is done using the HEASARC data.
- 3) This batgrbproduct analysis is using the flight position for the mask-weighting calculation.
======================================================================
                  BAT GRB EVENT DATA PROCESSING REPORT
    Process Script Ver: batgrbproduct v2.46
    Process Start Time: Wed Jan 22 21:26:44 EST 2014
             Host Name: batevent1
   Current Working Dir: /local/data/batevent/batevent_reproc/trigger146372
======================================================================

  Trigger: 00146372      Segment: 000

  BAT Trigger Time: 143289051.92   [s; MET]
      Trigger Stop: 143289051.984   [s; MET]
               UTC: 2005-07-17T10:30:52.293760    [includes UTCF correction]
       Where From?: (*SHORT BURST*) TDRSS scaled map message

  BAT
    RA: 214.331859623212   Dec: -50.5394150035486  [deg; J2000]

     Catalogged Source?: NO
     Point Source?:      YES
     GRB Indicated?:     YES    [ by BAT flight software ]
     Image S/N Ratio:    8.53
     Image Trigger?:     NO
     Rate S/N Ratio:     15.556349186104  [ if not an image trigger ]
     Image S/N Ratio:    8.53

  Analysis Position:   [ source = BAT ]
    RA: 214.331859623212   Dec: -50.5394150035486  [deg; J2000]

  Refined Position:   [ source = BAT pre-slew burst ]
    RA: 214.354532915211   Dec: -50.5414526184418  [deg; J2000]
        { 14h 17m 25.1s , -50d 32' 29.2" }
         +/- 0.680693708432702 [arcmin] (estimated 90% radius based on SNR)
         +/- 0.230425168592094 [arcmin] (formal 1-sigma fit error)
    SNR: 52.6937075070917

  Angular difference between the analysis and refined position is 0.873179 arcmin

  Partial Coding Fraction: 0.46875    [ including projection effects ]

  Duration
     T90: 85.0160000026226 +/- 18.8967468076688
        Measured from: 2.84800001978874
                   to: 87.8640000224113     [s; relative to TRIGTIME]
     T50: 27.3840000033379 +/- 2.1515166673899
        Measured from: 6.91600000858307
                   to: 34.3000000119209     [s; relative to TRIGTIME]


  Fluence
     Peak Flux  (peak 1 second)
        Measured from: 2.70400002598763
                   to: 3.70400002598763     [s; relative to TRIGTIME]
     Total Fluence
        Measured from: -0.015999972820282
                   to: 209.152000010014     [s; relative to TRIGTIME]

             Band 1     Band 2     Band 3     Band 4
              15-25      25-50     50-100    100-350     keV
 Total     2.159728   3.295414   2.935660   0.957185
           0.077261   0.076779   0.067059   0.055870 [error]
 Peak      0.143072   0.258371   0.266664   0.099012
           0.009932   0.011332   0.011809   0.009841 [error]

     [ fluence units of on-axis counts / fully illuminated detector ]

======================================================================


====== Table of the duration information =============================

        Value   tstart    tstop
T100  209.168   -0.016  209.152
T90    85.016    2.848   87.864
T50    27.384    6.916   34.300
Peak    1.000    2.704    3.704


====== Spectral Analysis Summary =====================================

Model      : spectral model: simple power-law (PL) and cutoff power-law (CPL)
Ph_index   : photon index: E^{Ph_index}
Ph_90err   : 90% error of the photon index
Epeak      : Epeak in keV
Epeak_90err: 90% error of Epeak
Norm       : normalization at 50 keV in both the PL model and CPL model
Nomr_90err : 90% error of the normalization
chi2       : Chi-Squared
dof        : degree of freedo

=== Time-averaged spectral analysis ===
(Best model with acceptable fit: PL)

Model Ph_index Ph_90err_low Ph_90err_hi  Epeak  Epeak_90err_low  Epeak_90err_hi  Norm       Nomr_90err_low    Norm_90err_hi    chi2    dof
PL      -1.286    -0.051      0.051       -           -               -         3.06e-03     -8.21e-05          8.19e-05      60.620   57
CPL     -1.285    -0.049      0.097     9999.360    -9999.360      -9999.360      3.07e-03     -8.00e-05          3.58e-04      60.700   56


=== 1-s peak spectral analysis ===
(Best model with acceptable fit: N/A)

Model Ph_index Ph_90err_low Ph_90err_hi  Epeak  Epeak_90err_low  Epeak_90err_hi  Norm       Nomr_90err_low    Norm_90err_hi    chi2    dof
PL      -1.068     -0.086     0.087       -           -               -         5.40e-02     -2.54e-03          2.54e-03      57.350   57
CPL     -1.064     -0.085     0.089     9999.350    -9999.350      -9999.350      5.43e-02     -2.53e-03          1.42e-02      57.380   56


=== Fluence/Peak Flux Summary ===

              Model    Band1     Band2     Band3     Band4     Band5     Total
                       15-25     25-50    50-100    100-350    15-150    15-350    keV
Fluence         PL   6.69e-07  1.40e-06  2.30e-06  8.51e-06  6.34e-06  1.29e-05   erg/cm2
      90%_error_low -3.90e-08 -4.75e-08 -6.90e-08 -6.00e-07 -1.74e-07 -6.26e-07   erg/cm2
      90%_error_hi   3.99e-08  4.73e-08  6.88e-08  6.33e-07  1.74e-07  6.53e-07   erg/cm2
Peak flux       PL   4.39e-04  5.35e-03  6.85e-02  6.03e+00  3.10e-01  6.08e+00   ph/cm2/s
      90%_error_low     N/A       N/A   -2.38e-03 -2.68e-01 -1.05e-02 -2.51e-01   ph/cm2/s
      90%_error_hi      N/A       N/A    7.08e-03  3.90e-01  3.11e-02  4.24e-01   ph/cm2/s

Fluence        CPL   6.68e-07  1.40e-06  2.28e-06  8.70e-06  6.37e-06  1.28e-05   erg/cm2
      90%_error_low    N/A       N/A       N/A       N/A    -2.04e-07 -1.20e-06   erg/cm2
      90%_error_hi     N/A       N/A       N/A       N/A     1.44e-07  6.20e-07   erg/cm2
Peak flux      CPL   1.50e+00  1.91e+00  1.81e+00  3.08e+00  6.27e+00  8.59e+00   ph/cm2/s
      90%_error_low -2.00e-01 -1.05e-01 -8.98e-02     N/A   -3.27e-01 -1.12e+00   ph/cm2/s
      90%_error_hi   1.33e-01  1.21e-01  1.33e-01     N/A    2.77e-01  1.43e-01   ph/cm2/s

======================================================================
Image
Pre-slew 15.0-350.0 keV image (Event data)
#   RAcent    DECcent   POSerr    Theta     Phi              Peak Cts       SNR   Name
  214.3545   -50.5415   0.0037    35.9946   155.8359         2.9405263     52.694 TRIG_00146372

Foreground time interval of the image:
 -0.016   8.581 (delta_t =   8.597 [sec])
Background time interval of the image:
-299.920  -0.016 (delta_t = 299.904 [sec])
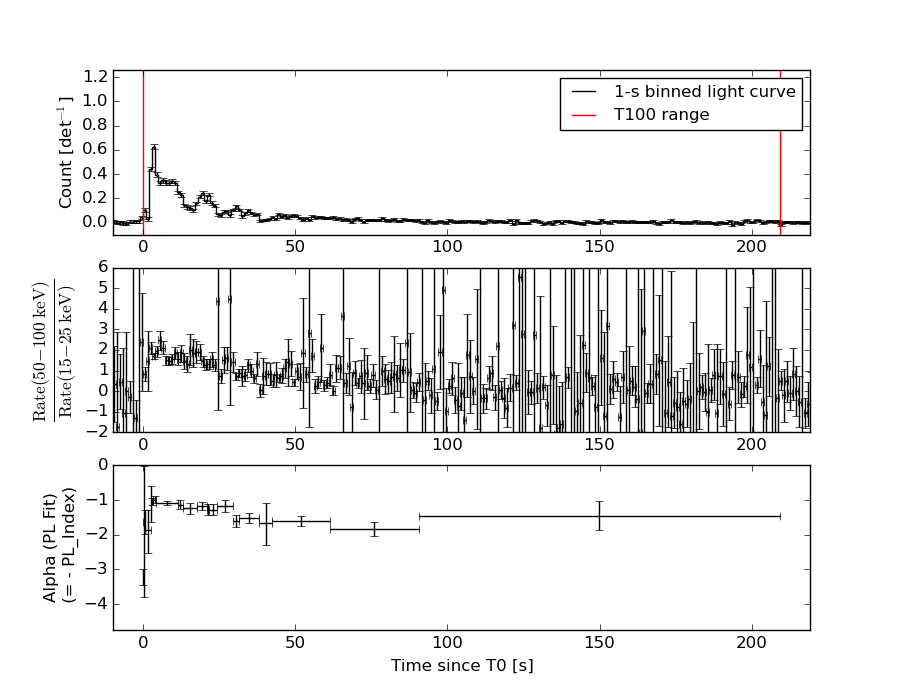
Light Curves
Note: The mask-weighted lightcurves have units of either count/det or counts/sec/det, where a det is 0.4 x 0.4 = 0.16 sq cm.
Full-time range; 1 s binning
Other quick-look light curves:
- 64 ms binning (zoomed)
- 16 ms binning (zoomed)
- 8 ms binning (zoomed)
- 2 ms binning (zoomed)
- SN=5 or 10 s binning (full-time range)
- Raw light curve
Spectra
- 64 ms binning (zoomed)
- 16 ms binning (zoomed)
- 8 ms binning (zoomed)
- 2 ms binning (zoomed)
- SN=5 or 10 s binning (full-time range)
- Raw light curve
Spectra
Notes:
- 1) The fitting includes the systematic errors.
- 2) When the burst includes telescope slew time periods, the fitting uses an average response file made from multiple 5-s response files through out the slew time plus single time preiod for the non-slew times, and weighted by the total counts in the corresponding time period using addrmf. An average response file is needed becuase a spectral fit using the pre-slew DRM will introduce some errors in both a spectral shape and a normalization if the PHA file contains a lot of the slew/post-slew time interval.
- 3) For fits to more complicated models (e.g. a power-law over a cutoff power-law), the BAT team has decided to require a chi-square improvement of more than 6 for each extra dof.
Time averaged spectrum fit using the average DRM
Power-law model
Time interval is from   -0.016 sec. to  209.152 sec.

Spectral model in power-law:
------------------------------------------------------------
Parameters  : value       lower 90%   higher 90%
Photon index: -1.28632     ( -0.0511753   0.0514322 )
Norm@50keV  : 3.05804E-03    ( -8.20517e-05   8.19197e-05 )
------------------------------------------------------------
#Fit statistic : Chi-Squared =          60.62 using 59 PHA bins.
# Reduced chi-squared =          1.064 for     57 degrees of freedom
# Null hypothesis probability =   3.465409e-01

Photon flux (15-150 keV)    in 209.2 sec: 0.363933 ( -0.010849  0.010905 ) ph/cm2/s
Energy fluence (15-150 keV)             : 6.34397e-06 ( -1.74445e-07  1.74441e-07 ) ergs/cm2
Cutoff power-law model
Time interval is from   -0.016 sec. to  209.152 sec.
Spectral model in the cutoff power-law:
------------------------------------------------------------
Parameters  : value       lower 90%   higher 90%
Photon index: -1.28486     ( -0.0495712   0.0963314 )
Epeak [keV] : 9999.36      ( -9999.36 -9999.36 )
Norm@50keV  : 3.06986E-03    ( -8.15895e-05   0.000356451 )
------------------------------------------------------------
#Fit statistic : Chi-Squared =          60.70 using 59 PHA bins.
# Reduced chi-squared =          1.084 for     56 degrees of freedom
# Null hypothesis probability =   3.102847e-01

Photon flux (15-150 keV)    in 209.2 sec: 0.366515 (    ) ph/cm2/s
Energy fluence (15-150 keV)             : 6.37238e-06 ( -2.04417e-07  1.44231e-07 ) ergs/cm2
1-s peak spectrum fit
Power-law model
Time interval is from    2.704 sec. to    3.704 sec.

Spectral model in power-law:
------------------------------------------------------------
Parameters  : value       lower 90%   higher 90%
Photon index: -1.06755     ( -0.0860947   0.0867257 )
Norm@50keV  : 5.40202E-02    ( -0.00254025   0.00253676 )
------------------------------------------------------------
#Fit statistic : Chi-Squared =          57.35 using 59 PHA bins.
# Reduced chi-squared =          1.006 for     57 degrees of freedom
# Null hypothesis probability =   4.620130e-01

Photon flux (15-150 keV)    in 1 sec: 0.310206 0.271280 4.28812E-02 (    ) ph/cm2/s
Energy fluence (15-150 keV)             : 5.70834e-07 ( -2.95689e-08  2.96757e-08 ) ergs/cm2
Cutoff power-law model
Time interval is from    2.704 sec. to    3.704 sec.
Spectral model in the cutoff power-law:
------------------------------------------------------------
Parameters  : value       lower 90%   higher 90%
Photon index: -1.06361     ( -0.0853437   0.0886769 )
Epeak [keV] : 9999.35      ( -9999.36 -9999.36 )
Norm@50keV  : 5.43260E-02    ( -0.00253382   0.0141642 )
------------------------------------------------------------
#Fit statistic : Chi-Squared =          57.38 using 59 PHA bins.
# Reduced chi-squared =          1.025 for     56 degrees of freedom
# Null hypothesis probability =   4.236283e-01

Photon flux (15-150 keV)    in 1 sec: 6.27163 ( -0.3274  0.27686 ) ph/cm2/s
Energy fluence (15-150 keV)             : 5.72928e-07 ( -3.52033e-08  3.08121e-08 ) ergs/cm2
Time-resolved spectra
Distribution
T90 vs. Hardness ratio plot
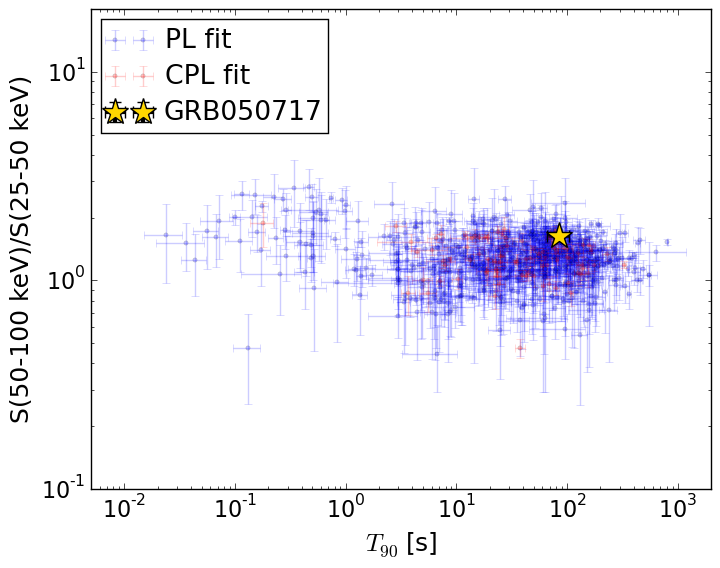
T90                                   = 85.016 sec.
Hardness ratio (energy fluence ratio) = 1.6399867251
S(15-50 keV) vs. S(50-150 keV) plot
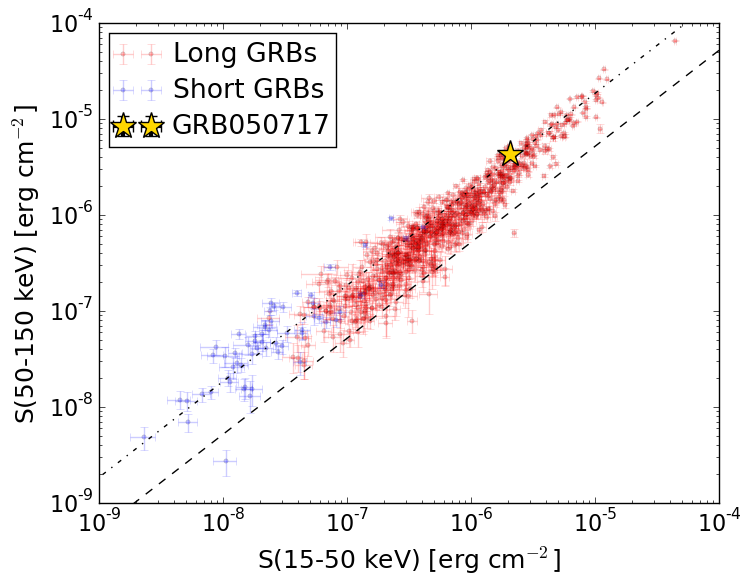
S(15-50 keV)  = 2.0700254e-06
S(50-150 keV) = 4.273918e-06
The dash-dotted line and the dashed line traces the fluences calculated from the Band function with Epeak = 15 and 150 keV, respectively. Both lines assume a canonical values of alpha = -1 and beta = -2.5.
Mask shadow pattern
IMX = -6.627495764728174E-01, IMY = -2.973519885657219E-01
Spacecraft aspect plot
Bright source in the pre-burst/pre-slew/post-slew images
Pre-burst image of 15-350 keV band
Time interval of the image:
-299.920000 -0.016000

# RAcent  DECcent POSerr Theta    Phi  PeakCts   SNR AngSep     Name
#  [deg]    [deg]    ['] [deg]  [deg]                   [']
170.2261 -60.5446   13.7  54.5 -177.4  -0.7016  -0.8    5.4	Cen X-3
186.7838 -62.7880    3.7  51.1  173.4   2.5839   3.1    3.6	GX 301-2
244.9764 -15.6373    0.2  32.7   75.6  27.3846  52.6    0.3	Sco X-1
238.8863  23.9701    2.9  47.2   14.9   2.4224   4.0 ------	UNKNOWN
205.1305  -5.3755    2.7  11.0  -53.4   1.0024   4.4 ------	UNKNOWN
152.5326 -52.1909    3.6  59.4 -163.2   5.6142   3.2 ------	UNKNOWN
164.3336 -16.8603    3.5  44.9 -120.0   3.1292   3.3 ------	UNKNOWN
Pre-slew background subtracted image of 15-350 keV band
Time interval of the image:
-0.016000 8.580600

# RAcent  DECcent POSerr Theta    Phi  PeakCts   SNR AngSep     Name
#  [deg]    [deg]    ['] [deg]  [deg]                   [']
170.3626 -60.6768   15.3  54.6 -177.5   0.1005   0.8    3.5	Cen X-3
186.8299 -62.8179    8.6  51.1  173.3  -0.1568  -1.3    5.5	GX 301-2
245.0464 -15.7809    3.2  32.8   75.9  -0.2780  -3.6    9.3	Sco X-1
214.3545 -50.5415    0.2  36.0  155.8   2.9404  52.7 ------	UNKNOWN
198.4700  36.9154    2.6  52.9  -33.2   0.5641   4.5 ------	UNKNOWN
Post-slew image of 15-350 keV band
Time interval of the image:
63.380600 302.109100

# RAcent  DECcent POSerr Theta    Phi  PeakCts   SNR AngSep     Name
#  [deg]    [deg]    ['] [deg]  [deg]                   [']
170.7065 -60.6222    0.0  26.0 -137.9   0.0043   0.0   11.5	Cen X-3
186.6939 -62.7571    1.0  19.2 -148.3   2.0644  11.0    1.3	GX 301-2
244.9709 -15.6389    0.4  42.7   38.1  13.1940  28.0    0.5	Sco X-1
256.1504 -37.8466    5.5  32.1   74.8   0.7557   2.1    7.8	4U 1700-377
256.5542 -36.5258   11.2  33.1   73.2   0.4200   1.0    8.4	GX 349+2
264.6458 -44.3689    2.7  33.9   91.2   1.8028   4.3    6.4	4U 1735-44
263.1703 -33.8008    8.7  39.0   75.5   0.9942   1.3    9.3	GX 354-0
221.9664 -41.0798    2.6  10.8   24.0   0.8001   4.5 ------	UNKNOWN
214.3701 -50.5303    1.5   0.0   92.6   1.3201   7.9 ------	UNKNOWN
212.8773 -13.8815    2.0  36.7  -10.6   1.2968   5.9 ------	UNKNOWN
149.6636 -43.0591    2.3  43.4 -114.6   4.3236   5.0 ------	UNKNOWN