Analysis Summary
Notes:
- 1) No attempt has been made to eliminate the non-significant decimal places.
- 2) This batgrbproduct analysis is done using the HEASARC data.
- 3) This batgrbproduct analysis is using the flight position for the mask-weighting calculation.
======================================================================
BAT GRB EVENT DATA PROCESSING REPORT
Process Script Ver: batgrbproduct v2.46
Process Start Time: Sat May 9 19:51:32 EDT 2015
Host Name: bat1
Current Working Dir: /local/data/bat1/alien/Swift_3rdBATcatalog/event/batevent_reproc/trigger146970
======================================================================
Trigger: 00146970 Segment: 000
BAT Trigger Time: 143612953.92 [s; MET]
Trigger Stop: 143612959.424 [s; MET]
UTC: 2005-07-21T04:29:14.287540 [includes UTCF correction]
Where From?: TDRSS position message
BAT
RA: 253.445004837197 Dec: -28.3896705827692 [deg; J2000]
Catalogged Source?: NO
Point Source?: YES
GRB Indicated?: YES [ by BAT flight software ]
Image S/N Ratio: 6.22
Image Trigger?: NO
Rate S/N Ratio: 15.0996688705415 [ if not an image trigger ]
Image S/N Ratio: 6.22
Analysis Position: [ source = BAT ]
RA: 253.445004837197 Dec: -28.3896705827692 [deg; J2000]
Refined Position: [ source = BAT pre-slew burst ]
RA: 253.460659468508 Dec: -28.3903491142184 [deg; J2000]
{ 16h 53m 50.6s , -28d 23' 25.3" }
+/- 2.03681501200638 [arcmin] (estimated 90% radius based on SNR)
+/- 0.800982294029788 [arcmin] (formal 1-sigma fit error)
SNR: 11.0092813273957
Angular difference between the analysis and refined position is 0.827315 arcmin
Partial Coding Fraction: 0.06445312 [ including projection effects ]
Duration
T90: 104.700000017881 +/- 46.1094553424698
Measured from: -1.1879999935627
to: 103.512000024319 [s; relative to TRIGTIME]
T50: 29.8200000226498 +/- 10.9214184160366
Measured from: 3.75200000405312
to: 33.5720000267029 [s; relative to TRIGTIME]
Fluence
Peak Flux (peak 1 second)
Measured from: 3.89600002765656
to: 4.89600002765656 [s; relative to TRIGTIME]
Total Fluence
Measured from: -3.63999998569489
to: 149.552000015974 [s; relative to TRIGTIME]
Band 1 Band 2 Band 3 Band 4
15-25 25-50 50-100 100-350 keV
Total 2.173287 2.598408 1.644830 0.309012
0.256747 0.231853 0.194384 0.163346 [error]
Peak 0.104866 0.190062 0.045173 0.013294
0.025885 0.025161 0.022166 0.014254 [error]
[ fluence units of on-axis counts / fully illuminated detector ]
======================================================================
====== Table of the duration information =============================
Value tstart tstop
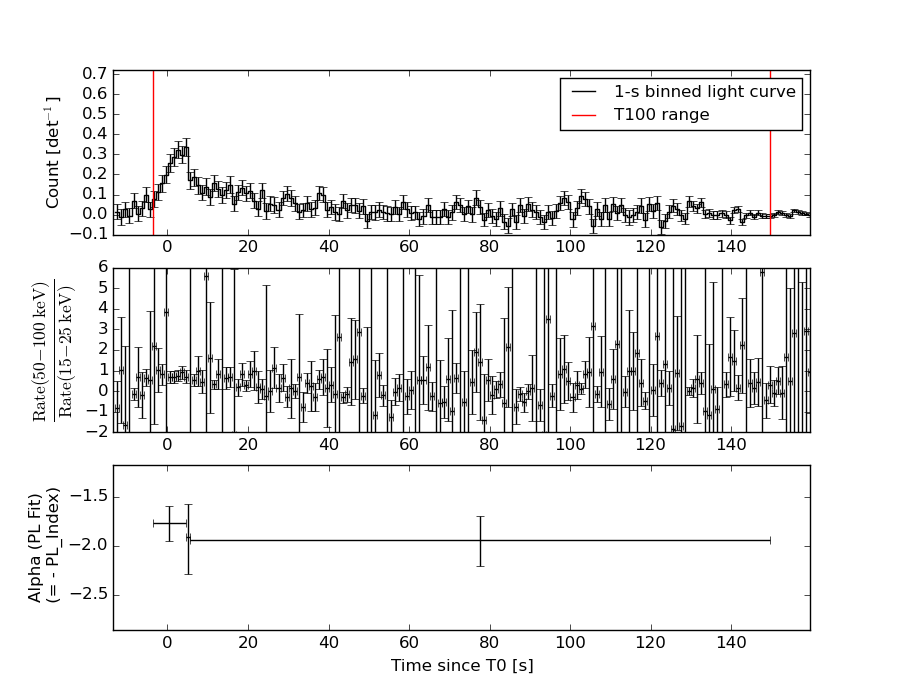
T100 153.192 -3.640 149.552
T90 104.700 -1.188 103.512
T50 29.820 3.752 33.572
Peak 1.000 3.896 4.896
====== Spectral Analysis Summary =====================================
Model : spectral model: simple power-law (PL) and cutoff power-law (CPL)
Ph_index : photon index: E^{Ph_index}
Ph_90err : 90% error of the photon index
Epeak : Epeak in keV
Epeak_90err: 90% error of Epeak
Norm : normalization at 50 keV in both the PL model and CPL model
Nomr_90err : 90% error of the normalization
chi2 : Chi-Squared
dof : degree of freedo
=== Time-averaged spectral analysis ===
(Best model with acceptable fit: N/A)
Model Ph_index Ph_90err_low Ph_90err_hi Epeak Epeak_90err_low Epeak_90err_hi Norm Nomr_90err_low Norm_90err_hi chi2 dof
PL -1.862 -0.184 0.178 - - - 2.82e-03 -3.14e-04 3.10e-04 89.680 57
CPL -1.092 -0.780 0.952 54.416 -13.149 516.402 7.28e-03 -4.43e-03 1.60e-02 86.870 56
=== 1-s peak spectral analysis ===
(Best model with acceptable fit: N/A)
Model Ph_index Ph_90err_low Ph_90err_hi Epeak Epeak_90err_low Epeak_90err_hi Norm Nomr_90err_low Norm_90err_hi chi2 dof
PL -2.349 -0.345 0.306 - - - 1.56e-02 -4.29e-03 4.26e-03 86.890 57
CPL 1.762 -1.949 3.546 38.965 -6.539 6.648 3.45e+00 -3.45e+00 2.92e+02 71.160 56
=== Fluence/Peak Flux Summary ===
Model Band1 Band2 Band3 Band4 Band5 Total
15-25 25-50 50-100 100-350 15-150 15-350 keV
Fluence PL 7.76e-07 1.15e-06 1.26e-06 2.61e-06 3.98e-06 5.79e-06 erg/cm2
90%_error_low -1.21e-07 -1.16e-07 -1.87e-07 -7.16e-07 -4.39e-07 -9.11e-07 erg/cm2
90%_error_hi 1.26e-07 1.16e-07 1.87e-07 8.75e-07 4.43e-07 1.02e-06 erg/cm2
Peak flux PL 1.46e+00 8.97e-01 3.53e-01 1.87e-01 2.81e+00 2.90e+00 ph/cm2/s
90%_error_low -3.89e-01 -2.02e-01 -1.16e-01 -9.10e-02 -6.30e-01 -6.48e-01 ph/cm2/s
90%_error_hi 4.04e-01 2.02e-01 1.19e-01 1.21e-01 6.32e-01 6.48e-01 ph/cm2/s
Fluence CPL 6.98e-07 1.24e-06 1.27e-06 8.99e-07 3.74e-06 4.11e-06 erg/cm2
90%_error_low -1.46e-07 -1.51e-07 -2.12e-07 -5.69e-07 -4.92e-07 -7.67e-07 erg/cm2
90%_error_hi 1.49e-07 1.57e-07 2.08e-07 1.75e-06 5.03e-07 1.78e-06 erg/cm2
Peak flux CPL 9.47e-01 1.44e+00 3.93e-01 8.00e-03 2.79e+00 2.79e+00 ph/cm2/s
90%_error_low -4.70e-01 -3.12e-01 -1.80e-01 -8.00e-03 -6.32e-01 -6.32e-01 ph/cm2/s
90%_error_hi 4.89e-01 3.18e-01 1.93e-01 3.64e-02 6.35e-01 6.35e-01 ph/cm2/s
======================================================================
Image
Pre-slew 15.0-350.0 keV image (Event data)
#   RAcent    DECcent   POSerr    Theta     Phi              Peak Cts       SNR   Name
  253.4607   -28.3903   0.0174    39.0992    91.3758         6.9084507     11.009 TRIG_00146970

Foreground time interval of the image:
 -3.640 118.981 (delta_t = 122.621 [sec])
Background time interval of the image:
-295.119  -3.640 (delta_t = 291.479 [sec])
Light Curves
Note: The mask-weighted lightcurves have units of either count/det or counts/sec/det, where a det is 0.4 x 0.4 = 0.16 sq cm.
Full-time range; 1 s binning
Other quick-look light curves:
- 64 ms binning (zoomed)
- 16 ms binning (zoomed)
- 8 ms binning (zoomed)
- 2 ms binning (zoomed)
- SN=5 or 10 s binning (full-time range)
- Raw light curve
Spectra
- 64 ms binning (zoomed)
- 16 ms binning (zoomed)
- 8 ms binning (zoomed)
- 2 ms binning (zoomed)
- SN=5 or 10 s binning (full-time range)
- Raw light curve
Spectra
Notes:
- 1) The fitting includes the systematic errors.
- 2) When the burst includes telescope slew time periods, the fitting uses an average response file made from multiple 5-s response files through out the slew time plus single time preiod for the non-slew times, and weighted by the total counts in the corresponding time period using addrmf. An average response file is needed becuase a spectral fit using the pre-slew DRM will introduce some errors in both a spectral shape and a normalization if the PHA file contains a lot of the slew/post-slew time interval.
- 3) For fits to more complicated models (e.g. a power-law over a cutoff power-law), the BAT team has decided to require a chi-square improvement of more than 6 for each extra dof.
Time averaged spectrum fit using the average DRM
Power-law model

Time interval is from   -3.640 sec. to  149.552 sec.

Spectral model in power-law:
------------------------------------------------------------
Parameters  : value       lower 90%   higher 90%
Photon index: -1.86189     ( -0.183808   0.178105 )
Norm@50keV  : 2.82300E-03    ( -0.000314075   0.000309855 )
------------------------------------------------------------
#Fit statistic : Chi-Squared =          89.68 using 59 PHA bins.
# Reduced chi-squared =          1.573 for     57 degrees of freedom
# Null hypothesis probability =   3.717259e-03

Photon flux (15-150 keV)    in 153.2 sec: 0.398756 ( -0.041512  0.041639 ) ph/cm2/s
Energy fluence (15-150 keV)             : 3.97675e-06 ( -4.39313e-07  4.43417e-07 ) ergs/cm2
Cutoff power-law model
Time interval is from   -3.640 sec. to  149.552 sec.
Spectral model in the cutoff power-law:
------------------------------------------------------------
Parameters  : value       lower 90%   higher 90%
Photon index: -1.09203     ( -0.779836   0.951504 )
Epeak [keV] : 54.4157      ( -13.1487 516.403 )
Norm@50keV  : 7.27530E-03    ( -0.00442873   0.0160311 )
------------------------------------------------------------
#Fit statistic : Chi-Squared =          86.87 using 59 PHA bins.
# Reduced chi-squared =          1.551 for     56 degrees of freedom
# Null hypothesis probability =   5.125119e-03

Photon flux (15-150 keV)    in 153.2 sec: 0.384101 ( -0.04414  0.044185 ) ph/cm2/s
Energy fluence (15-150 keV)             : 3.73834e-06 ( -4.9174e-07  5.0325e-07 ) ergs/cm2
1-s peak spectrum fit
Power-law model

Time interval is from    3.896 sec. to    4.896 sec.

Spectral model in power-law:
------------------------------------------------------------
Parameters  : value       lower 90%   higher 90%
Photon index: -2.34866     ( -0.35113   0.30055 )
Norm@50keV  : 1.56427E-02    ( -0.00430484   0.00424607 )
------------------------------------------------------------
#Fit statistic : Chi-Squared =          86.89 using 59 PHA bins.
# Reduced chi-squared =          1.524 for     57 degrees of freedom
# Null hypothesis probability =   6.556256e-03

Photon flux (15-150 keV)    in 1 sec: 2.80912 ( -0.63041  0.63177 ) ph/cm2/s
Energy fluence (15-150 keV)             : 1.51091e-07 ( -3.61884e-08  3.66936e-08 ) ergs/cm2
Cutoff power-law model
Time interval is from    3.896 sec. to    4.896 sec.
Spectral model in the cutoff power-law:
------------------------------------------------------------
Parameters  : value       lower 90%   higher 90%
Photon index: 1.76165     ( -1.98404   3.51112 )
Epeak [keV] : 38.9646      ( -6.56452 6.62208 )
Norm@50keV  : 3.44635    ( -4.33177   291.534 )
------------------------------------------------------------
#Fit statistic : Chi-Squared =          71.16 using 59 PHA bins.
# Reduced chi-squared =          1.271 for     56 degrees of freedom
# Null hypothesis probability =   8.347744e-02

Photon flux (15-150 keV)    in 1 sec: 2.78873 ( -0.63153  0.63498 ) ph/cm2/s
Energy fluence (15-150 keV)             : 0 ( 0  0 ) ergs/cm2
Time-resolved spectra
Distribution
T90 vs. Hardness ratio plot
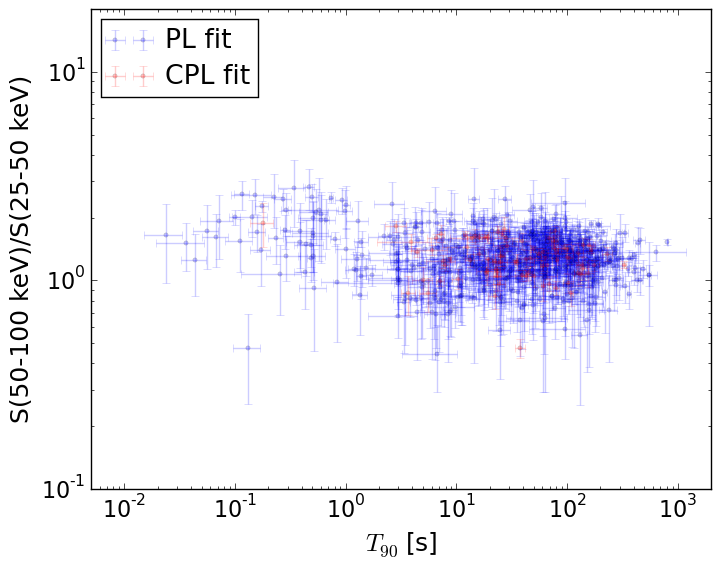
T90                                   = N/A sec.
Hardness ratio (energy fluence ratio) = N/A
S(15-50 keV) vs. S(50-150 keV) plot
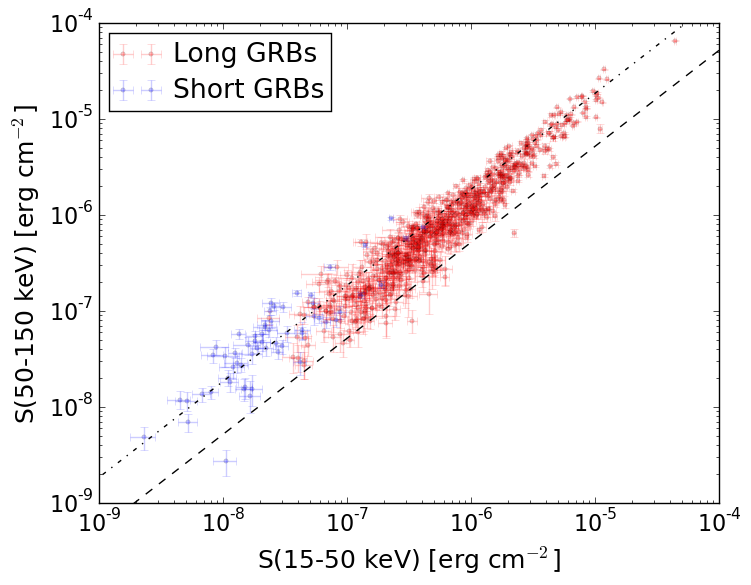
S(15-50 keV)  = N/A
S(50-150 keV) = N/A
The dash-dotted line and the dashed line traces the fluences calculated from the Band function with Epeak = 15 and 150 keV, respectively. Both lines assume a canonical values of alpha = -1 and beta = -2.5.
Mask shadow pattern
IMX = -1.951130092065932E-02, IMY = -8.124193839852702E-01
Spacecraft aspect plot
Bright source in the pre-burst/pre-slew/post-slew images
Pre-burst image of 15-350 keV band
Time interval of the image:
-295.119400 -3.640000

# RAcent  DECcent POSerr Theta    Phi  PeakCts   SNR AngSep     Name
#  [deg]    [deg]    ['] [deg]  [deg]                   [']
170.2943 -60.6154   39.7  54.1 -179.8  -0.3215  -0.3    0.8	Cen X-3
186.6598 -62.7761    3.3  50.3  171.3   3.0105   3.5    0.4	GX 301-2
244.9859 -15.6451    0.3  30.6   69.6  20.1100  37.7    0.5	Sco X-1
212.5649 -62.9935    3.7  47.0  156.2   3.1239   3.1 ------	UNKNOWN
160.1296 -57.8419    3.0  57.2 -173.7   5.5827   3.9 ------	UNKNOWN
181.4656 -17.7666    3.0  30.3 -122.0   1.3740   3.9 ------	UNKNOWN
186.9014  14.1596    4.3  39.8  -66.2   2.9076   2.6 ------	UNKNOWN
Pre-slew background subtracted image of 15-350 keV band
Time interval of the image:
-3.640000 118.980600

# RAcent  DECcent POSerr Theta    Phi  PeakCts   SNR AngSep     Name
#  [deg]    [deg]    ['] [deg]  [deg]                   [']
170.2285 -60.7635   16.7  54.2 -179.9  -0.3821  -0.7    8.8	Cen X-3
186.7193 -62.7151   11.2  50.2  171.3  -0.4080  -1.0    3.7	GX 301-2
244.8031 -15.7232    0.0  30.4   69.7   0.1375   0.6   11.3	Sco X-1
253.4607 -28.3904    1.1  39.1   91.4   6.9093  10.9 ------	UNKNOWN
218.7261  28.5732    1.8  44.9  -17.2   1.4512   6.5 ------	UNKNOWN
197.5647  34.1256    2.3  52.3  -40.4   3.5158   5.0 ------	UNKNOWN
Post-slew image of 15-350 keV band
Time interval of the image:
175.580620 302.148000

# RAcent  DECcent POSerr Theta    Phi  PeakCts   SNR AngSep     Name
#  [deg]    [deg]    ['] [deg]  [deg]                   [']
186.4210 -62.7402   32.6  54.6 -149.2   0.2386   0.4    6.7	GX 301-2
244.9850 -15.6452    0.1  14.9  -33.6  11.3360  83.7    0.4	Sco X-1
255.8973 -37.7375    7.0   9.6  167.8   0.2257   1.7    7.7	4U 1700-377
256.4446 -36.3888    4.0   8.4  162.7   0.3995   2.9    2.1	GX 349+2
263.0053 -24.8943   45.7   9.2   69.7   0.0353   0.3    8.9	GX 1+4
264.7249 -44.4764    7.9  18.5  153.4   0.2269   1.5    1.8	4U 1735-44
268.3731  -1.4485    1.2  30.5   30.2   1.6726   9.3    0.4	SW J1753.5-0127
270.2958 -25.1448    3.1  15.4   81.4   0.5617   3.8    4.0	GX 5-1
270.3913 -25.7088    3.0  15.3   83.6   0.6363   4.3    5.2	GRS 1758-258
273.9750 -13.9868    5.6  23.9   56.9   0.3533   2.1    3.5	GX 17+2
276.0314 -30.3170    6.0  19.8  100.8   0.3353   1.9    6.3	H1820-303
285.1086 -24.7680    3.7  28.5   89.8  -0.7216  -3.1   10.0	HT1900.1-2455
262.9191 -33.6907    4.4   9.7  125.1   0.3527   2.6    9.3	GX 354-0
296.1406 -40.7283    3.0  36.9  120.7   1.3051   3.8 ------	UNKNOWN
291.2272 -33.4554    3.0  32.7  108.2   1.0236   3.9 ------	UNKNOWN
273.1932 -66.4767    1.9  40.0  167.5   1.3191   6.0 ------	UNKNOWN
251.1010  -5.5265    2.9  23.0   -6.3   0.5770   4.0 ------	UNKNOWN
233.4858 -26.1754    2.3  17.8  -88.0   0.7766   5.1 ------	UNKNOWN
184.5251 -73.3536    2.9  56.9 -161.8   2.4967   4.0 ------	UNKNOWN
213.1767 -40.9743    2.7  35.0 -122.2   0.9629   4.2 ------	UNKNOWN