Analysis Summary
Notes:
- 1) No attempt has been made to eliminate the non-significant decimal places.
- 2) This batgrbproduct analysis is done using the HEASARC data.
- 3) This batgrbproduct analysis is using the flight position for the mask-weighting calculation.
======================================================================
                  BAT GRB EVENT DATA PROCESSING REPORT
    Process Script Ver: batgrbproduct v2.46
    Process Start Time: Wed Jan 22 21:18:43 EST 2014
             Host Name: batevent1
   Current Working Dir: /local/data/batevent/batevent_reproc/trigger147478
======================================================================

  Trigger: 00147478      Segment: 000

  BAT Trigger Time: 143901249   [s; MET]
      Trigger Stop: 143901249.064   [s; MET]
               UTC: 2005-07-24T12:34:09.361840    [includes UTCF correction]
       Where From?: (*SHORT BURST*) TDRSS scaled map message

  BAT
    RA: 246.214226784009   Dec: -27.5239717279159  [deg; J2000]

     Catalogged Source?: NO
     Point Source?:      YES
     GRB Indicated?:     YES    [ by BAT flight software ]
     Image S/N Ratio:    10.77
     Image Trigger?:     NO
     Rate S/N Ratio:     32.832910318764  [ if not an image trigger ]
     Image S/N Ratio:    10.77

  Analysis Position:   [ source = BAT ]
    RA: 246.214226784009   Dec: -27.5239717279159  [deg; J2000]

  Refined Position:   [ source = BAT pre-slew burst ]
    RA: 246.179863475337   Dec: -27.5253074911614  [deg; J2000]
        { 16h 24m 43.2s , -27d 31' 31.1" }
         +/- 1.85612095261176 [arcmin] (estimated 90% radius based on SNR)
         +/- 0.955463533104392 [arcmin] (formal 1-sigma fit error)
    SNR: 12.5717325264243

  Angular difference between the analysis and refined position is 1.830184 arcmin

  Partial Coding Fraction: 0.3671875    [ including projection effects ]

  Duration
     T90: 98.6840000152588 +/- 8.55663207182055
        Measured from: 0.0519999861717224
                   to: 98.7360000014305     [s; relative to TRIGTIME]
     T50: 73.8680000007153 +/- 10.9161606717104
        Measured from: 1.86000001430511
                   to: 75.7280000150204     [s; relative to TRIGTIME]


  Fluence
     Peak Flux  (peak 1 second)
        Measured from: -0.0239999890327454
                   to: 0.976000010967255     [s; relative to TRIGTIME]
     Total Fluence
        Measured from: -0.0239999890327454
                   to: 107.139999985695     [s; relative to TRIGTIME]

             Band 1     Band 2     Band 3     Band 4
              15-25      25-50     50-100    100-350     keV
 Total     0.731174   0.728827   0.366425   0.141312
           0.073000   0.062626   0.053296   0.047404 [error]
 Peak      0.128964   0.137256   0.105923   0.023961
           0.011623   0.010839   0.009743   0.007480 [error]

     [ fluence units of on-axis counts / fully illuminated detector ]

======================================================================


====== Table of the duration information =============================

        Value   tstart    tstop
T100  107.164   -0.024  107.140
T90    98.684    0.052   98.736
T50    73.868    1.860   75.728
Peak    1.000   -0.024    0.976


====== Spectral Analysis Summary =====================================

Model      : spectral model: simple power-law (PL) and cutoff power-law (CPL)
Ph_index   : photon index: E^{Ph_index}
Ph_90err   : 90% error of the photon index
Epeak      : Epeak in keV
Epeak_90err: 90% error of Epeak
Norm       : normalization at 50 keV in both the PL model and CPL model
Nomr_90err : 90% error of the normalization
chi2       : Chi-Squared
dof        : degree of freedo

=== Time-averaged spectral analysis ===
(Best model with acceptable fit: PL)

Model Ph_index Ph_90err_low Ph_90err_hi  Epeak  Epeak_90err_low  Epeak_90err_hi  Norm       Nomr_90err_low    Norm_90err_hi    chi2    dof
PL      -1.934    -0.212      0.204       -           -               -         1.02e-03     -1.26e-04          1.23e-04      56.200   57
CPL     -2.021    -0.272      0.590       11.479      N/A           N/A         9.16e-04        N/A               N/A         55.990   56


=== 1-s peak spectral analysis ===
(Best model with acceptable fit: PL)

Model Ph_index Ph_90err_low Ph_90err_hi  Epeak  Epeak_90err_low  Epeak_90err_hi  Norm       Nomr_90err_low    Norm_90err_hi    chi2    dof
PL      -1.658     -0.162     0.158       -           -               -         2.56e-02     -2.32e-03          2.29e-03      55.990   57
CPL     -1.578     -0.897     0.576      244.546      N/A           N/A         2.81e-02        N/A               N/A         56.030   56


=== Fluence/Peak Flux Summary ===

              Model    Band1     Band2     Band3     Band4     Band5     Total
                       15-25     25-50    50-100    100-350    15-150    15-350    keV
Fluence         PL   2.10e-07  2.97e-07  3.10e-07  5.98e-07  1.01e-06  1.42e-06   erg/cm2
      90%_error_low -3.39e-08 -3.03e-08 -5.31e-08 -1.89e-07 -1.19e-07 -2.44e-07   erg/cm2
      90%_error_hi   3.53e-08  3.03e-08  5.38e-08  2.42e-07  1.21e-07  2.84e-07   erg/cm2
Peak flux       PL   1.23e+00  1.13e+00  7.14e-01  6.93e-01  3.36e+00  3.76e+00   ph/cm2/s
      90%_error_low -1.80e-01 -1.02e-01 -8.40e-02 -1.56e-01 -2.95e-01 -3.20e-01   ph/cm2/s
      90%_error_hi   1.88e-01  1.01e-01  8.32e-02  1.81e-01  2.96e-01  3.21e-01   ph/cm2/s

Fluence        CPL   2.09e-07  2.60e-07  2.77e-07  5.95e-07  8.90e-07  1.40e-06   erg/cm2
      90%_error_low -3.57e-08 -7.11e-08 -8.28e-08 -1.70e-07 -3.73e-07 -4.04e-07   erg/cm2
      90%_error_hi   3.43e-08  4.35e-08  5.27e-08  1.33e-07  2.17e-07  2.81e-07   erg/cm2
Peak flux      CPL   1.22e+00  1.13e+00  7.16e-01  6.60e-01  3.35e+00  3.72e+00   ph/cm2/s
      90%_error_low -2.20e-01 -1.04e-01 -8.15e-02 -3.23e-01 -3.12e-01 -4.85e-01   ph/cm2/s
      90%_error_hi   1.54e-01  1.15e-01  9.11e-02  1.43e-01  3.02e-01  3.53e-01   ph/cm2/s

======================================================================
Image
Pre-slew 15.0-350.0 keV image (Event data)
#   RAcent    DECcent   POSerr    Theta     Phi              Peak Cts       SNR   Name
  246.1799   -27.5253   0.0152    33.3010    45.6079         0.6278714     12.572 TRIG_00147478

Foreground time interval of the image:
 -0.024   8.701 (delta_t =   8.725 [sec])
Background time interval of the image:
-186.899  -0.024 (delta_t = 186.875 [sec])
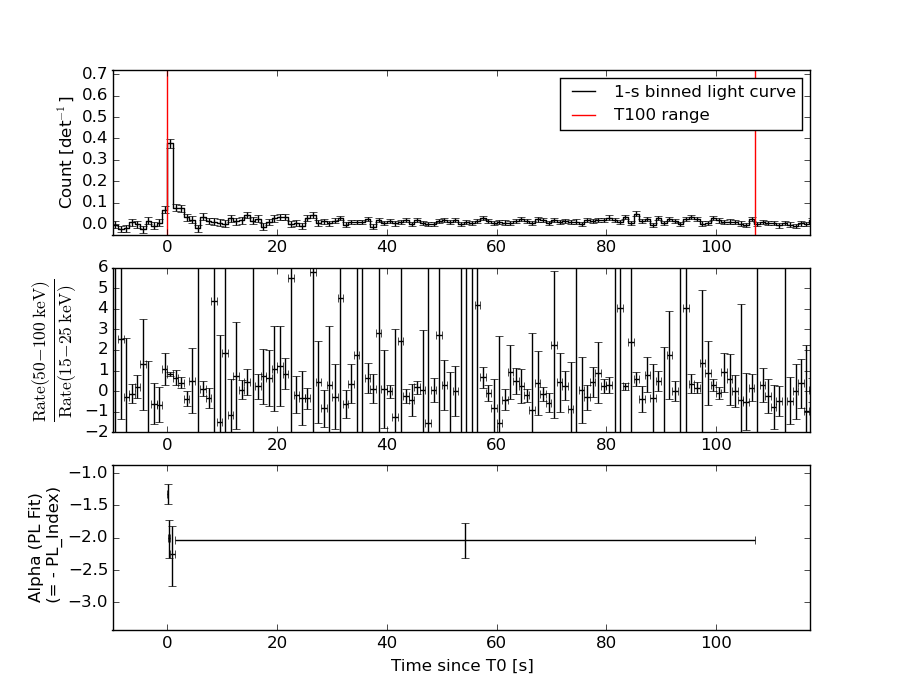
Light Curves
Note: The mask-weighted lightcurves have units of either count/det or counts/sec/det, where a det is 0.4 x 0.4 = 0.16 sq cm.
Full-time range; 1 s binning
Other quick-look light curves:
- 64 ms binning (zoomed)
- 16 ms binning (zoomed)
- 8 ms binning (zoomed)
- 2 ms binning (zoomed)
- SN=5 or 10 s binning (full-time range)
- Raw light curve
Spectra
- 64 ms binning (zoomed)
- 16 ms binning (zoomed)
- 8 ms binning (zoomed)
- 2 ms binning (zoomed)
- SN=5 or 10 s binning (full-time range)
- Raw light curve
Spectra
Notes:
- 1) The fitting includes the systematic errors.
- 2) When the burst includes telescope slew time periods, the fitting uses an average response file made from multiple 5-s response files through out the slew time plus single time preiod for the non-slew times, and weighted by the total counts in the corresponding time period using addrmf. An average response file is needed becuase a spectral fit using the pre-slew DRM will introduce some errors in both a spectral shape and a normalization if the PHA file contains a lot of the slew/post-slew time interval.
- 3) For fits to more complicated models (e.g. a power-law over a cutoff power-law), the BAT team has decided to require a chi-square improvement of more than 6 for each extra dof.
Time averaged spectrum fit using the average DRM
Power-law model

Time interval is from   -0.024 sec. to  107.140 sec.

Spectral model in power-law:
------------------------------------------------------------
Parameters  : value       lower 90%   higher 90%
Photon index: -1.93423     ( -0.21244   0.204333 )
Norm@50keV  : 1.01934E-03    ( -0.000126117   0.000122932 )
------------------------------------------------------------
#Fit statistic : Chi-Squared =          56.20 using 59 PHA bins.
# Reduced chi-squared =         0.9859 for     57 degrees of freedom
# Null hypothesis probability =   5.051084e-01

Photon flux (15-150 keV)    in 107.2 sec: 0.148468 ( -0.015537  0.015585 ) ph/cm2/s
Energy fluence (15-150 keV)             : 1.00534e-06 ( -1.18873e-07  1.21035e-07 ) ergs/cm2
Cutoff power-law model
Time interval is from   -0.024 sec. to  107.140 sec.
Spectral model in the cutoff power-law:
------------------------------------------------------------
Parameters  : value       lower 90%   higher 90%
Photon index: -2.19334     ( -0.0990911   0.762519 )
Epeak [keV] : 78.9097      (   )
Norm@50keV  : 7.50321E-04    (     )
------------------------------------------------------------
#Fit statistic : Chi-Squared =          55.69 using 59 PHA bins.
# Reduced chi-squared =         0.9945 for     56 degrees of freedom
# Null hypothesis probability =   4.864231e-01

Photon flux (15-150 keV)    in 107.2 sec: 0.138851 ( -0.035547  0.024806 ) ph/cm2/s
Energy fluence (15-150 keV)             : 8.9003e-07 ( -3.73442e-07  2.1686e-07 ) ergs/cm2
1-s peak spectrum fit
Power-law model

Time interval is from   -0.024 sec. to    0.976 sec.

Spectral model in power-law:
------------------------------------------------------------
Parameters  : value       lower 90%   higher 90%
Photon index: -1.65765     ( -0.161734   0.15835 )
Norm@50keV  : 2.56355E-02    ( -0.00231729   0.00229481 )
------------------------------------------------------------
#Fit statistic : Chi-Squared =          55.99 using 59 PHA bins.
# Reduced chi-squared =         0.9822 for     57 degrees of freedom
# Null hypothesis probability =   5.130992e-01

Photon flux (15-150 keV)    in 1 sec: 3.35598 ( -0.29477  0.29577 ) ph/cm2/s
Energy fluence (15-150 keV)             : 2.38276e-07 ( -2.27647e-08  2.29943e-08 ) ergs/cm2
Cutoff power-law model
Time interval is from   -0.024 sec. to    0.976 sec.
Spectral model in the cutoff power-law:
------------------------------------------------------------
Parameters  : value       lower 90%   higher 90%
Photon index: -1.57796     ( -0.879967   0.593296 )
Epeak [keV] : 244.546      (   )
Norm@50keV  : 2.80522E-02    (     )
------------------------------------------------------------
#Fit statistic : Chi-Squared =          55.99 using 59 PHA bins.
# Reduced chi-squared =         0.9998 for     56 degrees of freedom
# Null hypothesis probability =   4.752437e-01

Photon flux (15-150 keV)    in 1 sec: 3.34836 ( -0.31236  0.30183 ) ph/cm2/s
Energy fluence (15-150 keV)             : 2.37564e-07 ( -2.48922e-08  2.34838e-08 ) ergs/cm2
Time-resolved spectra
Distribution
T90 vs. Hardness ratio plot
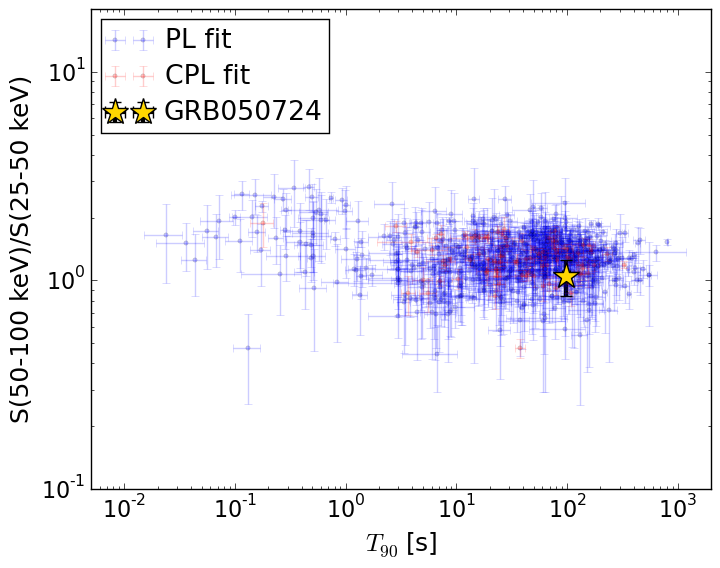
T90                                   = 98.684 sec.
Hardness ratio (energy fluence ratio) = 1.04667039807
S(15-50 keV) vs. S(50-150 keV) plot
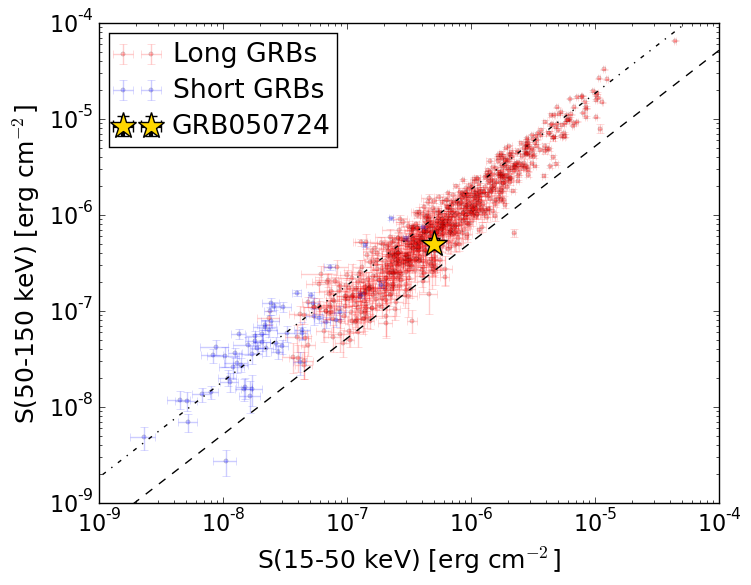
S(15-50 keV)  = 5.066765e-07
S(50-150 keV) = 4.986692e-07
The dash-dotted line and the dashed line traces the fluences calculated from the Band function with Epeak = 15 and 150 keV, respectively. Both lines assume a canonical values of alpha = -1 and beta = -2.5.
Mask shadow pattern
IMX = 4.595461485119394E-01, IMY = -4.694024223903498E-01
Spacecraft aspect plot
Bright source in the pre-burst/pre-slew/post-slew images
Pre-burst image of 15-350 keV band
Time interval of the image:
-186.899400 -0.024000

# RAcent  DECcent POSerr Theta    Phi  PeakCts   SNR AngSep     Name
#  [deg]    [deg]    ['] [deg]  [deg]                   [']
170.4474 -60.4695    6.1  26.2 -142.0  -0.3391  -1.9   10.0	Cen X-3
186.7901 -62.8613    4.6  19.3 -153.0   0.4330   2.5    6.6	GX 301-2
244.9760 -15.6399    0.3  42.7   33.5  18.4538  35.5    0.2	Sco X-1
256.2256 -37.9311    0.0  32.0   70.4  -0.6045  -1.6   12.5	4U 1700-377
256.4131 -36.4783    4.9  33.0   68.5   0.9660   2.4    3.5	GX 349+2
264.5032 -44.4410   46.5  33.8   86.7  -0.1112  -0.2   10.3	4U 1735-44
263.0285 -33.8460    4.4  38.9   70.9   1.9309   2.6    2.1	GX 354-0
266.0883 -34.9208    2.5  40.1   74.7   4.0195   4.7 ------	UNKNOWN
 93.5979 -60.2851    4.1  59.4 -163.1   3.8316   2.8 ------	UNKNOWN
151.9694 -40.5317    2.7  43.5 -114.6   3.2449   4.4 ------	UNKNOWN
Pre-slew background subtracted image of 15-350 keV band
Time interval of the image:
-0.024000 8.700600

# RAcent  DECcent POSerr Theta    Phi  PeakCts   SNR AngSep     Name
#  [deg]    [deg]    ['] [deg]  [deg]                   [']
170.2551 -60.8231    5.1  26.3 -142.8   0.0701   2.3   12.1	Cen X-3
186.5310 -62.8057   11.7  19.4 -152.7  -0.0265  -1.0    4.0	GX 301-2
245.0739 -15.6749    3.3  42.7   33.7   0.2778   3.5    5.8	Sco X-1
255.8512 -37.9829    5.3  31.7   70.2   0.1227   2.2   10.5	4U 1700-377
256.3124 -36.5795    0.0  32.9   68.5   0.0934   1.6   11.1	GX 349+2
264.6701 -44.3724    7.1  33.9   86.7   0.1085   1.6    5.6	4U 1735-44
263.1571 -33.7865    9.6  39.0   70.9  -0.1306  -1.2    8.9	GX 354-0
246.1799 -27.5253    0.9  33.3   45.6   0.6280  12.6 ------	UNKNOWN
200.0554 -27.1795    2.1  25.8  -43.2   0.1617   5.6 ------	UNKNOWN
Post-slew image of 15-350 keV band
Time interval of the image:
62.500630 303.065000

# RAcent  DECcent POSerr Theta    Phi  PeakCts   SNR AngSep     Name
#  [deg]    [deg]    ['] [deg]  [deg]                   [']
186.6857 -62.7305    3.8  51.9 -154.7   2.1969   3.0    2.5	GX 301-2
244.9809 -15.6433    0.1  11.9  -10.7  23.5581  96.1    0.2	Sco X-1
255.8007 -37.7054   11.3  13.0  139.3   0.2618   1.0   12.1	4U 1700-377
256.5420 -36.4436    3.3  12.5  133.4   0.9058   3.5    5.3	GX 349+2
262.8361 -24.6064    0.0  15.2   77.9  -0.3120  -1.2   12.6	GX 1+4
264.6613 -44.4744    6.5  22.5  139.0   0.5109   1.8    3.8	4U 1735-44
268.3720  -1.4676    1.8  33.6   38.1   2.6984   6.5    0.9	SW J1753.5-0127
270.2497 -24.9876    2.7  21.7   83.9   1.2591   4.2    5.8	GX 5-1
270.2970 -25.7805    2.3  21.5   86.1   1.4936   5.0    2.3	GRS 1758-258
274.1682 -14.1027    5.8  29.2   63.6   0.8209   2.0   10.3	GX 17+2
275.8812 -30.5117    8.2  26.0   98.9   0.5435   1.4    9.0	H1820-303
285.1172 -24.8848   20.2  34.8   89.9   0.3611   0.6    4.9	HT1900.1-2455
262.9803 -33.8293  169.3  15.7  113.0   0.0187   0.1    0.5	GX 354-0
250.5588  29.3055    3.8  57.0   -0.4   4.6772   3.0 ------	UNKNOWN