Analysis Summary
Notes:
- 1) No attempt has been made to eliminate the non-significant decimal places.
- 2) This batgrbproduct analysis is done using the HEASARC data.
- 3) This batgrbproduct analysis is using the flight position for the mask-weighting calculation.
======================================================================
BAT GRB EVENT DATA PROCESSING REPORT
Process Script Ver: batgrbproduct v2.46
Process Start Time: Wed Jan 22 21:15:32 EST 2014
Host Name: batevent1
Current Working Dir: /local/data/batevent/batevent_reproc/trigger147788
======================================================================
Trigger: 00147788 Segment: 000
BAT Trigger Time: 144046817.472 [s; MET]
Trigger Stop: 144046825.664 [s; MET]
UTC: 2005-07-26T05:00:17.830940 [includes UTCF correction]
Where From?: TDRSS position message
BAT
RA: 200.0645009276 Dec: -32.0902643464852 [deg; J2000]
Catalogged Source?: NO
Point Source?: YES
GRB Indicated?: YES [ by BAT flight software ]
Image S/N Ratio: 8.32
Image Trigger?: NO
Rate S/N Ratio: 23.6220236220354 [ if not an image trigger ]
Image S/N Ratio: 8.32
Analysis Position: [ source = BAT ]
RA: 200.0645009276 Dec: -32.0902643464852 [deg; J2000]
Refined Position: [ source = BAT pre-slew burst ]
RA: 200.024698653156 Dec: -32.0650230988855 [deg; J2000]
{ 13h 20m 05.9s , -32d 03' 54.1" }
+/- 1.83462844390184 [arcmin] (estimated 90% radius based on SNR)
+/- 0.807735993172336 [arcmin] (formal 1-sigma fit error)
SNR: 12.782654839646
Angular difference between the analysis and refined position is 2.527516 arcmin
Partial Coding Fraction: 0.1484375 [ including projection effects ]
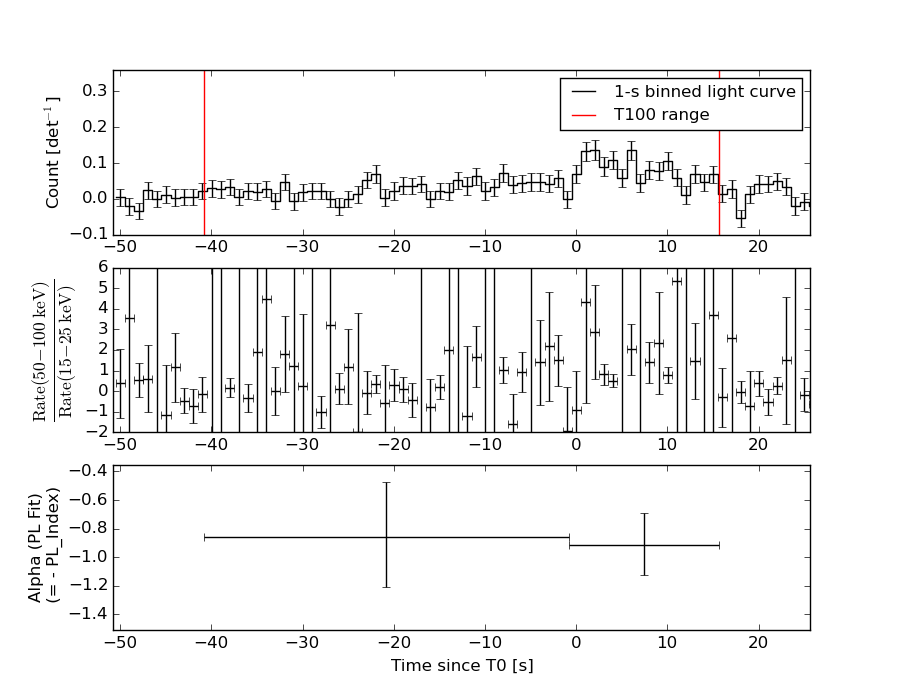
Duration
T90: 46.4959999918938 +/- 14.4479756449802
Measured from: -36.2560000121593
to: 10.2399999797344 [s; relative to TRIGTIME]
T50: 18.1599999666214 +/- 7.76318286192033
Measured from: -11.8400000035763
to: 6.31999996304512 [s; relative to TRIGTIME]
Fluence
Peak Flux (peak 1 second)
Measured from: 1.06000000238419
to: 2.06000000238419 [s; relative to TRIGTIME]
Total Fluence
Measured from: -40.8320000171661
to: 15.6319999992847 [s; relative to TRIGTIME]
Band 1 Band 2 Band 3 Band 4
15-25 25-50 50-100 100-350 keV
Total 0.457776 0.685302 0.968075 0.329667
0.102531 0.098294 0.085572 0.071373 [error]
Peak 0.026112 0.064915 0.058704 0.013792
0.014207 0.014402 0.014197 0.010403 [error]
[ fluence units of on-axis counts / fully illuminated detector ]
======================================================================
====== Table of the duration information =============================
Value tstart tstop
T100 56.464 -40.832 15.632
T90 46.496 -36.256 10.240
T50 18.160 -11.840 6.320
Peak 1.000 1.060 2.060
====== Spectral Analysis Summary =====================================
Model : spectral model: simple power-law (PL) and cutoff power-law (CPL)
Ph_index : photon index: E^{Ph_index}
Ph_90err : 90% error of the photon index
Epeak : Epeak in keV
Epeak_90err: 90% error of Epeak
Norm : normalization at 50 keV in both the PL model and CPL model
Nomr_90err : 90% error of the normalization
chi2 : Chi-Squared
dof : degree of freedo
=== Time-averaged spectral analysis ===
(Best model with acceptable fit: PL)
Model Ph_index Ph_90err_low Ph_90err_hi Epeak Epeak_90err_low Epeak_90err_hi Norm Nomr_90err_low Norm_90err_hi chi2 dof
PL -0.883 -0.198 0.210 - - - 3.08e-03 -3.83e-04 3.75e-04 65.950 57
CPL -0.274 -0.610 1.053 184.037 N/A N/A 5.26e-03 N/A N/A 64.470 56
=== 1-s peak spectral analysis ===
(Best model with acceptable fit: PL)
Model Ph_index Ph_90err_low Ph_90err_hi Epeak Epeak_90err_low Epeak_90err_hi Norm Nomr_90err_low Norm_90err_hi chi2 dof
PL -1.061 -0.419 0.457 - - - 1.18e-02 -3.05e-03 2.97e-03 63.780 57
CPL -1.060 -0.418 0.465 9999.360 -9999.360 -9999.360 1.19e-02 -1.55e-03 4.33e-02 63.780 56
=== Fluence/Peak Flux Summary ===
Model Band1 Band2 Band3 Band4 Band5 Total
15-25 25-50 50-100 100-350 15-150 15-350 keV
Fluence PL 1.25e-07 3.36e-07 7.28e-07 4.12e-06 1.96e-06 5.31e-06 erg/cm2
90%_error_low -3.17e-08 -5.45e-08 -7.95e-08 -9.69e-07 -2.14e-07 -9.95e-07 erg/cm2
90%_error_hi 3.55e-08 5.41e-08 7.93e-08 1.19e-06 2.14e-07 1.18e-06 erg/cm2
Peak flux PL 3.20e-01 4.19e-01 4.01e-01 6.83e-01 1.37e+00 1.82e+00 ph/cm2/s
90%_error_low -1.53e-01 -1.40e-01 -1.02e-01 -3.10e-01 -3.60e-01 -4.50e-01 ph/cm2/s
90%_error_hi 1.87e-01 1.35e-01 1.01e-01 4.42e-01 3.64e-01 4.61e-01 ph/cm2/s
Fluence CPL 1.01e-07 3.36e-07 7.80e-07 2.25e-06 1.93e-06 3.47e-06 erg/cm2
90%_error_low -4.11e-08 -5.95e-08 -1.06e-07 -1.18e-06 -2.24e-07 -1.18e-06 erg/cm2
90%_error_hi 4.74e-08 5.82e-08 1.09e-07 2.22e-06 2.21e-07 2.08e-06 erg/cm2
Peak flux CPL 3.23e-01 4.19e-01 4.01e-01 6.82e-01 1.37e+00 1.83e+00 ph/cm2/s
90%_error_low -1.84e-01 -1.04e-01 -1.02e-01 -6.82e-01 -3.61e-01 -6.65e-01 ph/cm2/s
90%_error_hi 1.40e-01 1.42e-01 1.28e-01 4.35e-01 3.63e-01 4.39e-01 ph/cm2/s
======================================================================
Image
Pre-slew 15.0-350.0 keV image (Event data)
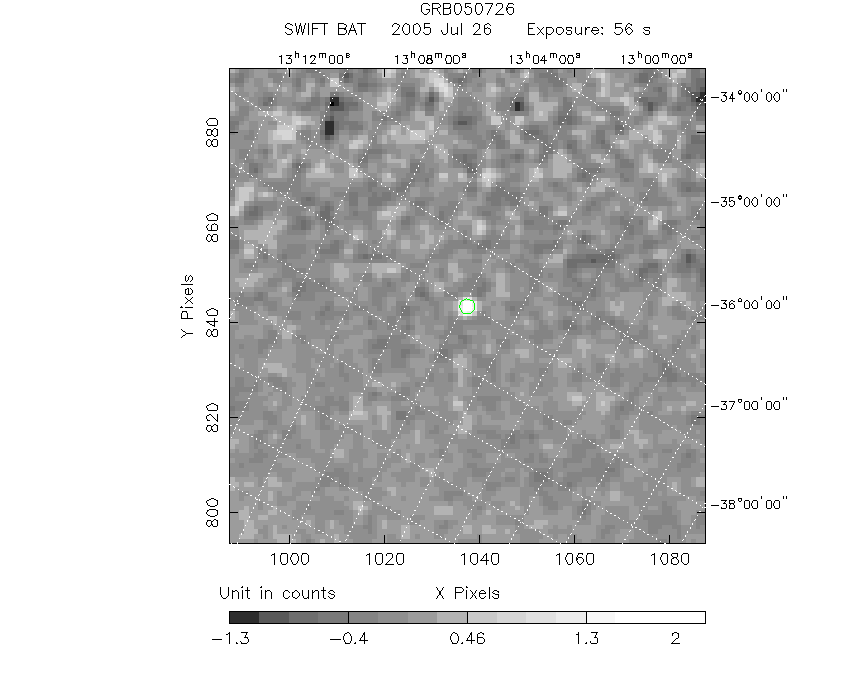
#   RAcent    DECcent   POSerr    Theta     Phi              Peak Cts       SNR   Name
  200.0247   -32.0650   0.0150    39.9949  -113.2832         2.7383070     12.783 TRIG_00147788

Foreground time interval of the image:
-40.832  15.632 (delta_t =  56.464 [sec])
Background time interval of the image:
-299.472 -40.832 (delta_t = 258.640 [sec])
Light Curves
Note: The mask-weighted lightcurves have units of either count/det or counts/sec/det, where a det is 0.4 x 0.4 = 0.16 sq cm.
Full-time range; 1 s binning
Other quick-look light curves:
- 64 ms binning (zoomed)
- 16 ms binning (zoomed)
- 8 ms binning (zoomed)
- 2 ms binning (zoomed)
- SN=5 or 10 s binning (full-time range)
- Raw light curve
Spectra
- 64 ms binning (zoomed)
- 16 ms binning (zoomed)
- 8 ms binning (zoomed)
- 2 ms binning (zoomed)
- SN=5 or 10 s binning (full-time range)
- Raw light curve
Spectra
Notes:
- 1) The fitting includes the systematic errors.
- 2) When the burst includes telescope slew time periods, the fitting uses an average response file made from multiple 5-s response files through out the slew time plus single time preiod for the non-slew times, and weighted by the total counts in the corresponding time period using addrmf. An average response file is needed becuase a spectral fit using the pre-slew DRM will introduce some errors in both a spectral shape and a normalization if the PHA file contains a lot of the slew/post-slew time interval.
- 3) For fits to more complicated models (e.g. a power-law over a cutoff power-law), the BAT team has decided to require a chi-square improvement of more than 6 for each extra dof.
Time averaged spectrum fit using the average DRM
Power-law model
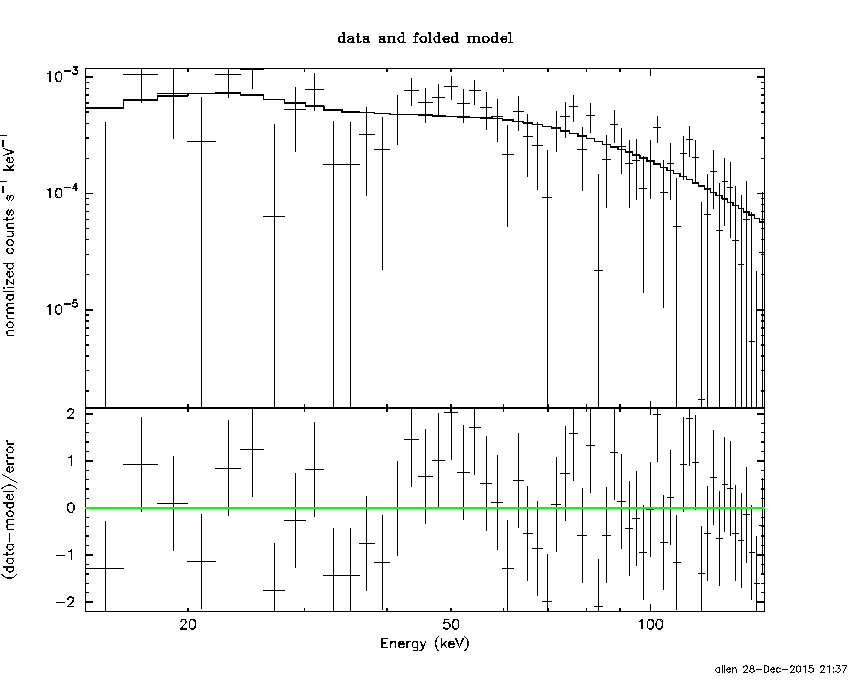
Time interval is from  -40.832 sec. to   15.632 sec.

Spectral model in power-law:
------------------------------------------------------------
Parameters  : value       lower 90%   higher 90%
Photon index: -0.883089     ( -0.197988   0.210093 )
Norm@50keV  : 3.07608E-03    ( -0.000382823   0.000374532 )
------------------------------------------------------------
#Fit statistic : Chi-Squared =          65.95 using 59 PHA bins.
# Reduced chi-squared =          1.157 for     57 degrees of freedom
# Null hypothesis probability =   1.949553e-01

Photon flux (15-150 keV)    in 56.46 sec: 0.353033 ( -0.043119  0.043708 ) ph/cm2/s
Energy fluence (15-150 keV)             : 1.96223e-06 ( -2.13994e-07  2.14227e-07 ) ergs/cm2
Cutoff power-law model
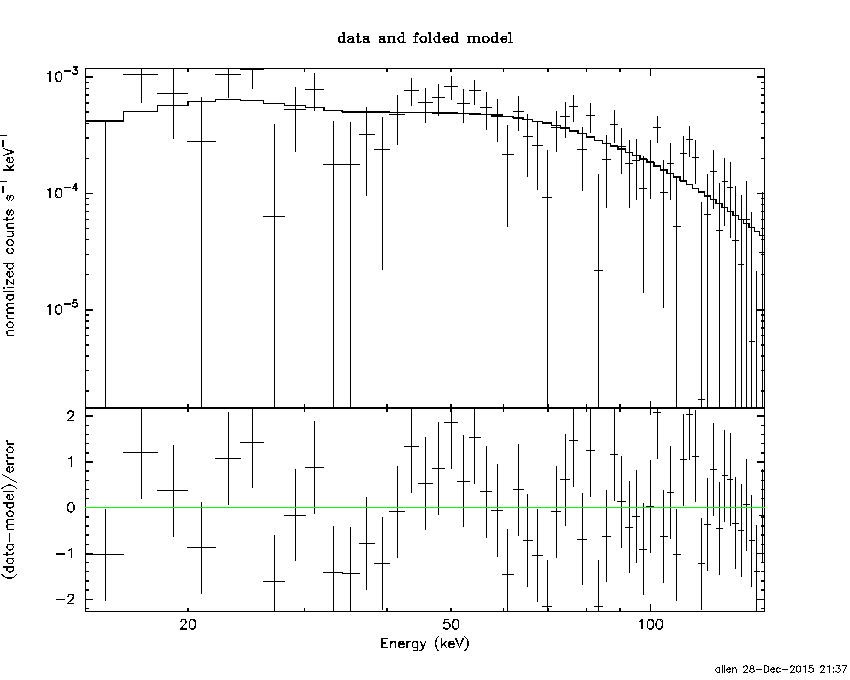
Time interval is from  -40.832 sec. to   15.632 sec.
Spectral model in the cutoff power-law:
------------------------------------------------------------
Parameters  : value       lower 90%   higher 90%
Photon index: -0.273843     ( -0.610278   1.05259 )
Epeak [keV] : 184.037      (   )
Norm@50keV  : 5.26183E-03    (     )
------------------------------------------------------------
#Fit statistic : Chi-Squared =          64.47 using 59 PHA bins.
# Reduced chi-squared =          1.151 for     56 degrees of freedom
# Null hypothesis probability =   2.045038e-01

Photon flux (15-150 keV)    in 56.46 sec: 0.341373 ( -0.045527  0.046393 ) ph/cm2/s
Energy fluence (15-150 keV)             : 1.93046e-06 ( -2.23625e-07  2.2099e-07 ) ergs/cm2
1-s peak spectrum fit
Power-law model
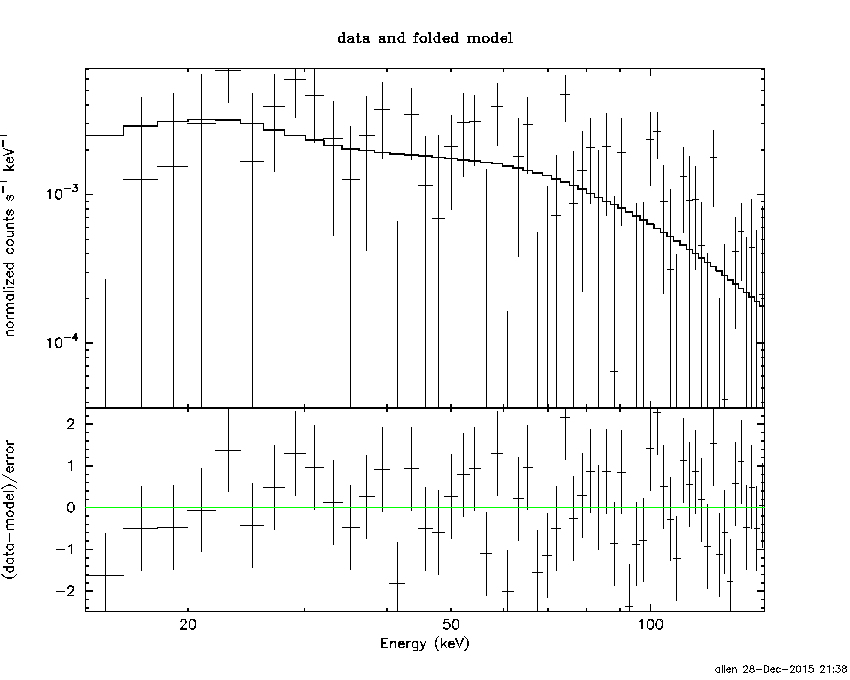
Time interval is from    1.060 sec. to    2.060 sec.

Spectral model in power-law:
------------------------------------------------------------
Parameters  : value       lower 90%   higher 90%
Photon index: -1.06142     ( -0.418868   0.457469 )
Norm@50keV  : 1.18286E-02    ( -0.00305293   0.00297168 )
------------------------------------------------------------
#Fit statistic : Chi-Squared =          63.78 using 59 PHA bins.
# Reduced chi-squared =          1.119 for     57 degrees of freedom
# Null hypothesis probability =   2.503136e-01

Photon flux (15-150 keV)    in 1 sec: 1.36736 ( -0.35986  0.36447 ) ph/cm2/s
Energy fluence (15-150 keV)             : 1.25248e-07 ( -3.13406e-08  3.13874e-08 ) ergs/cm2
Cutoff power-law model

Time interval is from    1.060 sec. to    2.060 sec.
Spectral model in the cutoff power-law:
------------------------------------------------------------
Parameters  : value       lower 90%   higher 90%
Photon index: -1.05974     ( -0.419104   0.46397 )
Epeak [keV] : 9999.36      ( -9999.36 -9999.36 )
Norm@50keV  : 1.18988E-02    ( -0.00154114   0.0432672 )
------------------------------------------------------------
#Fit statistic : Chi-Squared =          63.78 using 59 PHA bins.
# Reduced chi-squared =          1.139 for     56 degrees of freedom
# Null hypothesis probability =   2.217678e-01

Photon flux (15-150 keV)    in 1 sec: 1.36838 ( -0.36145  0.36301 ) ph/cm2/s
Energy fluence (15-150 keV)             : 1.25282e-07 ( -3.17264e-08  3.09248e-08 ) ergs/cm2
Time-resolved spectra
Distribution
T90 vs. Hardness ratio plot
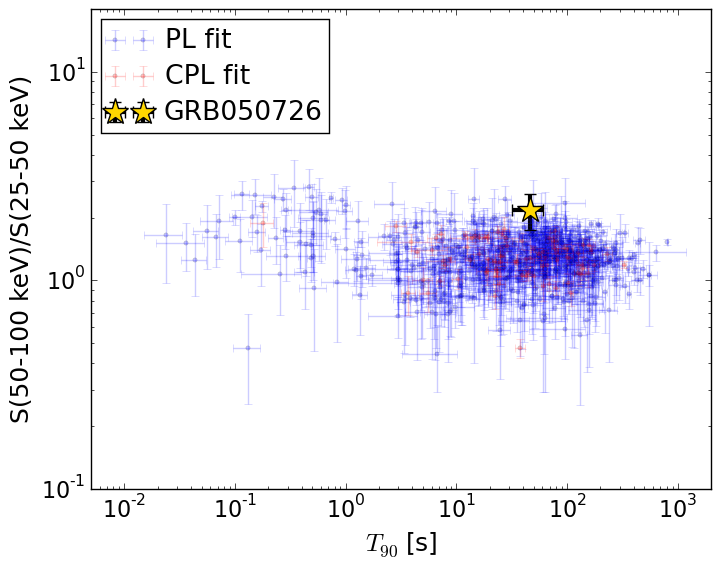
T90                                   = 46.496 sec.
Hardness ratio (energy fluence ratio) = 2.16880215455
S(15-50 keV) vs. S(50-150 keV) plot
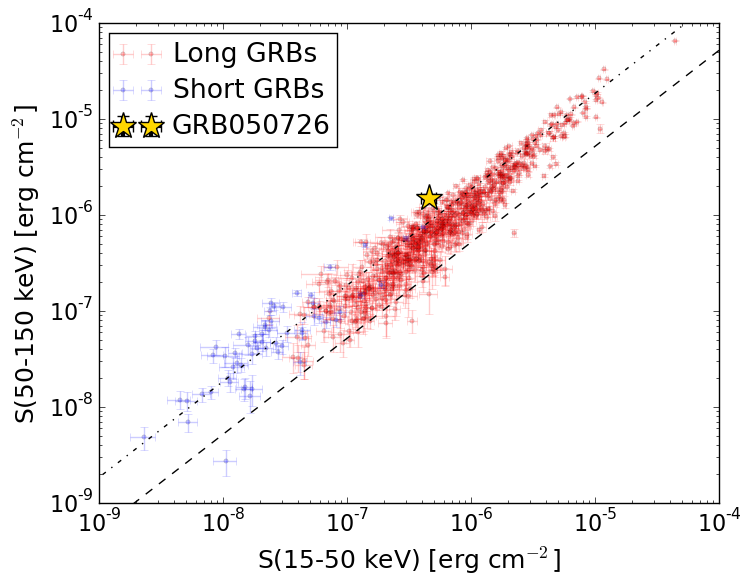
S(15-50 keV)  = 4.605232e-07
S(50-150 keV) = 1.5017327e-06
The dash-dotted line and the dashed line traces the fluences calculated from the Band function with Epeak = 15 and 150 keV, respectively. Both lines assume a canonical values of alpha = -1 and beta = -2.5.
Mask shadow pattern
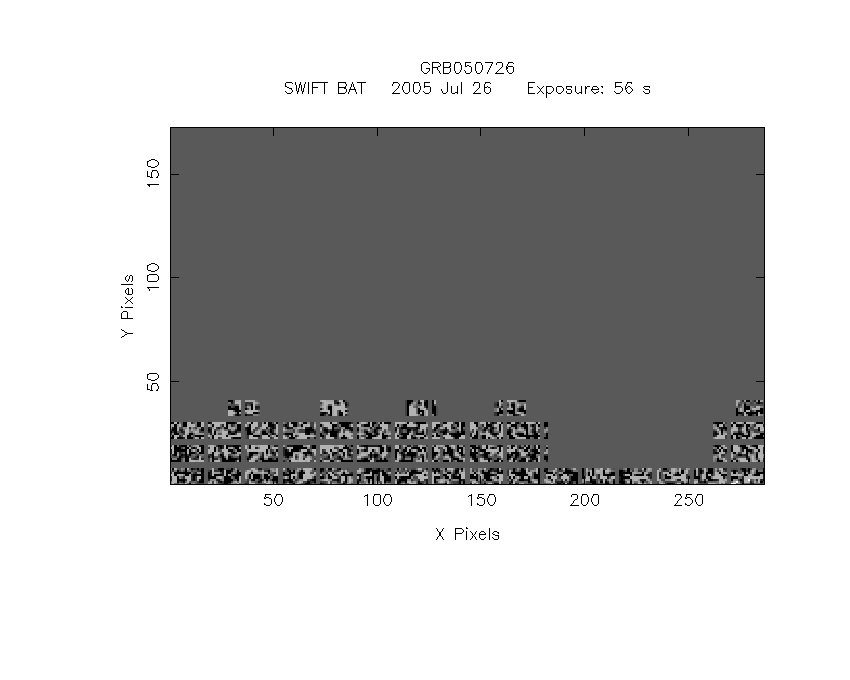
IMX = -3.316159402810754E-01, IMY = 7.706268201810363E-01
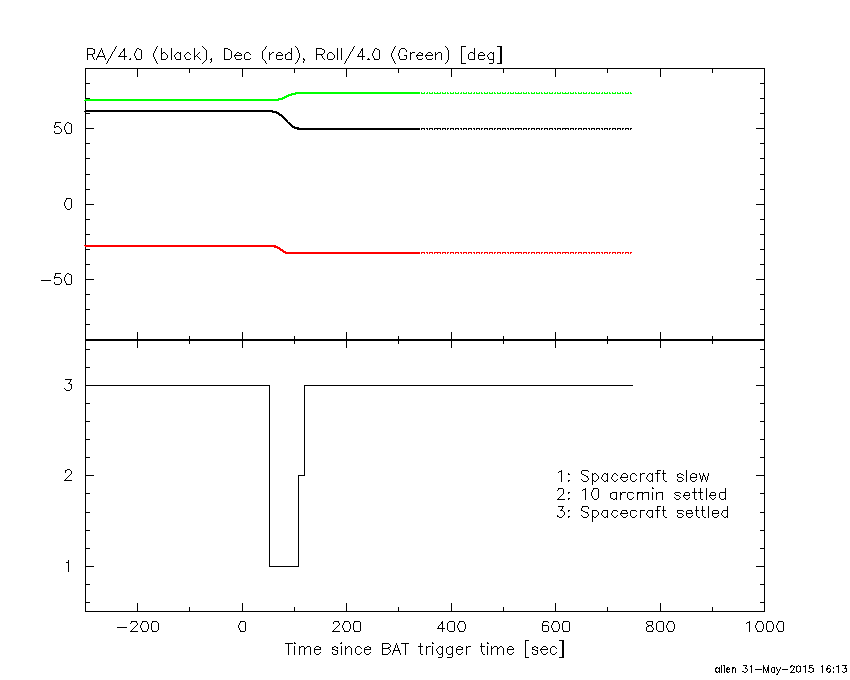
Spacecraft aspect plot
Bright source in the pre-burst/pre-slew/post-slew images
Pre-burst image of 15-350 keV band
Time interval of the image:
-299.472000 -40.832000

# RAcent  DECcent POSerr Theta    Phi  PeakCts   SNR AngSep     Name
#  [deg]    [deg]    ['] [deg]  [deg]                   [']
186.5875 -62.7605    8.3  51.9 -155.1   0.7371   1.4    2.0	GX 301-2
244.9803 -15.6449    0.2  11.9  -10.7   8.9692  47.9    0.3	Sco X-1
256.0002 -37.8312    0.9  13.2  138.6   2.4235  13.0    1.0	4U 1700-377
256.3818 -36.4593    2.5  12.4  133.2   0.8611   4.6    3.4	GX 349+2
263.0204 -24.8838   11.8  15.3   78.7   0.2029   1.0    8.3	GX 1+4
264.6555 -44.5241    2.7  22.5  138.6   0.9915   4.3    5.8	4U 1735-44
268.3878  -1.5044    1.2  33.6   37.8   3.1693  10.0    3.3	SW J1753.5-0127
270.3415 -25.0364    2.0  21.8   83.7   1.2897   5.7    4.0	GX 5-1
270.2053 -25.7436    3.1  21.5   85.5   0.8173   3.8    5.3	GRS 1758-258
273.8598 -14.0798   18.1  29.1   62.9  -0.1874  -0.6    8.9	GX 17+2
275.7775 -30.5275    0.0  26.0   98.5   0.4367   1.7   12.3	H1820-303
284.9280 -24.9264    4.8  34.7   89.5   1.1010   2.4    5.9	HT1900.1-2455
262.8178 -33.9907    0.0  15.7  113.2  -0.3314  -1.5   12.7	GX 354-0
263.9226 -17.3030    3.4  19.3   56.5   0.7158   3.4 ------	UNKNOWN
251.4538 -45.6188    2.4  18.6  163.1   0.8916   4.8 ------	UNKNOWN
250.8211  29.4530    2.1  57.2   -0.4   6.3394   5.5 ------	UNKNOWN
183.7893 -49.7585    3.2  51.8 -138.5   4.4136   3.7 ------	UNKNOWN
206.1042 -10.3397    3.4  41.4  -78.6   3.3516   3.5 ------	UNKNOWN
194.9355 -33.9073    3.3  44.1 -116.7   3.3035   3.5 ------	UNKNOWN
Pre-slew background subtracted image of 15-350 keV band
Time interval of the image:
-40.832000 15.632000

# RAcent  DECcent POSerr Theta    Phi  PeakCts   SNR AngSep     Name
#  [deg]    [deg]    ['] [deg]  [deg]                   [']
186.7086 -62.7682   69.6  51.9 -155.2   0.0340   0.2    1.4	GX 301-2
244.9363 -15.4857    6.4  12.1  -10.9   0.1317   1.8    9.6	Sco X-1
256.1735 -37.8619    5.6  13.3  138.2   0.1546   2.1    8.9	4U 1700-377
256.6197 -36.4401    6.3  12.6  132.6   0.1283   1.8    9.0	GX 349+2
262.9617 -24.7775    4.1  15.3   78.2  -0.2317  -2.8    3.2	GX 1+4
264.8426 -44.5863   46.6  22.7  138.5  -0.0218  -0.2    9.2	4U 1735-44
268.4753  -1.3194    5.4  33.8   37.8   0.2600   2.1   10.3	SW J1753.5-0127
270.4489 -25.0652    9.9  21.9   83.9  -0.1150  -1.2    9.0	GX 5-1
270.3718 -25.6739   41.0  21.7   85.4  -0.0290  -0.3    5.6	GRS 1758-258
273.8554 -14.0485   60.9  29.1   62.8   0.0231   0.2    8.8	GX 17+2
275.9161 -30.3221   49.4  26.1   98.1  -0.0277  -0.2    2.7	H1820-303
284.9455 -24.8124   64.6  34.8   89.3   0.0329   0.2    8.1	HT1900.1-2455
263.0451 -33.6857    7.5  15.8  111.9  -0.1263  -1.5    9.4	GX 354-0
272.0830  -1.8915    2.1  35.7   43.3   0.7461   5.6 ------	UNKNOWN
240.4815  21.3600    2.2  49.2  -12.2   0.8237   5.1 ------	UNKNOWN
214.0982 -11.4012    2.7  34.1  -73.4   0.5623   4.3 ------	UNKNOWN
200.0247 -32.0650    0.9  40.0 -113.3   2.7384  12.8 ------	UNKNOWN
Post-slew image of 15-350 keV band
Time interval of the image:
108.828590 302.577900

# RAcent  DECcent POSerr Theta    Phi  PeakCts   SNR AngSep     Name
#  [deg]    [deg]    ['] [deg]  [deg]                   [']
135.5400 -40.6114    8.2  51.5 -143.5   0.7900   1.4    3.4	Vela X-1
170.6837 -60.6228    4.2  34.4 -179.4  -0.4362  -2.8   10.8	Cen X-3
186.5152 -62.6427    3.4  31.8  167.2   0.5671   3.4    8.6	GX 301-2
244.9690 -15.6360    1.0  43.8   54.3   6.4509  11.7    0.7	Sco X-1
242.3816 -72.8113    2.0  46.2  139.4   2.9147   5.7 ------	UNKNOWN
235.1686 -12.4912    2.9  37.6   42.2   1.0882   4.0 ------	UNKNOWN
231.8839 -40.6145    2.4  26.8   93.0   0.9799   4.8 ------	UNKNOWN
228.3617   2.0218    2.8  43.4   19.0   1.1096   4.1 ------	UNKNOWN
164.4030 -43.1352    2.7  30.1 -146.4   0.6341   4.3 ------	UNKNOWN
132.5305 -39.8684    3.4  53.9 -143.2   3.1122   3.4 ------	UNKNOWN