Analysis Summary
Notes:
- 1) No attempt has been made to eliminate the non-significant decimal places.
- 2) This batgrbproduct analysis is done using the HEASARC data.
- 3) This batgrbproduct analysis is using the flight position for the mask-weighting calculation.
======================================================================
                  BAT GRB EVENT DATA PROCESSING REPORT
    Process Script Ver: batgrbproduct v2.46
    Process Start Time: Wed Jan 22 21:12:19 EST 2014
             Host Name: batevent1
   Current Working Dir: /local/data/batevent/batevent_reproc/trigger148225
======================================================================

  Trigger: 00148225      Segment: 000

  BAT Trigger Time: 144446302.848   [s; MET]
      Trigger Stop: 144446315.008   [s; MET]
               UTC: 2005-07-30T19:58:23.199020    [includes UTCF correction]
       Where From?: TDRSS position message

  BAT
    RA: 212.065218990972   Dec: -3.76180048165143  [deg; J2000]

     Catalogged Source?: NO
     Point Source?:      YES
     GRB Indicated?:     YES    [ by BAT flight software ]
     Image S/N Ratio:    10.96
     Image Trigger?:     NO
     Rate S/N Ratio:     11.9582607431014  [ if not an image trigger ]
     Image S/N Ratio:    10.96

  Analysis Position:   [ source = BAT ]
    RA: 212.065218990972   Dec: -3.76180048165143  [deg; J2000]

  Refined Position:   [ source = BAT pre-slew burst ]
    RA: 212.0697712947   Dec: -3.75555880596109  [deg; J2000]
        { 14h 08m 16.7s , -03d 45' 20.0" }
         +/- 1.39259072249629 [arcmin] (estimated 90% radius based on SNR)
         +/- 0.532037292808464 [arcmin] (formal 1-sigma fit error)
    SNR: 18.9520520566148

  Angular difference between the analysis and refined position is 0.463179 arcmin

  Partial Coding Fraction: 0.78125    [ including projection effects ]

  Duration
     T90: 154.600000023842 +/- 18.6152239866037
        Measured from: -44.7360000014305
                   to: 109.864000022411     [s; relative to TRIGTIME]
     T50: 59.7199999988079 +/- 12.5603472995008
        Measured from: -6.73999997973442
                   to: 52.9800000190735     [s; relative to TRIGTIME]


  Fluence
     Peak Flux  (peak 1 second)
        Measured from: 5.02799999713898
                   to: 6.02799999713898     [s; relative to TRIGTIME]
     Total Fluence
        Measured from: -57.2679999768734
                   to: 120.516000002623     [s; relative to TRIGTIME]

             Band 1     Band 2     Band 3     Band 4
              15-25      25-50     50-100    100-350     keV
 Total     1.068370   1.399946   1.077556   0.315862
           0.069507   0.071926   0.064047   0.058421 [error]
 Peak      0.019661   0.021891   0.022095   0.011072
           0.005617   0.005784   0.005322   0.004713 [error]

     [ fluence units of on-axis counts / fully illuminated detector ]

======================================================================


====== Table of the duration information =============================

        Value   tstart    tstop
T100  177.784  -57.268  120.516
T90   154.600  -44.736  109.864
T50    59.720   -6.740   52.980
Peak    1.000    5.028    6.028


====== Spectral Analysis Summary =====================================

Model      : spectral model: simple power-law (PL) and cutoff power-law (CPL)
Ph_index   : photon index: E^{Ph_index}
Ph_90err   : 90% error of the photon index
Epeak      : Epeak in keV
Epeak_90err: 90% error of Epeak
Norm       : normalization at 50 keV in both the PL model and CPL model
Nomr_90err : 90% error of the normalization
chi2       : Chi-Squared
dof        : degree of freedo

=== Time-averaged spectral analysis ===
(Best model with acceptable fit: PL)

Model Ph_index Ph_90err_low Ph_90err_hi  Epeak  Epeak_90err_low  Epeak_90err_hi  Norm       Nomr_90err_low    Norm_90err_hi    chi2    dof
PL      -1.512    -0.108      0.107       -           -               -         1.40e-03     -8.21e-05          8.19e-05      38.270   57
CPL     -1.473    -0.145      0.346      704.774    -704.774      -704.774      1.47e-03     -3.61e-04          6.65e-04      38.320   56


=== 1-s peak spectral analysis ===
(Best model with acceptable fit: PL)

Model Ph_index Ph_90err_low Ph_90err_hi  Epeak  Epeak_90err_low  Epeak_90err_hi  Norm       Nomr_90err_low    Norm_90err_hi    chi2    dof
PL      -1.316     -0.449     0.457       -           -               -         4.67e-03     -1.14e-03          1.13e-03      42.160   57
CPL     -1.310     -0.454     1.107     9999.360    -9999.360      -9999.360      4.69e-03     -1.15e-03          1.63e-02      42.160   56


=== Fluence/Peak Flux Summary ===

              Model    Band1     Band2     Band3     Band4     Band5     Total
                       15-25     25-50    50-100    100-350    15-150    15-350    keV
Fluence         PL   3.22e-07  5.88e-07  8.25e-07  2.42e-06  2.36e-06  4.16e-06   erg/cm2
      90%_error_low -3.32e-08 -3.61e-08 -6.36e-08 -3.90e-07 -1.51e-07 -4.38e-07   erg/cm2
      90%_error_hi   3.43e-08  3.59e-08  6.34e-08  4.39e-07  1.52e-07  4.78e-07   erg/cm2
Peak flux       PL   1.61e-01  1.81e-01  1.45e-01  1.94e-01  5.59e-01  6.82e-01   ph/cm2/s
      90%_error_low -6.88e-02 -5.09e-02 -4.40e-02 -1.00e-01 -1.38e-01 -1.70e-01   ph/cm2/s
      90%_error_hi   7.80e-02  4.88e-02  4.26e-02  1.53e-01  1.39e-01  1.76e-01   ph/cm2/s

Fluence        CPL   3.23e-07  5.88e-07  8.24e-07  2.46e-06  2.37e-06  4.00e-06   erg/cm2
      90%_error_low -3.48e-08 -3.55e-08 -6.39e-08 -1.09e-06 -1.69e-07 -9.02e-07   erg/cm2
      90%_error_hi   3.42e-08  4.09e-08  6.84e-08  2.07e-07  1.50e-07  6.18e-07   erg/cm2
Peak flux      CPL   1.66e-01  1.81e-01  1.44e-01  2.10e-01  5.62e-01  6.83e-01   ph/cm2/s
      90%_error_low     N/A   -5.10e-02 -2.41e-02     N/A       N/A   -3.01e-01   ph/cm2/s
      90%_error_hi      N/A    4.90e-02  4.68e-02     N/A       N/A    1.59e-01   ph/cm2/s

======================================================================
Image
Pre-slew 15.0-350.0 keV image (Event data)

#   RAcent    DECcent   POSerr    Theta     Phi              Peak Cts       SNR   Name
  212.0698    -3.7556   0.0101    30.4540    -2.3920         2.6736791     18.952 TRIG_00148225

Foreground time interval of the image:
-57.268  56.653 (delta_t = 113.921 [sec])
Background time interval of the image:
-254.347 -57.268 (delta_t = 197.079 [sec])
Light Curves
Note: The mask-weighted lightcurves have units of either count/det or counts/sec/det, where a det is 0.4 x 0.4 = 0.16 sq cm.
Full-time range; 1 s binning
Other quick-look light curves:
- 64 ms binning (zoomed)
- 16 ms binning (zoomed)
- 8 ms binning (zoomed)
- 2 ms binning (zoomed)
- SN=5 or 10 s binning (full-time range)
- Raw light curve
Spectra
- 64 ms binning (zoomed)
- 16 ms binning (zoomed)
- 8 ms binning (zoomed)
- 2 ms binning (zoomed)
- SN=5 or 10 s binning (full-time range)
- Raw light curve
Spectra
Notes:
- 1) The fitting includes the systematic errors.
- 2) When the burst includes telescope slew time periods, the fitting uses an average response file made from multiple 5-s response files through out the slew time plus single time preiod for the non-slew times, and weighted by the total counts in the corresponding time period using addrmf. An average response file is needed becuase a spectral fit using the pre-slew DRM will introduce some errors in both a spectral shape and a normalization if the PHA file contains a lot of the slew/post-slew time interval.
- 3) For fits to more complicated models (e.g. a power-law over a cutoff power-law), the BAT team has decided to require a chi-square improvement of more than 6 for each extra dof.
Time averaged spectrum fit using the average DRM
Power-law model

Time interval is from  -57.268 sec. to  120.516 sec.

Spectral model in power-law:
------------------------------------------------------------
Parameters  : value       lower 90%   higher 90%
Photon index: -1.5115     ( -0.107704   0.107183 )
Norm@50keV  : 1.40350E-03    ( -8.21461e-05   8.19085e-05 )
------------------------------------------------------------
#Fit statistic : Chi-Squared =          38.27 using 59 PHA bins.
# Reduced chi-squared =         0.6714 for     57 degrees of freedom
# Null hypothesis probability =   9.732177e-01

Photon flux (15-150 keV)    in 177.8 sec: 0.175764 ( -0.010442  0.010471 ) ph/cm2/s
Energy fluence (15-150 keV)             : 2.36321e-06 ( -1.51381e-07  1.52332e-07 ) ergs/cm2
Cutoff power-law model

Time interval is from  -57.268 sec. to  120.516 sec.
Spectral model in the cutoff power-law:
------------------------------------------------------------
Parameters  : value       lower 90%   higher 90%
Photon index: -1.50899     ( -0.141099   0.350469 )
Epeak [keV] : 9998.92      ( -9998.96 -9998.96 )
Norm@50keV  : 1.40760E-03    ( -0.000302741   0.000723256 )
------------------------------------------------------------
#Fit statistic : Chi-Squared =          38.27 using 59 PHA bins.
# Reduced chi-squared =         0.6834 for     56 degrees of freedom
# Null hypothesis probability =   9.663365e-01

Photon flux (15-150 keV)    in 177.8 sec: 0.175925 ( -0.011119  0.010441 ) ph/cm2/s
Energy fluence (15-150 keV)             : 2.36566e-06 ( -1.69313e-07  1.50342e-07 ) ergs/cm2
1-s peak spectrum fit
Power-law model

Time interval is from    5.028 sec. to    6.028 sec.

Spectral model in power-law:
------------------------------------------------------------
Parameters  : value       lower 90%   higher 90%
Photon index: -1.31635     ( -0.449044   0.456998 )
Norm@50keV  : 4.67045E-03    ( -0.00113779   0.00113356 )
------------------------------------------------------------
#Fit statistic : Chi-Squared =          42.16 using 59 PHA bins.
# Reduced chi-squared =         0.7396 for     57 degrees of freedom
# Null hypothesis probability =   9.291146e-01

Photon flux (15-150 keV)    in 1 sec: 0.558916 ( -0.138339  0.138824 ) ph/cm2/s
Energy fluence (15-150 keV)             : 4.59769e-08 ( -1.24958e-08  1.2718e-08 ) ergs/cm2
Cutoff power-law model

Time interval is from    5.028 sec. to    6.028 sec.
Spectral model in the cutoff power-law:
------------------------------------------------------------
Parameters  : value       lower 90%   higher 90%
Photon index: -1.31025     ( -0.453688   1.10679 )
Epeak [keV] : 9999.36      ( -9999.36 -9999.36 )
Norm@50keV  : 4.69024E-03    ( -0.00114791   0.0162998 )
------------------------------------------------------------
#Fit statistic : Chi-Squared =          42.16 using 59 PHA bins.
# Reduced chi-squared =         0.7529 for     56 degrees of freedom
# Null hypothesis probability =   9.146155e-01

Photon flux (15-150 keV)    in 1 sec: 0.562000 (    ) ph/cm2/s
Energy fluence (15-150 keV)             : 4.62221e-08 ( -1.36467e-08  9.08234e-09 ) ergs/cm2
Time-resolved spectra

Distribution
T90 vs. Hardness ratio plot
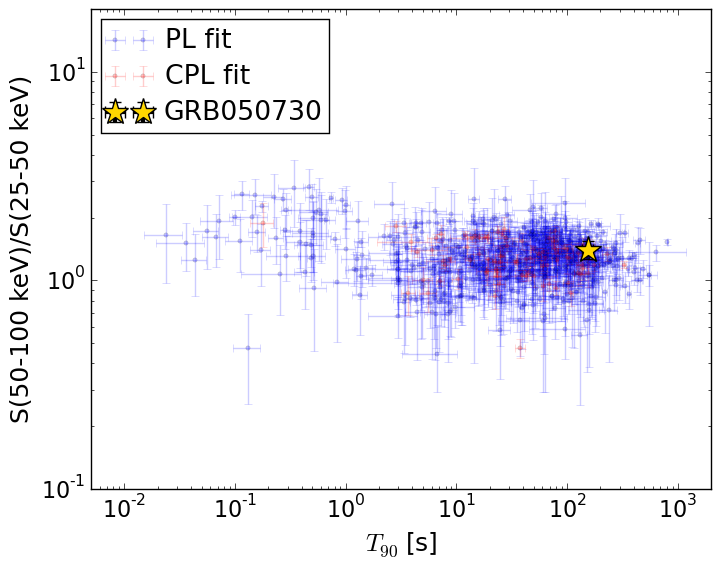
T90                                   = 154.6 sec.
Hardness ratio (energy fluence ratio) = 1.40300751138
S(15-50 keV) vs. S(50-150 keV) plot

S(15-50 keV)  = 9.098225e-07
S(50-150 keV) = 1.4533914e-06
The dash-dotted line and the dashed line traces the fluences calculated from the Band function with Epeak = 15 and 150 keV, respectively. Both lines assume a canonical values of alpha = -1 and beta = -2.5.
Mask shadow pattern

IMX = 5.874521859743349E-01, IMY = 2.453893817882704E-02
Spacecraft aspect plot

Bright source in the pre-burst/pre-slew/post-slew images
Pre-burst image of 15-350 keV band
Time interval of the image:
-254.347410 -57.268000

# RAcent  DECcent POSerr Theta    Phi  PeakCts   SNR AngSep     Name
#  [deg]    [deg]    ['] [deg]  [deg]                   [']
135.5301 -40.5709    1.1  51.5 -145.5   4.7397  10.2    1.0	Vela X-1
170.1230 -60.5415   10.5  34.6  179.0  -0.2112  -1.1    7.5	Cen X-3
186.5798 -62.9268    3.3  32.0  164.9   0.6300   3.5    9.6	GX 301-2
244.9661 -15.6617    1.3  43.8   52.3   5.3775   9.0    1.5	Sco X-1
135.5268 -70.2380    3.2  51.5  176.4   1.5049   3.6 ------	UNKNOWN
166.6520 -29.9514    2.4  28.6 -121.3   0.7788   4.7 ------	UNKNOWN
194.7124  13.3726    2.6  45.7  -33.9   1.3257   4.4 ------	UNKNOWN
Pre-slew background subtracted image of 15-350 keV band
Time interval of the image:
-57.268000 56.652590

# RAcent  DECcent POSerr Theta    Phi  PeakCts   SNR AngSep     Name
#  [deg]    [deg]    ['] [deg]  [deg]                   [']
135.5178 -40.5899    2.5  51.5 -145.5  -1.9811  -4.7    2.2	Vela X-1
170.0558 -60.6639    7.1  34.7  178.9   0.2513   1.6    8.0	Cen X-3
186.7211 -62.9377   15.8  32.0  164.8  -0.1070  -0.7   10.2	GX 301-2
245.0555 -15.7930    8.2  43.9   52.6  -0.7162  -1.4   10.2	Sco X-1
212.0698  -3.7556    0.6  30.5   -2.4   2.6738  19.0 ------	UNKNOWN
Post-slew image of 15-350 keV band
Time interval of the image:
106.452600 302.218200

# RAcent  DECcent POSerr Theta    Phi  PeakCts   SNR AngSep     Name
#  [deg]    [deg]    ['] [deg]  [deg]                   [']
244.9961 -15.6317    0.7  34.5   93.5   5.8330  16.2    1.1	Sco X-1
234.7295   3.9216    2.2  23.9   52.6   0.8749   5.2 ------	UNKNOWN
212.0519  -3.8109    1.7   0.1 -164.3   0.9251   6.8 ------	UNKNOWN
183.7376   5.8206    3.0  29.9  -90.4   0.8200   3.8 ------	UNKNOWN