Analysis Summary
Notes:
- 1) No attempt has been made to eliminate the non-significant decimal places.
- 2) This batgrbproduct analysis is done using the HEASARC data.
- 3) This batgrbproduct analysis is using the flight position for the mask-weighting calculation.
======================================================================
                  BAT GRB EVENT DATA PROCESSING REPORT
    Process Script Ver: batgrbproduct v2.46
    Process Start Time: Wed Jan 22 21:09:35 EST 2014
             Host Name: batevent1
   Current Working Dir: /local/data/batevent/batevent_reproc/trigger148522
======================================================================

  Trigger: 00148522      Segment: 000

  BAT Trigger Time: 144613681.728   [s; MET]
      Trigger Stop: 144613682.24   [s; MET]
               UTC: 2005-08-01T18:28:02.075720    [includes UTCF correction]
       Where From?: TDRSS position message

  BAT
    RA: 204.139119695272   Dec: -21.9501095764615  [deg; J2000]

     Catalogged Source?: NO
     Point Source?:      YES
     GRB Indicated?:     YES    [ by BAT flight software ]
     Image S/N Ratio:    10.25
     Image Trigger?:     NO
     Rate S/N Ratio:     19.672315572906  [ if not an image trigger ]
     Image S/N Ratio:    10.25

  Analysis Position:   [ source = BAT ]
    RA: 204.139119695272   Dec: -21.9501095764615  [deg; J2000]

  Refined Position:   [ source = BAT pre-slew burst ]
    RA: 204.144266415387   Dec: -21.9331605862157  [deg; J2000]
        { 13h 36m 34.6s , -21d 55' 59.4" }
         +/- 1.5618438448739 [arcmin] (estimated 90% radius based on SNR)
         +/- 0.664480938154622 [arcmin] (formal 1-sigma fit error)
    SNR: 16.0876727080037

  Angular difference between the analysis and refined position is 1.056509 arcmin

  Partial Coding Fraction: 0.9765625    [ including projection effects ]

  Duration
     T90: 19.5680000185966 +/- 5.9376951878218
        Measured from: 0.19200000166893
                   to: 19.7600000202656     [s; relative to TRIGTIME]
     T50: 6.98000001907349 +/- 4.26402442339734
        Measured from: 0.888000011444092
                   to: 7.86800003051758     [s; relative to TRIGTIME]


  Fluence
     Peak Flux  (peak 1 second)
        Measured from: 0.0520000159740448
                   to: 1.05200001597404     [s; relative to TRIGTIME]
     Total Fluence
        Measured from: 0.0520000159740448
                   to: 25.688000023365     [s; relative to TRIGTIME]

             Band 1     Band 2     Band 3     Band 4
              15-25      25-50     50-100    100-350     keV
 Total     0.222479   0.234359   0.102946   0.046348
           0.024023   0.024547   0.022041   0.020909 [error]
 Peak      0.043386   0.066541   0.057419   0.009739
           0.005415   0.005748   0.005173   0.004290 [error]

     [ fluence units of on-axis counts / fully illuminated detector ]

======================================================================


====== Table of the duration information =============================

        Value   tstart    tstop
T100   25.636    0.052   25.688
T90    19.568    0.192   19.760
T50     6.980    0.888    7.868
Peak    1.000    0.052    1.052


====== Spectral Analysis Summary =====================================

Model      : spectral model: simple power-law (PL) and cutoff power-law (CPL)
Ph_index   : photon index: E^{Ph_index}
Ph_90err   : 90% error of the photon index
Epeak      : Epeak in keV
Epeak_90err: 90% error of Epeak
Norm       : normalization at 50 keV in both the PL model and CPL model
Nomr_90err : 90% error of the normalization
chi2       : Chi-Squared
dof        : degree of freedo

=== Time-averaged spectral analysis ===
(Best model with acceptable fit: PL)

Model Ph_index Ph_90err_low Ph_90err_hi  Epeak  Epeak_90err_low  Epeak_90err_hi  Norm       Nomr_90err_low    Norm_90err_hi    chi2    dof
PL      -1.996    -0.252      0.236       -           -               -         1.31e-03     -2.15e-04          2.09e-04      56.820   57
CPL     -2.035    -0.095      1.112       36.063      N/A           N/A         1.24e-03        N/A               N/A         56.810   56


=== 1-s peak spectral analysis ===
(Best model with acceptable fit: PL)

Model Ph_index Ph_90err_low Ph_90err_hi  Epeak  Epeak_90err_low  Epeak_90err_hi  Norm       Nomr_90err_low    Norm_90err_hi    chi2    dof
PL      -1.380     -0.158     0.158       -           -               -         1.21e-02     -1.12e-03          1.11e-03      63.330   57
CPL     -1.106     -0.356     0.668      167.063    -167.063      -167.063      1.66e-02     -5.42e-03          1.82e-02      62.720   56


=== Fluence/Peak Flux Summary ===

              Model    Band1     Band2     Band3     Band4     Band5     Total
                       15-25     25-50    50-100    100-350    15-150    15-350    keV
Fluence         PL   6.83e-08  9.29e-08  9.31e-08  1.69e-07  3.09e-07  4.23e-07   erg/cm2
      90%_error_low -1.14e-08 -1.14e-08 -2.08e-08 -6.45e-08 -4.68e-08 -9.01e-08   erg/cm2
      90%_error_hi   1.17e-08  1.13e-08  2.15e-08  8.78e-08  4.84e-08  1.09e-07   erg/cm2
Peak flux       PL   4.44e-01  4.80e-01  3.69e-01  4.64e-01  1.47e+00  1.76e+00   ph/cm2/s
      90%_error_low -6.99e-02 -4.77e-02 -4.22e-02 -1.01e-01 -1.35e-01 -1.65e-01   ph/cm2/s
      90%_error_hi   7.31e-02  4.73e-02  4.18e-02  1.17e-01  1.35e-01  1.67e-01   ph/cm2/s

Fluence        CPL   6.84e-08  9.24e-08  9.34e-08  1.85e-07  3.11e-07  4.33e-07   erg/cm2
      90%_error_low -1.27e-08 -1.80e-08 -2.09e-08 -1.61e-07 -6.08e-08 -1.74e-07   erg/cm2
      90%_error_hi   1.17e-08  1.61e-08  1.29e-08  5.43e-08  4.08e-08  9.23e-08   erg/cm2
Peak flux      CPL   4.22e-01  4.93e-01  3.78e-01  3.37e-01  1.45e+00  1.63e+00   ph/cm2/s
      90%_error_low -8.48e-02 -5.44e-02 -4.67e-02 -1.63e-01 -1.40e-01 -2.24e-01   ph/cm2/s
      90%_error_hi   8.41e-02  5.60e-02  4.80e-02  1.61e-01  1.40e-01  2.68e-01   ph/cm2/s

======================================================================
Image
Pre-slew 15.0-350.0 keV image (Event data)
#   RAcent    DECcent   POSerr    Theta     Phi              Peak Cts       SNR   Name
  204.1443   -21.9332   0.0120    19.7112  -176.2057         0.4792209     16.088 TRIG_00148522

Foreground time interval of the image:
  0.052   9.973 (delta_t =   9.921 [sec])
Background time interval of the image:
-299.728   0.052 (delta_t = 299.780 [sec])
Light Curves
Note: The mask-weighted lightcurves have units of either count/det or counts/sec/det, where a det is 0.4 x 0.4 = 0.16 sq cm.
Full-time range; 1 s binning
Other quick-look light curves:
- 64 ms binning (zoomed)
- 16 ms binning (zoomed)
- 8 ms binning (zoomed)
- 2 ms binning (zoomed)
- SN=5 or 10 s binning (full-time range)
- Raw light curve
Spectra
- 64 ms binning (zoomed)
- 16 ms binning (zoomed)
- 8 ms binning (zoomed)
- 2 ms binning (zoomed)
- SN=5 or 10 s binning (full-time range)
- Raw light curve
Spectra
Notes:
- 1) The fitting includes the systematic errors.
- 2) When the burst includes telescope slew time periods, the fitting uses an average response file made from multiple 5-s response files through out the slew time plus single time preiod for the non-slew times, and weighted by the total counts in the corresponding time period using addrmf. An average response file is needed becuase a spectral fit using the pre-slew DRM will introduce some errors in both a spectral shape and a normalization if the PHA file contains a lot of the slew/post-slew time interval.
- 3) For fits to more complicated models (e.g. a power-law over a cutoff power-law), the BAT team has decided to require a chi-square improvement of more than 6 for each extra dof.
Time averaged spectrum fit using the average DRM
Power-law model

Time interval is from    0.052 sec. to   25.688 sec.

Spectral model in power-law:
------------------------------------------------------------
Parameters  : value       lower 90%   higher 90%
Photon index: -1.99585     ( -0.252487   0.235874 )
Norm@50keV  : 1.30627E-03    ( -0.000215471   0.000208924 )
------------------------------------------------------------
#Fit statistic : Chi-Squared =          56.82 using 59 PHA bins.
# Reduced chi-squared =         0.9968 for     57 degrees of freedom
# Null hypothesis probability =   4.818199e-01

Photon flux (15-150 keV)    in 25.64 sec: 0.195581 ( -0.023364  0.023365 ) ph/cm2/s
Energy fluence (15-150 keV)             : 3.08849e-07 ( -4.67848e-08  4.83973e-08 ) ergs/cm2
Cutoff power-law model
Time interval is from    0.052 sec. to   25.688 sec.
Spectral model in the cutoff power-law:
------------------------------------------------------------
Parameters  : value       lower 90%   higher 90%
Photon index: -2.0346     ( -0.0947001   1.11202 )
Epeak [keV] : 36.0634      (   )
Norm@50keV  : 1.23899E-03    (     )
------------------------------------------------------------
#Fit statistic : Chi-Squared =          56.81 using 59 PHA bins.
# Reduced chi-squared =          1.015 for     56 degrees of freedom
# Null hypothesis probability =   4.444954e-01

Photon flux (15-150 keV)    in 25.64 sec: 0.195922 ( -0.0243  0.02351 ) ph/cm2/s
Energy fluence (15-150 keV)             : 3.10554e-07 ( -6.07914e-08  4.07699e-08 ) ergs/cm2
1-s peak spectrum fit
Power-law model
Time interval is from    0.052 sec. to    1.052 sec.

Spectral model in power-law:
------------------------------------------------------------
Parameters  : value       lower 90%   higher 90%
Photon index: -1.37957     ( -0.158144   0.157736 )
Norm@50keV  : 1.21129E-02    ( -0.00111622   0.00111276 )
------------------------------------------------------------
#Fit statistic : Chi-Squared =          63.33 using 59 PHA bins.
# Reduced chi-squared =          1.111 for     57 degrees of freedom
# Null hypothesis probability =   2.629614e-01

Photon flux (15-150 keV)    in 1 sec: 1.46845 ( -0.13515  0.13528 ) ph/cm2/s
Energy fluence (15-150 keV)             : 1.17557e-07 ( -1.20867e-08  1.22117e-08 ) ergs/cm2
Cutoff power-law model
Time interval is from    0.052 sec. to    1.052 sec.
Spectral model in the cutoff power-law:
------------------------------------------------------------
Parameters  : value       lower 90%   higher 90%
Photon index: -1.10627     ( -0.355672   0.668448 )
Epeak [keV] : 167.063      ( -167.063 -167.063 )
Norm@50keV  : 1.65875E-02    ( -0.00541676   0.0182193 )
------------------------------------------------------------
#Fit statistic : Chi-Squared =          62.72 using 59 PHA bins.
# Reduced chi-squared =          1.120 for     56 degrees of freedom
# Null hypothesis probability =   2.501947e-01

Photon flux (15-150 keV)    in 1 sec: 1.45201 ( -0.14039  0.13983 ) ph/cm2/s
Energy fluence (15-150 keV)             : 1.15239e-07 ( -1.32226e-08  1.31773e-08 ) ergs/cm2
Time-resolved spectra
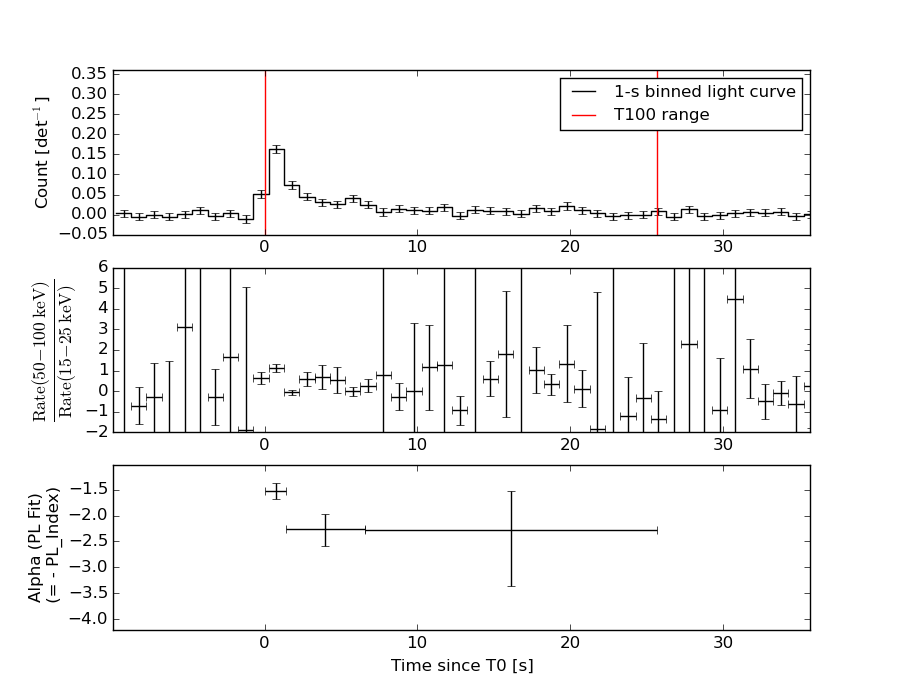
Distribution
T90 vs. Hardness ratio plot
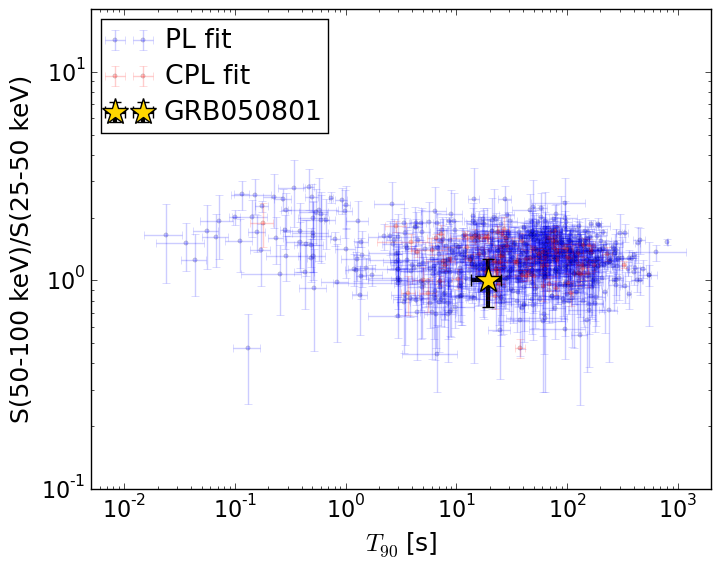
T90                                   = 19.568 sec.
Hardness ratio (energy fluence ratio) = 1.00290541271
S(15-50 keV) vs. S(50-150 keV) plot
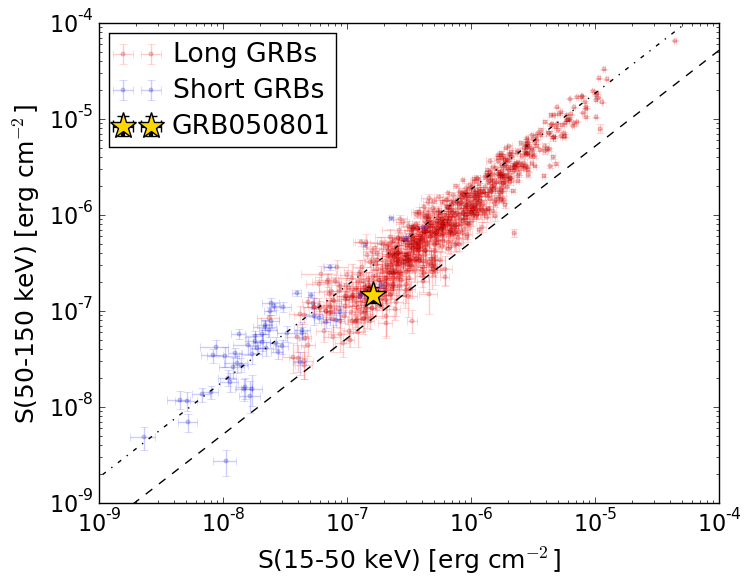
S(15-50 keV)  = 1.6112586e-07
S(50-150 keV) = 1.4772566e-07
The dash-dotted line and the dashed line traces the fluences calculated from the Band function with Epeak = 15 and 150 keV, respectively. Both lines assume a canonical values of alpha = -1 and beta = -2.5.
Mask shadow pattern
IMX = -3.574877451686499E-01, IMY = 2.370835440290589E-02
Spacecraft aspect plot
Bright source in the pre-burst/pre-slew/post-slew images
Pre-burst image of 15-350 keV band
Time interval of the image:
-299.728000 0.052000

# RAcent  DECcent POSerr Theta    Phi  PeakCts   SNR AngSep     Name
#  [deg]    [deg]    ['] [deg]  [deg]                   [']
244.9891 -15.6409    0.7  34.5   93.9  10.1188  17.4    0.6	Sco X-1
216.1827  17.4993    3.0  21.7   -7.8   0.9031   3.9 ------	UNKNOWN
198.1943  -4.7323    3.2  13.9 -112.9   0.8049   3.6 ------	UNKNOWN
206.4026  49.4060    3.6  53.4  -23.0   2.2253   3.2 ------	UNKNOWN
197.1370  46.4157    3.1  51.9  -31.5   3.0248   3.7 ------	UNKNOWN
181.2822  22.2274    4.5  39.8  -66.2   1.9274   2.6 ------	UNKNOWN
164.9354 -18.4378    3.3  48.3 -129.9   3.8492   3.5 ------	UNKNOWN
Pre-slew background subtracted image of 15-350 keV band
Time interval of the image:
0.052000 9.972600

# RAcent  DECcent POSerr Theta    Phi  PeakCts   SNR AngSep     Name
#  [deg]    [deg]    ['] [deg]  [deg]                   [']
244.8953 -15.7497    5.4  34.4   94.2   0.1473   2.2    8.2	Sco X-1
241.6667 -12.2938    2.3  30.5   89.5   0.2593   5.0 ------	UNKNOWN
204.1435 -21.9334    0.7  19.7 -176.2   0.4813  16.2 ------	UNKNOWN
163.7302 -25.6161    2.8  51.2 -138.7   0.5664   4.1 ------	UNKNOWN
Post-slew image of 15-350 keV band
Time interval of the image:
50.172600 302.352800

# RAcent  DECcent POSerr Theta    Phi  PeakCts   SNR AngSep     Name
#  [deg]    [deg]    ['] [deg]  [deg]                   [']
170.2177 -60.6191    3.4  45.3  179.2   1.1225   3.4    2.9	Cen X-3
186.5832 -62.6354    3.8  42.4  168.4   0.9532   3.0    8.3	GX 301-2
244.9886 -15.6652    0.8  39.1   64.6   8.7116  14.4    1.6	Sco X-1
150.9748 -26.4346    3.1  48.4 -129.9   2.9577   3.8 ------	UNKNOWN