Analysis Summary
Notes:
- 1) No attempt has been made to eliminate the non-significant decimal places.
- 2) This batgrbproduct analysis is done using the HEASARC data.
- 3) This batgrbproduct analysis is using the flight position for the mask-weighting calculation.
======================================================================
BAT GRB EVENT DATA PROCESSING REPORT
Process Script Ver: batgrbproduct v2.46
Process Start Time: Wed Jan 22 21:00:12 EST 2014
Host Name: batevent1
Current Working Dir: /local/data/batevent/batevent_reproc/trigger150139
======================================================================
Trigger: 00150139 Segment: 000
BAT Trigger Time: 145608309.44 [s; MET]
Trigger Stop: 145608309.952 [s; MET]
UTC: 2005-08-13T06:45:09.768120 [includes UTCF correction]
Where From?: TDRSS position message
BAT
RA: 242.009891218405 Dec: 11.2520458868854 [deg; J2000]
Catalogged Source?: NO
Point Source?: YES
GRB Indicated?: YES [ by BAT flight software ]
Image S/N Ratio: 7.27
Image Trigger?: NO
Rate S/N Ratio: 7.74596669241483 [ if not an image trigger ]
Image S/N Ratio: 7.27
Analysis Position: [ source = BAT ]
RA: 242.009891218405 Dec: 11.2520458868854 [deg; J2000]
Refined Position: [ source = BAT pre-slew burst ]
RA: 242.01 Dec: 11.252 [deg; J2000]
{ 16h 08m 02.4s , +11d 15' 07.2" }
+/- 2.78639273751 [arcmin] (estimated 90% radius based on SNR)
SNR: 7.03720886696
Angular difference between the analysis and refined position is 0.006968 arcmin
Partial Coding Fraction: 0.4804688 [ including projection effects ]
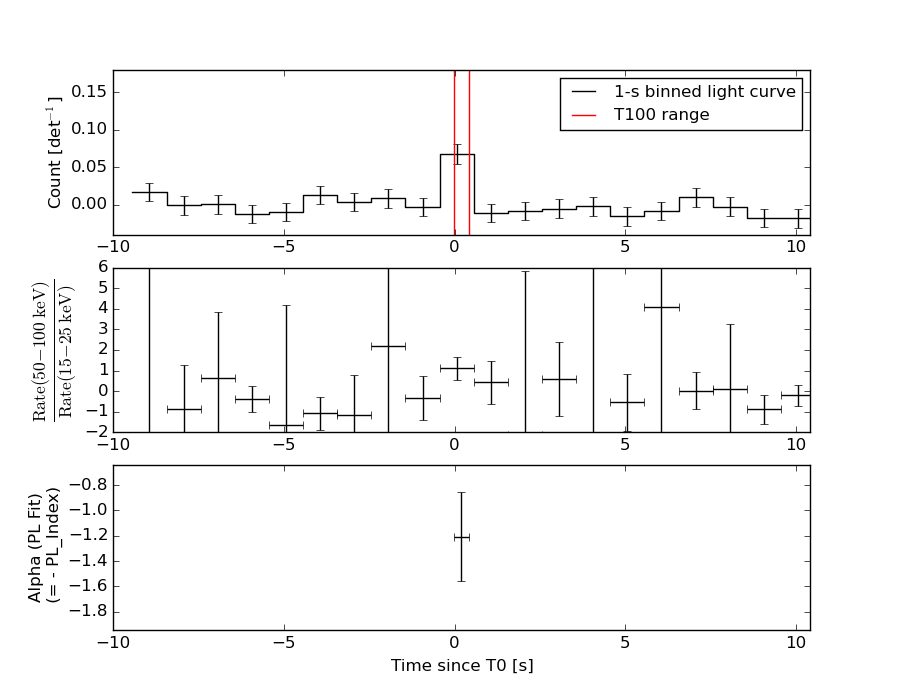
Duration
T90: 0.384000033140182 +/- 0.111946409943277
Measured from: -0.00400000810623169
to: 0.380000025033951 [s; relative to TRIGTIME]
T50: 0.188000023365021 +/- 0.132966175955436
Measured from: 0.0879999995231628
to: 0.276000022888184 [s; relative to TRIGTIME]
Fluence
Peak Flux (peak 1 second)
Measured from: -0.303999990224838
to: 0.696000009775162 [s; relative to TRIGTIME]
Total Fluence
Measured from: -0.0239999890327454
to: 0.412000000476837 [s; relative to TRIGTIME]
Band 1 Band 2 Band 3 Band 4
15-25 25-50 50-100 100-350 keV
Total 0.011601 0.026580 0.021005 0.000719
0.004787 0.004860 0.004559 0.004171 [error]
Peak 0.015804 0.024329 0.020997 -0.001068
0.006896 0.007109 0.006657 0.006008 [error]
[ fluence units of on-axis counts / fully illuminated detector ]
======================================================================
====== Table of the duration information =============================
Value tstart tstop
T100 0.436 -0.024 0.412
T90 0.384 -0.004 0.380
T50 0.188 0.088 0.276
Peak 1.000 -0.304 0.696
====== Spectral Analysis Summary =====================================
Model : spectral model: simple power-law (PL) and cutoff power-law (CPL)
Ph_index : photon index: E^{Ph_index}
Ph_90err : 90% error of the photon index
Epeak : Epeak in keV
Epeak_90err: 90% error of Epeak
Norm : normalization at 50 keV in both the PL model and CPL model
Nomr_90err : 90% error of the normalization
chi2 : Chi-Squared
dof : degree of freedo
=== Time-averaged spectral analysis ===
(Best model with acceptable fit: PL)
Model Ph_index Ph_90err_low Ph_90err_hi Epeak Epeak_90err_low Epeak_90err_hi Norm Nomr_90err_low Norm_90err_hi chi2 dof
PL -1.213 -0.343 0.356 - - - 9.49e-03 -2.15e-03 2.15e-03 54.080 57
CPL 1.418 -1.908 3.144 64.615 -15.118 44.312 1.93e-01 -1.93e-01 7.11e+00 47.790 56
=== 1-s peak spectral analysis ===
(Best model with acceptable fit: PL)
Model Ph_index Ph_90err_low Ph_90err_hi Epeak Epeak_90err_low Epeak_90err_hi Norm Nomr_90err_low Norm_90err_hi chi2 dof
PL -1.235 -0.520 0.540 - - - 4.20e-03 -1.39e-03 1.39e-03 58.550 57
CPL 1.285 -2.561 6.551 63.580 -15.842 2152.890 7.89e-02 -7.89e-02 1.19e+02 55.800 56
=== Fluence/Peak Flux Summary ===
Model Band1 Band2 Band3 Band4 Band5 Total
15-25 25-50 50-100 100-350 15-150 15-350 keV
Fluence PL 4.04e-09 8.86e-09 1.53e-08 6.11e-08 4.19e-08 8.93e-08 erg/cm2
90%_error_low -1.48e-09 -2.24e-09 -3.97e-09 -2.73e-08 -1.02e-08 -3.11e-08 erg/cm2
90%_error_hi 1.67e-09 2.21e-09 3.97e-09 3.95e-08 1.03e-08 4.14e-08 erg/cm2
Peak flux PL 1.34e-01 1.58e-01 1.34e-01 1.94e-01 4.96e-01 6.21e-01 ph/cm2/s
90%_error_low -6.90e-02 -5.88e-02 -5.11e-02 -1.14e-01 -1.66e-01 -2.06e-01 ph/cm2/s
90%_error_hi 8.20e-02 5.78e-02 5.09e-02 1.86e-01 1.67e-01 2.21e-01 ph/cm2/s
Fluence CPL 2.54e-09 1.11e-08 1.69e-08 5.44e-09 3.51e-08 3.60e-08 erg/cm2
90%_error_low -1.53e-09 -3.02e-09 -5.94e-09 N/A -1.01e-08 -1.09e-08 erg/cm2
90%_error_hi 1.91e-09 3.24e-09 5.31e-09 N/A 1.12e-08 2.07e-08 erg/cm2
Peak flux CPL 8.29e-02 1.95e-01 1.51e-01 2.43e-02 4.51e-01 4.53e-01 ph/cm2/s
90%_error_low -8.29e-02 -7.80e-02 -7.39e-02 -2.43e-02 -1.67e-01 -1.69e-01 ph/cm2/s
90%_error_hi 9.61e-02 8.41e-02 6.77e-02 1.86e-01 1.73e-01 2.12e-01 ph/cm2/s
======================================================================
Image
Pre-slew 25.0-100.0 keV image (Event data)
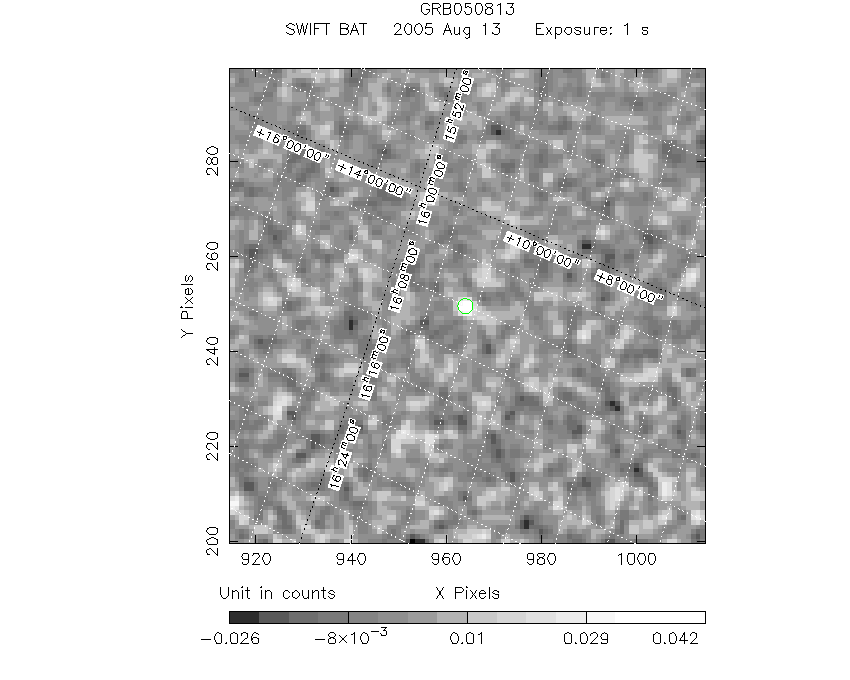
#RAcent DECcent POSerr Theta  Phi  Peak_Cts  SNR Name
242.010 11.252 0.000 26.983 110.380 0.051 7.037 TRIG_00150139

Image time interval: 0.000 to 0.512 [sec]
Light Curves
Note: The mask-weighted lightcurves have units of either count/det or counts/sec/det, where a det is 0.4 x 0.4 = 0.16 sq cm.
Full-time range; 1 s binning
Other quick-look light curves:
- 64 ms binning (zoomed)
- 16 ms binning (zoomed)
- 8 ms binning (zoomed)
- 2 ms binning (zoomed)
- SN=5 or 10 s binning (full-time range)
- Raw light curve
Spectra
- 64 ms binning (zoomed)
- 16 ms binning (zoomed)
- 8 ms binning (zoomed)
- 2 ms binning (zoomed)
- SN=5 or 10 s binning (full-time range)
- Raw light curve
Spectra
Notes:
- 1) The fitting includes the systematic errors.
- 2) When the burst includes telescope slew time periods, the fitting uses an average response file made from multiple 5-s response files through out the slew time plus single time preiod for the non-slew times, and weighted by the total counts in the corresponding time period using addrmf. An average response file is needed becuase a spectral fit using the pre-slew DRM will introduce some errors in both a spectral shape and a normalization if the PHA file contains a lot of the slew/post-slew time interval.
- 3) For fits to more complicated models (e.g. a power-law over a cutoff power-law), the BAT team has decided to require a chi-square improvement of more than 6 for each extra dof.
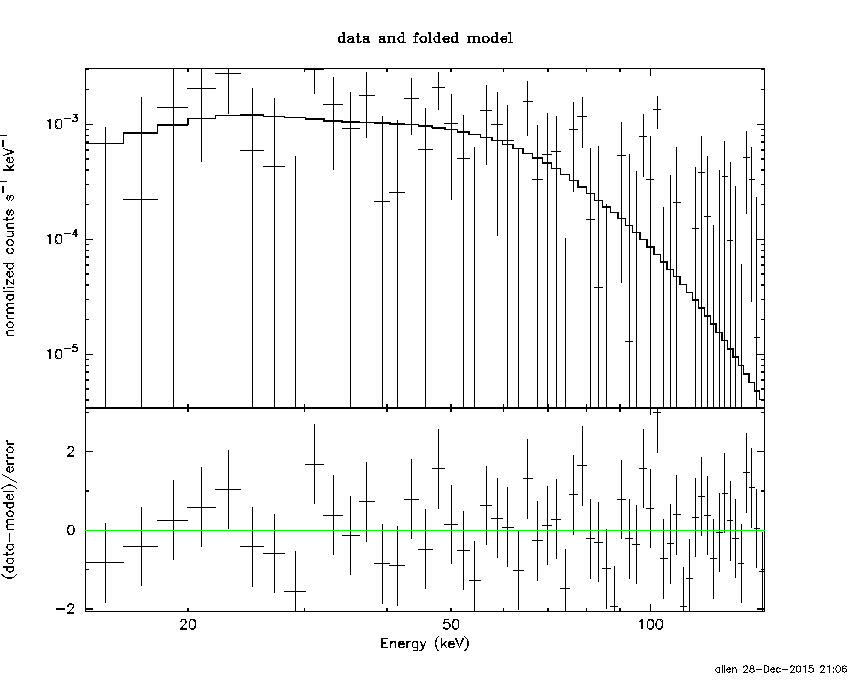
Time averaged spectrum fit using the average DRM
Power-law model
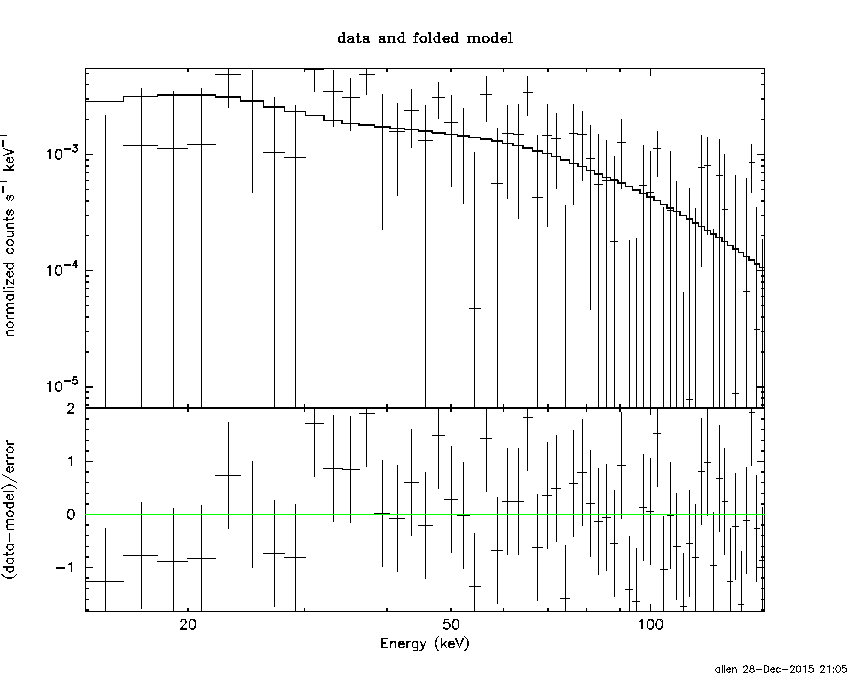
Time interval is from   -0.024 sec. to    0.412 sec.

Spectral model in power-law:
------------------------------------------------------------
Parameters  : value       lower 90%   higher 90%
Photon index: -1.21318     ( -0.344386   0.355286 )
Norm@50keV  : 9.49449E-03    ( -0.00214829   0.00214826 )
------------------------------------------------------------
#Fit statistic : Chi-Squared =          54.08 using 59 PHA bins.
# Reduced chi-squared =         0.9488 for     57 degrees of freedom
# Null hypothesis probability =   5.853443e-01

Photon flux (15-150 keV)    in 0.436 sec: 1.11643 ( -0.258137  0.25962 ) ph/cm2/s
Energy fluence (15-150 keV)             : 4.18578e-08 ( -1.01507e-08  1.03081e-08 ) ergs/cm2
Cutoff power-law model
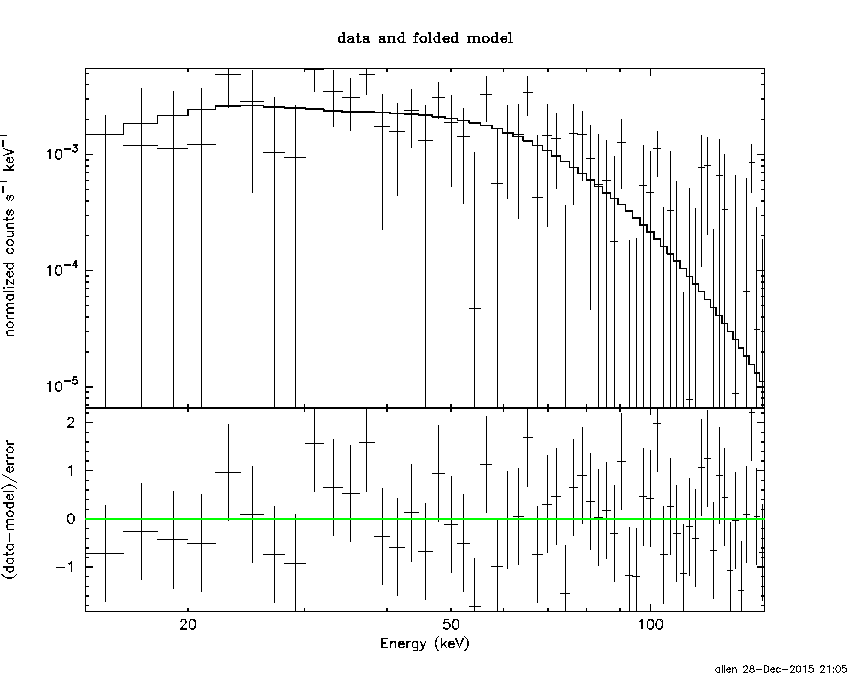
Time interval is from   -0.024 sec. to    0.412 sec.
Spectral model in the cutoff power-law:
------------------------------------------------------------
Parameters  : value       lower 90%   higher 90%
Photon index: 1.41758     ( -1.91223   3.13986 )
Epeak [keV] : 64.6151      ( -15.0676 44.3617 )
Norm@50keV  : 0.193100    ( -0.194387   7.10679 )
------------------------------------------------------------
#Fit statistic : Chi-Squared =          47.79 using 59 PHA bins.
# Reduced chi-squared =         0.8534 for     56 degrees of freedom
# Null hypothesis probability =   7.743358e-01

Photon flux (15-150 keV)    in 0.436 sec: 1.02242 ( -0.256426  0.26507 ) ph/cm2/s
Energy fluence (15-150 keV)             : 3.51218e-08 ( -1.00816e-08  1.12066e-08 ) ergs/cm2
1-s peak spectrum fit
Power-law model
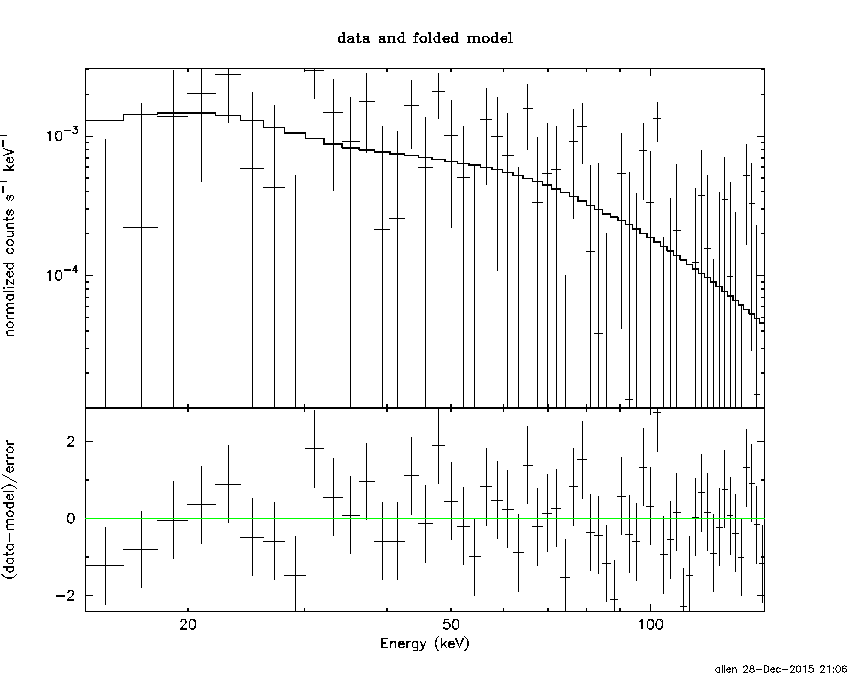
Time interval is from   -0.304 sec. to    0.696 sec.

Spectral model in power-law:
------------------------------------------------------------
Parameters  : value       lower 90%   higher 90%
Photon index: -1.23506     ( -0.520556   0.539578 )
Norm@50keV  : 4.20344E-03    ( -0.00139032   0.001389 )
------------------------------------------------------------
#Fit statistic : Chi-Squared =          58.55 using 59 PHA bins.
# Reduced chi-squared =          1.027 for     57 degrees of freedom
# Null hypothesis probability =   4.182644e-01

Photon flux (15-150 keV)    in 1 sec: 0.495939 ( -0.16584  0.166874 ) ph/cm2/s
Energy fluence (15-150 keV)             : 4.22474e-08 ( -1.50893e-08  1.55888e-08 ) ergs/cm2
Cutoff power-law model
Time interval is from   -0.304 sec. to    0.696 sec.
Spectral model in the cutoff power-law:
------------------------------------------------------------
Parameters  : value       lower 90%   higher 90%
Photon index: 1.28476     ( -2.69782   6.4148 )
Epeak [keV] : 63.5802      ( -14.7726 2153.96 )
Norm@50keV  : 7.89118E-02    ( -0.0961995   119.44 )
------------------------------------------------------------
#Fit statistic : Chi-Squared =          55.80 using 59 PHA bins.
# Reduced chi-squared =         0.9965 for     56 degrees of freedom
# Null hypothesis probability =   4.823086e-01

Photon flux (15-150 keV)    in 1 sec: 0.450882 ( -0.166537  0.172906 ) ph/cm2/s
Energy fluence (15-150 keV)             : 3.47088e-08 ( -1.38557e-08  1.72358e-08 ) ergs/cm2
Time-resolved spectra
Distribution
T90 vs. Hardness ratio plot
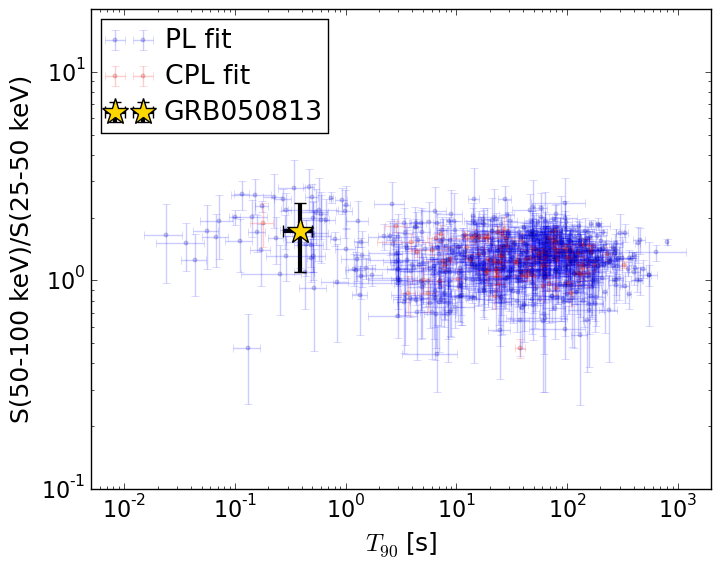
T90                                   = 0.384 sec.
Hardness ratio (energy fluence ratio) = 1.72631496937
S(15-50 keV) vs. S(50-150 keV) plot
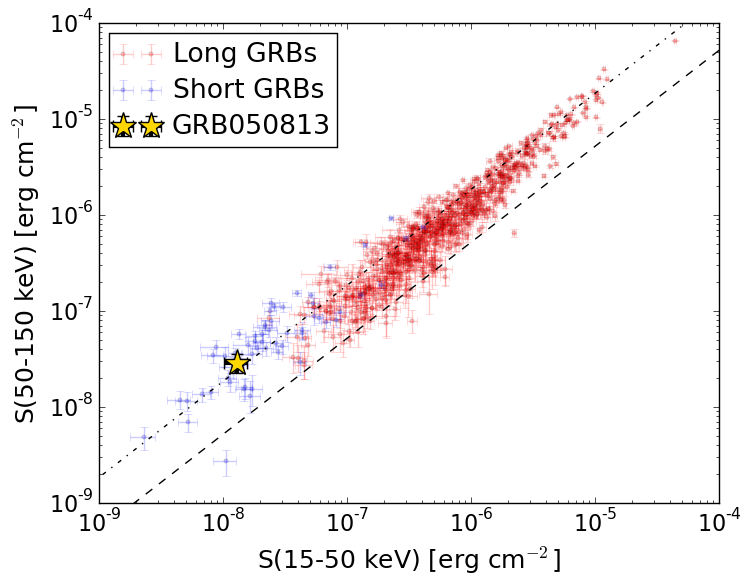
S(15-50 keV)  = 1.2896061e-08
S(50-150 keV) = 2.896231e-08
The dash-dotted line and the dashed line traces the fluences calculated from the Band function with Epeak = 15 and 150 keV, respectively. Both lines assume a canonical values of alpha = -1 and beta = -2.5.
Mask shadow pattern
IMX = -0.177306549307, IMY = -0.477271609489
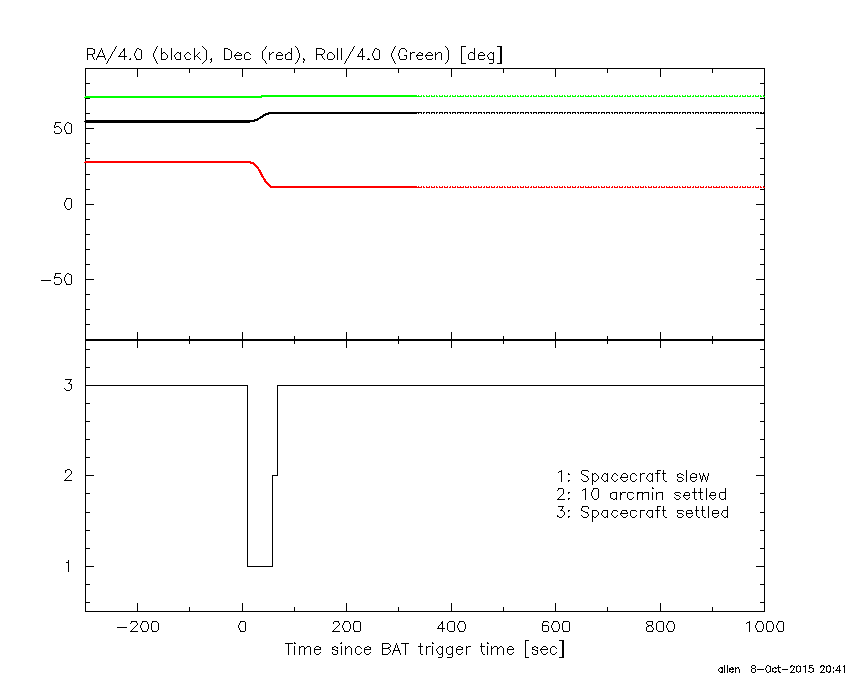
Spacecraft aspect plot
Bright source in the pre-burst/pre-slew/post-slew images
Pre-burst image of 15-350 keV band
Time interval of the image:
-299.440000 -0.024000

# RAcent  DECcent POSerr Theta    Phi  PeakCts   SNR AngSep     Name
#  [deg]    [deg]    ['] [deg]  [deg]                   [']
254.6357  35.3113    6.1  30.9   54.0   0.5186   1.9    8.9	Her X-1
193.7842 -25.8736    3.6  59.0 -166.1   3.6435   3.2 ------	UNKNOWN
Pre-slew background subtracted image of 15-350 keV band
Time interval of the image:
-0.024000 0.412000

# RAcent  DECcent POSerr Theta    Phi  PeakCts   SNR AngSep     Name
#  [deg]    [deg]    ['] [deg]  [deg]                   [']
254.4352  35.1870    3.2  30.7   54.2   0.0340   3.5    9.4	Her X-1
241.9926  11.2491    1.7  27.0  110.4   0.0617   7.0 ------	UNKNOWN
Post-slew image of 15-350 keV band
Time interval of the image:
57.860600 302.623500

# RAcent  DECcent POSerr Theta    Phi  PeakCts   SNR AngSep     Name
#  [deg]    [deg]    ['] [deg]  [deg]                   [']
244.9876 -15.6395    0.2  27.1  157.5  14.5617  63.3    0.5	Sco X-1
254.4229  35.3361    3.9  26.6    7.0   0.6577   3.0    1.7	Her X-1
255.8291 -37.9457    5.6  50.9  149.8   2.0013   2.1    9.6	4U 1700-377
256.2326 -36.5529    7.9  49.7  148.9  -1.3456  -1.5   12.5	GX 349+2
262.8749 -24.7042  437.2  41.3  134.5   0.0168   0.0    7.7	GX 1+4
268.3923  -1.4291    2.0  29.2   98.1   1.9094   5.8    2.0	SW J1753.5-0127
263.0030 -33.8867   10.8  49.4  140.8   1.0971   1.1    3.2	GX 354-0
240.3320  14.7985    2.8   3.9  -40.5   0.7885   4.1 ------	UNKNOWN
243.7354  26.4257    2.9  15.2  -10.2   0.7488   4.0 ------	UNKNOWN