Analysis Summary
Notes:
- 1) No attempt has been made to eliminate the non-significant decimal places.
- 2) This batgrbproduct analysis is done using the HEASARC data.
- 3) This batgrbproduct analysis is using the flight position for the mask-weighting calculation.
======================================================================
BAT GRB EVENT DATA PROCESSING REPORT
Process Script Ver: batgrbproduct v2.46
Process Start Time: Wed Jan 22 20:57:08 EST 2014
Host Name: batevent1
Current Working Dir: /local/data/batevent/batevent_reproc/trigger150314
======================================================================
Trigger: 00150314 Segment: 000
BAT Trigger Time: 145712336.64 [s; MET]
Trigger Stop: 145712353.024 [s; MET]
UTC: 2005-08-14T11:38:56.966000 [includes UTCF correction]
Where From?: TDRSS position message
BAT
RA: 264.203808814218 Dec: 46.3327854969257 [deg; J2000]
Catalogged Source?: NO
Point Source?: YES
GRB Indicated?: YES [ by BAT flight software ]
Image S/N Ratio: 6.81
Image Trigger?: NO
Rate S/N Ratio: 9.1104335791443 [ if not an image trigger ]
Image S/N Ratio: 6.81
Analysis Position: [ source = BAT ]
RA: 264.203808814218 Dec: 46.3327854969257 [deg; J2000]
Refined Position: [ source = BAT pre-slew burst ]
RA: 264.195933871896 Dec: 46.3376383588836 [deg; J2000]
{ 17h 36m 47.0s , +46d 20' 15.5" }
+/- 1.95665872281777 [arcmin] (estimated 90% radius based on SNR)
+/- 0.893911385446911 [arcmin] (formal 1-sigma fit error)
SNR: 11.659186811841
Angular difference between the analysis and refined position is 0.437272 arcmin
Partial Coding Fraction: 0.2617188 [ including projection effects ]
Duration
T90: 142.851999998093 +/- 41.6607568695614
Measured from: -0.0799999833106995
to: 142.772000014782 [s; relative to TRIGTIME]
T50: 53.9280000030994 +/- 19.6710813001249
Measured from: 12.9320000112057
to: 66.8600000143051 [s; relative to TRIGTIME]
Fluence
Peak Flux (peak 1 second)
Measured from: 5.47200000286102
to: 6.47200000286102 [s; relative to TRIGTIME]
Total Fluence
Measured from: -4.55599999427795
to: 175.480000019073 [s; relative to TRIGTIME]
Band 1 Band 2 Band 3 Band 4
15-25 25-50 50-100 100-350 keV
Total 0.931661 1.236049 0.782515 0.110095
0.097825 0.101420 0.089746 0.082321 [error]
Peak 0.017612 0.027460 0.031321 0.007483
0.009848 0.009792 0.008738 0.007754 [error]
[ fluence units of on-axis counts / fully illuminated detector ]
======================================================================
====== Table of the duration information =============================
Value tstart tstop
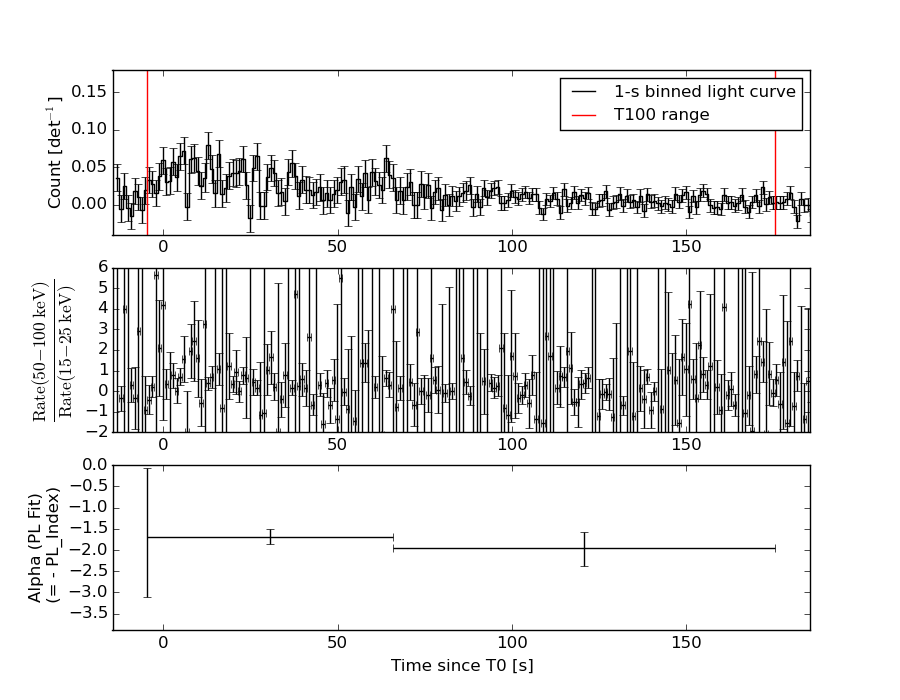
T100 180.036 -4.556 175.480
T90 142.852 -0.080 142.772
T50 53.928 12.932 66.860
Peak 1.000 5.472 6.472
====== Spectral Analysis Summary =====================================
Model : spectral model: simple power-law (PL) and cutoff power-law (CPL)
Ph_index : photon index: E^{Ph_index}
Ph_90err : 90% error of the photon index
Epeak : Epeak in keV
Epeak_90err: 90% error of Epeak
Norm : normalization at 50 keV in both the PL model and CPL model
Nomr_90err : 90% error of the normalization
chi2 : Chi-Squared
dof : degree of freedo
=== Time-averaged spectral analysis ===
(Best model with acceptable fit: PL)
Model Ph_index Ph_90err_low Ph_90err_hi Epeak Epeak_90err_low Epeak_90err_hi Norm Nomr_90err_low Norm_90err_hi chi2 dof
PL -1.747 -0.169 0.164 - - - 1.15e-03 -1.21e-04 1.19e-04 59.190 57
CPL -0.995 -0.675 0.803 61.758 -13.886 110.386 2.91e-03 -1.62e-03 4.84e-03 55.500 56
=== 1-s peak spectral analysis ===
(Best model with acceptable fit: PL)
Model Ph_index Ph_90err_low Ph_90err_hi Epeak Epeak_90err_low Epeak_90err_hi Norm Nomr_90err_low Norm_90err_hi chi2 dof
PL -1.638 -0.697 0.640 - - - 5.18e-03 -2.07e-03 1.98e-03 47.280 57
CPL -0.874 -1.382 4.155 74.905 -74.905 -74.905 1.25e-02 -1.25e-02 9.00e-01 47.000 56
=== Fluence/Peak Flux Summary ===
Model Band1 Band2 Band3 Band4 Band5 Total
15-25 25-50 50-100 100-350 15-150 15-350 keV
Fluence PL 3.33e-07 5.26e-07 6.27e-07 1.45e-06 1.91e-06 2.94e-06 erg/cm2
90%_error_low -4.75e-08 -4.96e-08 -8.78e-08 -3.77e-07 -2.06e-07 -4.69e-07 erg/cm2
90%_error_hi 4.91e-08 4.97e-08 8.81e-08 4.56e-07 2.09e-07 5.30e-07 erg/cm2
Peak flux PL 2.44e-01 2.26e-01 1.45e-01 1.44e-01 6.74e-01 7.58e-01 ph/cm2/s
90%_error_low -1.33e-01 -8.78e-02 -7.11e-02 -1.02e-01 -2.52e-01 -2.79e-01 ph/cm2/s
90%_error_hi 1.55e-01 8.58e-02 6.95e-02 1.84e-01 2.53e-01 2.81e-01 ph/cm2/s
Fluence CPL 3.01e-07 5.72e-07 6.36e-07 5.00e-07 1.79e-06 2.01e-06 erg/cm2
90%_error_low -5.59e-08 -6.42e-08 -9.86e-08 -2.94e-07 -2.25e-07 -3.75e-07 erg/cm2
90%_error_hi 5.65e-08 6.66e-08 9.78e-08 7.81e-07 2.31e-07 7.92e-07 erg/cm2
Peak flux CPL 2.11e-01 2.42e-01 1.56e-01 7.02e-02 6.54e-01 6.79e-01 ph/cm2/s
90%_error_low -1.67e-01 -1.02e-01 -7.94e-02 -7.02e-02 -2.65e-01 N/A ph/cm2/s
90%_error_hi 1.78e-01 1.08e-01 8.76e-02 1.13e-01 2.62e-01 N/A ph/cm2/s
======================================================================
Image
Pre-slew 15.0-350.0 keV image (Event data)

#   RAcent    DECcent   POSerr    Theta     Phi              Peak Cts       SNR   Name
  264.1959    46.3376   0.0165    39.6577    36.8678         2.0400041     11.659 TRIG_00150314

Foreground time interval of the image:
 -4.556  65.061 (delta_t =  69.617 [sec])
Background time interval of the image:
-299.640  -4.556 (delta_t = 295.084 [sec])
Light Curves
Note: The mask-weighted lightcurves have units of either count/det or counts/sec/det, where a det is 0.4 x 0.4 = 0.16 sq cm.
Full-time range; 1 s binning
Other quick-look light curves:
- 64 ms binning (zoomed)
- 16 ms binning (zoomed)
- 8 ms binning (zoomed)
- 2 ms binning (zoomed)
- SN=5 or 10 s binning (full-time range)
- Raw light curve
Spectra
- 64 ms binning (zoomed)
- 16 ms binning (zoomed)
- 8 ms binning (zoomed)
- 2 ms binning (zoomed)
- SN=5 or 10 s binning (full-time range)
- Raw light curve
Spectra
Notes:
- 1) The fitting includes the systematic errors.
- 2) When the burst includes telescope slew time periods, the fitting uses an average response file made from multiple 5-s response files through out the slew time plus single time preiod for the non-slew times, and weighted by the total counts in the corresponding time period using addrmf. An average response file is needed becuase a spectral fit using the pre-slew DRM will introduce some errors in both a spectral shape and a normalization if the PHA file contains a lot of the slew/post-slew time interval.
- 3) For fits to more complicated models (e.g. a power-law over a cutoff power-law), the BAT team has decided to require a chi-square improvement of more than 6 for each extra dof.
Time averaged spectrum fit using the average DRM
Power-law model
Time interval is from   -4.556 sec. to  175.480 sec.

Spectral model in power-law:
------------------------------------------------------------
Parameters  : value       lower 90%   higher 90%
Photon index: -1.74676     ( -0.169071   0.164045 )
Norm@50keV  : 1.14752E-03    ( -0.000120602   0.000118996 )
------------------------------------------------------------
#Fit statistic : Chi-Squared =          59.19 using 59 PHA bins.
# Reduced chi-squared =          1.038 for     57 degrees of freedom
# Null hypothesis probability =   3.954683e-01

Photon flux (15-150 keV)    in 180 sec: 0.154986 ( -0.014753  0.014765 ) ph/cm2/s
Energy fluence (15-150 keV)             : 1.90656e-06 ( -2.06194e-07  2.0884e-07 ) ergs/cm2
Cutoff power-law model
Time interval is from   -4.556 sec. to  175.480 sec.
Spectral model in the cutoff power-law:
------------------------------------------------------------
Parameters  : value       lower 90%   higher 90%
Photon index: -0.99458     ( -0.674512   0.802598 )
Epeak [keV] : 61.7575      ( -13.8865 110.385 )
Norm@50keV  : 2.90550E-03    ( -0.00161665   0.00483998 )
------------------------------------------------------------
#Fit statistic : Chi-Squared =          55.50 using 59 PHA bins.
# Reduced chi-squared =         0.9911 for     56 degrees of freedom
# Null hypothesis probability =   4.936525e-01

Photon flux (15-150 keV)    in 180 sec: 0.150156 ( -0.015379  0.015374 ) ph/cm2/s
Energy fluence (15-150 keV)             : 1.79189e-06 ( -2.24629e-07  2.30857e-07 ) ergs/cm2
1-s peak spectrum fit
Power-law model
Time interval is from    5.472 sec. to    6.472 sec.

Spectral model in power-law:
------------------------------------------------------------
Parameters  : value       lower 90%   higher 90%
Photon index: -1.6379     ( -0.696792   0.639598 )
Norm@50keV  : 5.18440E-03    ( -0.00206756   0.00198049 )
------------------------------------------------------------
#Fit statistic : Chi-Squared =          47.28 using 59 PHA bins.
# Reduced chi-squared =         0.8294 for     57 degrees of freedom
# Null hypothesis probability =   8.172020e-01

Photon flux (15-150 keV)    in 1 sec: 0.674304 ( -0.251999  0.253315 ) ph/cm2/s
Energy fluence (15-150 keV)             : 4.82836e-08 ( -1.94619e-08  2.00651e-08 ) ergs/cm2
Cutoff power-law model
Time interval is from    5.472 sec. to    6.472 sec.
Spectral model in the cutoff power-law:
------------------------------------------------------------
Parameters  : value       lower 90%   higher 90%
Photon index: -0.873915     ( -1.38468   4.15193 )
Epeak [keV] : 74.9051      ( -74.8197 -74.8197 )
Norm@50keV  : 1.25009E-02    ( -0.0125448   0.900061 )
------------------------------------------------------------
#Fit statistic : Chi-Squared =          47.00 using 59 PHA bins.
# Reduced chi-squared =         0.8393 for     56 degrees of freedom
# Null hypothesis probability =   7.986031e-01

Photon flux (15-150 keV)    in 1 sec: 0.654074 ( -0.265346  0.261913 ) ph/cm2/s
Energy fluence (15-150 keV)             : 4.64344e-08 ( -1.94831e-08  2.08044e-08 ) ergs/cm2
Time-resolved spectra
Distribution
T90 vs. Hardness ratio plot
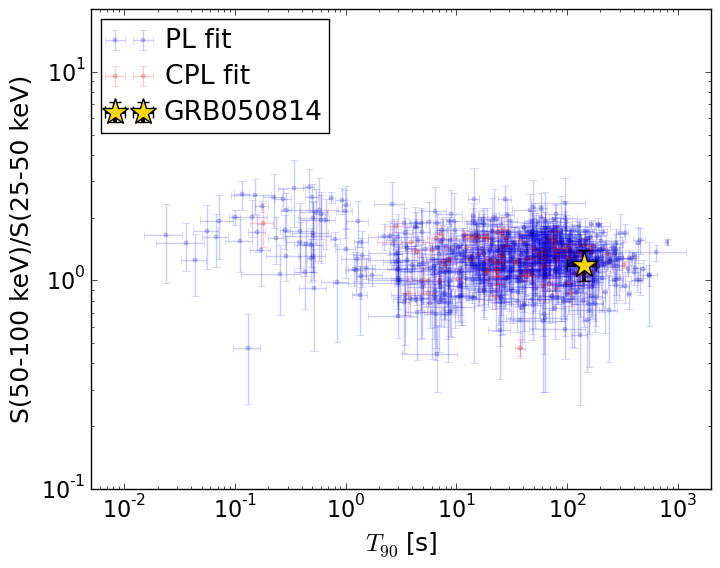
T90                                   = 142.852 sec.
Hardness ratio (energy fluence ratio) = 1.19192797624
S(15-50 keV) vs. S(50-150 keV) plot
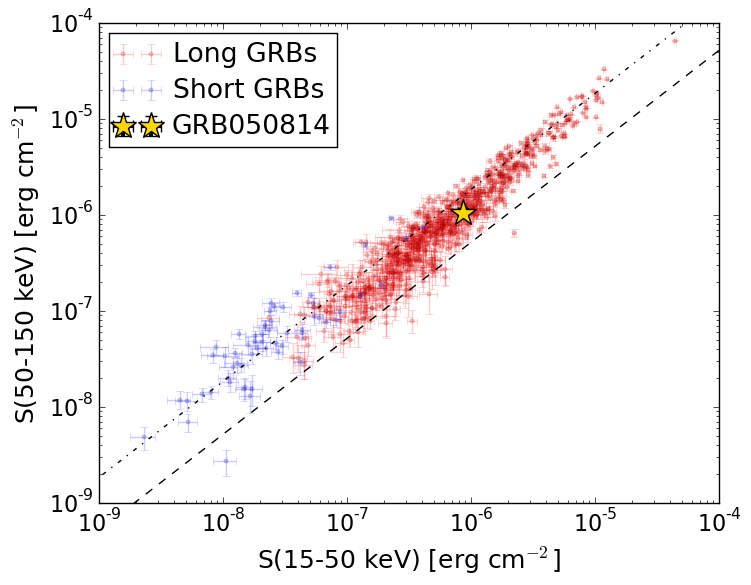
S(15-50 keV)  = 8.585984e-07
S(50-150 keV) = 1.0479939e-06
The dash-dotted line and the dashed line traces the fluences calculated from the Band function with Epeak = 15 and 150 keV, respectively. Both lines assume a canonical values of alpha = -1 and beta = -2.5.
Mask shadow pattern
IMX = 6.631946392069351E-01, IMY = -4.973582093147902E-01
Spacecraft aspect plot
Bright source in the pre-burst/pre-slew/post-slew images
Pre-burst image of 15-350 keV band
Time interval of the image:
-299.640000 -4.556000

# RAcent  DECcent POSerr Theta    Phi  PeakCts   SNR AngSep     Name
#  [deg]    [deg]    ['] [deg]  [deg]                   [']
254.6101  35.3557    7.0  30.9   53.9   0.4625   1.6    7.5	Her X-1
245.6881  73.3097    2.5  47.6   -3.0   1.5541   4.6 ------	UNKNOWN
193.8049 -25.9189    3.6  59.0 -166.1   4.2871   3.2 ------	UNKNOWN
193.6253   3.3901    2.5  34.6 -143.3   1.0385   4.6 ------	UNKNOWN
Pre-slew background subtracted image of 15-350 keV band
Time interval of the image:
-4.556000 65.060620

# RAcent  DECcent POSerr Theta    Phi  PeakCts   SNR AngSep     Name
#  [deg]    [deg]    ['] [deg]  [deg]                   [']
254.4277  35.3928    6.0  30.7   53.8   0.2464   1.9    3.4	Her X-1
264.1959  46.3376    1.0  39.7   36.9   2.0394  11.7 ------	UNKNOWN
265.1180  59.1741    2.9  44.2   18.9   0.7380   4.0 ------	UNKNOWN
185.5177  -5.4571    2.3  46.6 -143.3   0.8885   4.9 ------	UNKNOWN
Post-slew image of 15-350 keV band
Time interval of the image:
121.860600 302.377600

# RAcent  DECcent POSerr Theta    Phi  PeakCts   SNR AngSep     Name
#  [deg]    [deg]    ['] [deg]  [deg]                   [']
254.6241  35.3027    4.1  13.2 -175.3   0.3892   2.8    8.5	Her X-1
268.3057  -1.4565    7.1  47.9  142.7   0.9728   1.6    3.7	SW J1753.5-0127
299.6013  35.1970    0.4  28.7   68.2   6.8749  32.3    0.6	Cyg X-1
308.0904  40.9787    1.6  31.8   51.7   1.6491   7.3    1.8	Cyg X-3
326.0058  38.3233    4.1  45.2   45.2  -1.5135  -2.9    7.8	Cyg X-2
239.0385   6.8079    2.1  45.1 -175.2   1.4055   5.4 ------	UNKNOWN
235.5188  27.9034    3.2  29.1 -151.1   0.5265   3.6 ------	UNKNOWN
213.6398  12.8187    3.5  54.0 -143.2   3.5048   3.4 ------	UNKNOWN