Analysis Summary
Notes:
- 1) No attempt has been made to eliminate the non-significant decimal places.
- 2) This batgrbproduct analysis is done using the HEASARC data.
- 3) This batgrbproduct analysis is using the flight position for the mask-weighting calculation.
======================================================================
                  BAT GRB EVENT DATA PROCESSING REPORT
    Process Script Ver: batgrbproduct v2.46
    Process Start Time: Wed Jan 22 20:48:44 EST 2014
             Host Name: batevent1
   Current Working Dir: /local/data/batevent/batevent_reproc/trigger151207
======================================================================

  Trigger: 00151207      Segment: 000

  BAT Trigger Time: 146212492.8   [s; MET]
      Trigger Stop: 146212493.824   [s; MET]
               UTC: 2005-08-20T06:34:53.115840    [includes UTCF correction]
       Where From?: TDRSS position message

  BAT
    RA: 337.39960673239   Dec: 19.5782013718259  [deg; J2000]

     Catalogged Source?: NO
     Point Source?:      YES
     GRB Indicated?:     YES    [ by BAT flight software ]
     Image S/N Ratio:    8.38
     Image Trigger?:     NO
     Rate S/N Ratio:     15.6204993518133  [ if not an image trigger ]
     Image S/N Ratio:    8.38

  Analysis Position:   [ source = BAT ]
    RA: 337.39960673239   Dec: 19.5782013718259  [deg; J2000]

  Refined Position:   [ source = BAT pre-slew burst ]
    RA: 337.416642861812   Dec: 19.5605559321051  [deg; J2000]
        { 22h 29m 40.0s , +19d 33' 38.0" }
         +/- 1.07678536589351 [arcmin] (estimated 90% radius based on SNR)
         +/- 0.346905538452602 [arcmin] (formal 1-sigma fit error)
    SNR: 27.3665217069556

  Angular difference between the analysis and refined position is 1.431261 arcmin

  Partial Coding Fraction: 0.765625    [ including projection effects ]

  Duration
     T90: 240.767999976873 +/- 11.5134425819149
        Measured from: -1.44800001382828
                   to: 239.319999963045     [s; relative to TRIGTIME]
     T50: 220.143999993801 +/- 2.9953777639415
        Measured from: 13.9599999785423
                   to: 234.103999972343     [s; relative to TRIGTIME]


  Fluence
     Peak Flux  (peak 1 second)
        Measured from: 229.531999975443
                   to: 230.531999975443     [s; relative to TRIGTIME]
     Total Fluence
        Measured from: -20.472000002861
                   to: 240.887999981642     [s; relative to TRIGTIME]

             Band 1     Band 2     Band 3     Band 4
              15-25      25-50     50-100    100-350     keV
 Total     1.399027   2.004103   1.880053   0.618679
           0.088740   0.099831   0.100152   0.108039 [error]
 Peak      0.058582   0.117876   0.111439   0.042121
           0.008003   0.009948   0.010832   0.011975 [error]

     [ fluence units of on-axis counts / fully illuminated detector ]

======================================================================


====== Table of the duration information =============================

        Value   tstart    tstop
T100  261.360  -20.472  240.888
T90   240.768   -1.448  239.320
T50   220.144   13.960  234.104
Peak    1.000  229.532  230.532


====== Spectral Analysis Summary =====================================

Model      : spectral model: simple power-law (PL) and cutoff power-law (CPL)
Ph_index   : photon index: E^{Ph_index}
Ph_90err   : 90% error of the photon index
Epeak      : Epeak in keV
Epeak_90err: 90% error of Epeak
Norm       : normalization at 50 keV in both the PL model and CPL model
Nomr_90err : 90% error of the normalization
chi2       : Chi-Squared
dof        : degree of freedo

=== Time-averaged spectral analysis ===
(Best model with acceptable fit: PL)

Model Ph_index Ph_90err_low Ph_90err_hi  Epeak  Epeak_90err_low  Epeak_90err_hi  Norm       Nomr_90err_low    Norm_90err_hi    chi2    dof
PL      -1.241    -0.100      0.100       -           -               -         1.46e-03     -7.92e-05          7.90e-05      45.570   57
CPL     -1.239    -0.098      0.104     9999.360    -9999.360      -9999.360      1.47e-03     -7.82e-05          5.43e-04      45.590   56


=== 1-s peak spectral analysis ===
(Best model with acceptable fit: PL)

Model Ph_index Ph_90err_low Ph_90err_hi  Epeak  Epeak_90err_low  Epeak_90err_hi  Norm       Nomr_90err_low    Norm_90err_hi    chi2    dof
PL      -1.019     -0.157     0.158       -           -               -         2.11e-02     -2.01e-03          2.01e-03      65.110   57
CPL     -0.188     -0.677     0.799      110.609     -32.261       233.538      5.51e-02     -2.94e-02          7.93e-02      60.580   56


=== Fluence/Peak Flux Summary ===

              Model    Band1     Band2     Band3     Band4     Band5     Total
                       15-25     25-50    50-100    100-350    15-150    15-350    keV
Fluence         PL   3.83e-07  8.24e-07  1.40e-06  5.42e-06  3.83e-06  8.02e-06   erg/cm2
      90%_error_low -3.77e-08 -4.81e-08 -9.87e-08 -8.17e-07 -2.44e-07 -8.90e-07   erg/cm2
      90%_error_hi   3.89e-08  4.79e-08  9.84e-08  9.16e-07  2.46e-07  9.78e-07   erg/cm2
Peak flux       PL   5.50e-01  7.38e-01  7.28e-01  1.29e+00  2.44e+00  3.31e+00   ph/cm2/s
      90%_error_low -8.97e-02 -7.73e-02 -8.36e-02 -2.83e-01 -2.30e-01 -3.72e-01   ph/cm2/s
      90%_error_hi   9.40e-02  7.66e-02  8.31e-02  3.30e-01  2.30e-01  3.91e-01   ph/cm2/s

Fluence        CPL   3.87e-07  8.22e-07  1.39e-06  5.85e-06  3.86e-06  7.98e-06   erg/cm2
      90%_error_low -2.65e-08 -4.88e-08 -1.28e-07 -2.53e-06 -2.95e-07 -2.00e-06   erg/cm2
      90%_error_hi   3.65e-08  5.30e-08  1.38e-07  -3.18e-07  2.29e-07  4.86e-07   erg/cm2
Peak flux      CPL   4.74e-01  7.99e-01  7.78e-01  5.24e-01  2.36e+00  2.57e+00   ph/cm2/s
      90%_error_low -1.08e-01 -9.38e-02 -9.66e-02 -2.56e-01 -2.40e-01 -3.52e-01   ph/cm2/s
      90%_error_hi   1.11e-01  9.69e-02  9.89e-02  5.47e-01  2.39e-01  5.58e-01   ph/cm2/s

======================================================================
Image
Pre-slew 15.0-350.0 keV image (Event data)
#   RAcent    DECcent   POSerr    Theta     Phi              Peak Cts       SNR   Name
  337.4166    19.5606   0.0071    20.4379   128.3230         1.9030202     27.367 TRIG_00151207

Foreground time interval of the image:
-20.472  19.101 (delta_t =  39.573 [sec])
Background time interval of the image:
-299.800 -20.472 (delta_t = 279.328 [sec])
Light Curves
Note: The mask-weighted lightcurves have units of either count/det or counts/sec/det, where a det is 0.4 x 0.4 = 0.16 sq cm.
Full-time range; 1 s binning
Other quick-look light curves:
- 64 ms binning (zoomed)
- 16 ms binning (zoomed)
- 8 ms binning (zoomed)
- 2 ms binning (zoomed)
- SN=5 or 10 s binning (full-time range)
- Raw light curve
Spectra
- 64 ms binning (zoomed)
- 16 ms binning (zoomed)
- 8 ms binning (zoomed)
- 2 ms binning (zoomed)
- SN=5 or 10 s binning (full-time range)
- Raw light curve
Spectra
Notes:
- 1) The fitting includes the systematic errors.
- 2) When the burst includes telescope slew time periods, the fitting uses an average response file made from multiple 5-s response files through out the slew time plus single time preiod for the non-slew times, and weighted by the total counts in the corresponding time period using addrmf. An average response file is needed becuase a spectral fit using the pre-slew DRM will introduce some errors in both a spectral shape and a normalization if the PHA file contains a lot of the slew/post-slew time interval.
- 3) For fits to more complicated models (e.g. a power-law over a cutoff power-law), the BAT team has decided to require a chi-square improvement of more than 6 for each extra dof.
Time averaged spectrum fit using the average DRM
Power-law model

Time interval is from  -20.472 sec. to  240.888 sec.

Spectral model in power-law:
------------------------------------------------------------
Parameters  : value       lower 90%   higher 90%
Photon index: -1.24058     ( -0.10024   0.100279 )
Norm@50keV  : 1.46066E-03    ( -7.92048e-05   7.90019e-05 )
------------------------------------------------------------
#Fit statistic : Chi-Squared =          45.57 using 59 PHA bins.
# Reduced chi-squared =         0.7995 for     57 degrees of freedom
# Null hypothesis probability =   8.616495e-01

Photon flux (15-150 keV)    in 261.4 sec: 0.172497 ( -0.009303  0.009308 ) ph/cm2/s
Energy fluence (15-150 keV)             : 3.83121e-06 ( -2.44092e-07  2.46306e-07 ) ergs/cm2
Cutoff power-law model
Time interval is from  -20.472 sec. to  240.888 sec.
Spectral model in the cutoff power-law:
------------------------------------------------------------
Parameters  : value       lower 90%   higher 90%
Photon index: -1.23925     ( -0.0990512   0.102727 )
Epeak [keV] : 9999.36      ( -9999.36 -9999.36 )
Norm@50keV  : 1.46585E-03    ( -7.93783e-05   0.000542274 )
------------------------------------------------------------
#Fit statistic : Chi-Squared =          45.59 using 59 PHA bins.
# Reduced chi-squared =         0.8141 for     56 degrees of freedom
# Null hypothesis probability =   8.384301e-01

Photon flux (15-150 keV)    in 261.4 sec: 0.173203 ( -0.013173  0.011538 ) ph/cm2/s
Energy fluence (15-150 keV)             : 3.85766e-06 ( -2.95238e-07  2.2944e-07 ) ergs/cm2
1-s peak spectrum fit
Power-law model
Time interval is from  229.532 sec. to  230.532 sec.

Spectral model in power-law:
------------------------------------------------------------
Parameters  : value       lower 90%   higher 90%
Photon index: -1.01922     ( -0.156901   0.15769 )
Norm@50keV  : 2.11402E-02    ( -0.00201262   0.00201054 )
------------------------------------------------------------
#Fit statistic : Chi-Squared =          65.11 using 59 PHA bins.
# Reduced chi-squared =          1.142 for     57 degrees of freedom
# Null hypothesis probability =   2.153760e-01

Photon flux (15-150 keV)    in 1 sec: 2.43652 ( -0.23043  0.23042 ) ph/cm2/s
Energy fluence (15-150 keV)             : 2.27086e-07 ( -2.58526e-08  2.62168e-08 ) ergs/cm2
Cutoff power-law model
Time interval is from  229.532 sec. to  230.532 sec.
Spectral model in the cutoff power-law:
------------------------------------------------------------
Parameters  : value       lower 90%   higher 90%
Photon index: -0.188493     ( -0.675334   0.800634 )
Epeak [keV] : 110.609      ( -32.3473 233.452 )
Norm@50keV  : 5.50716E-02    ( -0.0292746   0.079402 )
------------------------------------------------------------
#Fit statistic : Chi-Squared =          60.58 using 59 PHA bins.
# Reduced chi-squared =          1.082 for     56 degrees of freedom
# Null hypothesis probability =   3.140231e-01

Photon flux (15-150 keV)    in 1 sec: 2.36054 ( -0.2396  0.23916 ) ph/cm2/s
Energy fluence (15-150 keV)             : 2.10402e-07 ( -2.92471e-08  2.96636e-08 ) ergs/cm2
Time-resolved spectra
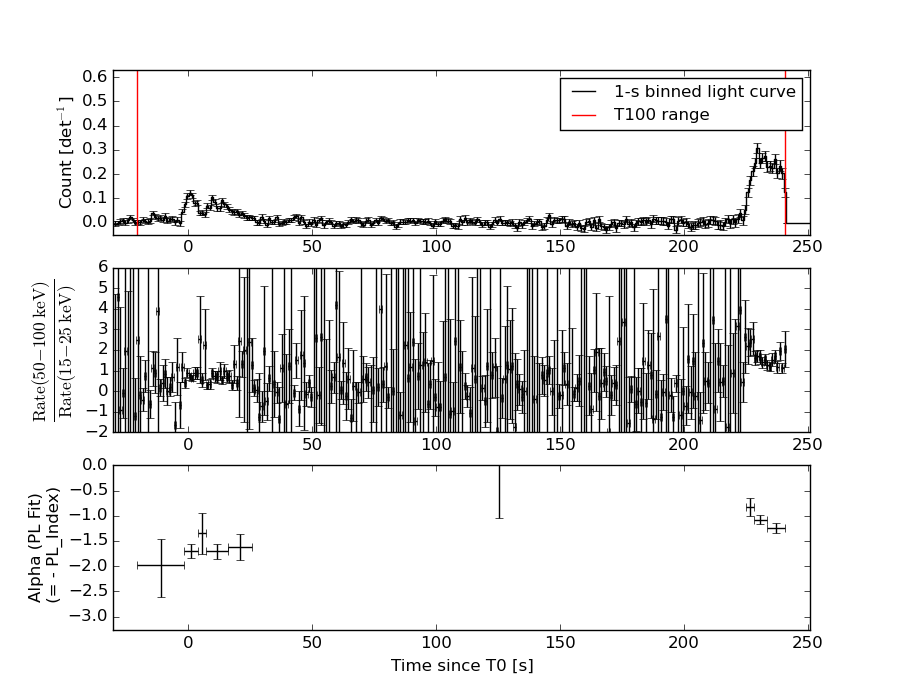
Distribution
T90 vs. Hardness ratio plot
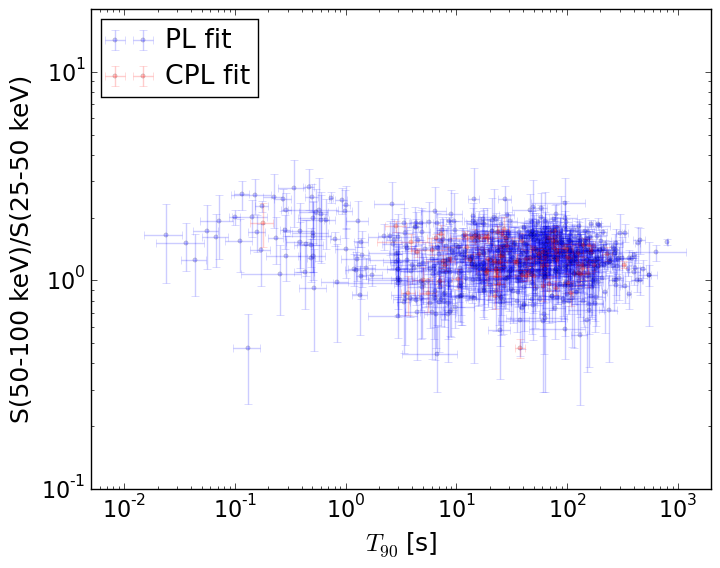
T90                                   = N/A sec.
Hardness ratio (energy fluence ratio) = N/A
S(15-50 keV) vs. S(50-150 keV) plot
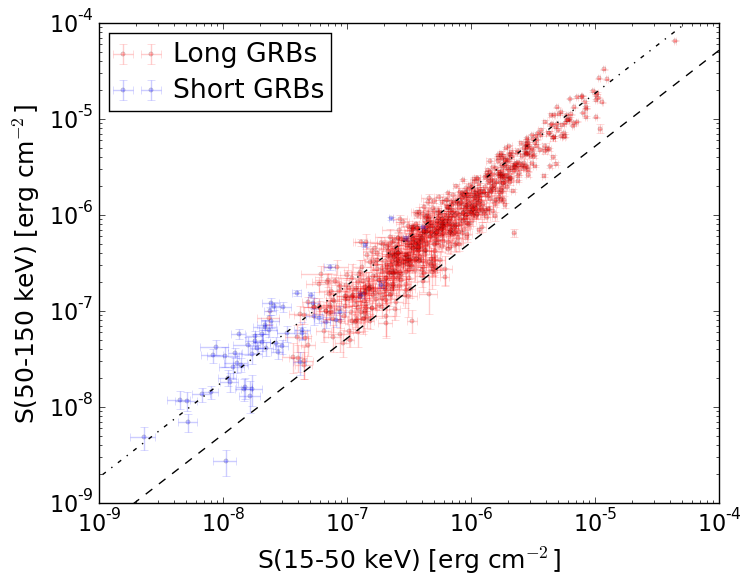
S(15-50 keV)  = N/A
S(50-150 keV) = N/A
The dash-dotted line and the dashed line traces the fluences calculated from the Band function with Epeak = 15 and 150 keV, respectively. Both lines assume a canonical values of alpha = -1 and beta = -2.5.
Mask shadow pattern
IMX = -2.310779479077750E-01, IMY = -2.923535457271975E-01
Spacecraft aspect plot
Bright source in the pre-burst/pre-slew/post-slew images
Pre-burst image of 15-350 keV band
Time interval of the image:
-299.800000 -20.472000

# RAcent  DECcent POSerr Theta    Phi  PeakCts   SNR AngSep     Name
#  [deg]    [deg]    ['] [deg]  [deg]                   [']
299.5818  35.2105    0.8  51.6  165.3   9.2903  14.2    0.7	Cyg X-1
308.1147  40.9975    2.0  44.8  173.0   1.8728   5.6    2.7	Cyg X-3
326.1436  38.3566    6.5  30.7  173.0   0.3567   1.8    2.5	Cyg X-2
359.4159  -5.9239    2.4  30.7   47.7   1.1585   4.7  357.1	UNKNOWN
Pre-slew background subtracted image of 15-350 keV band
Time interval of the image:
-20.472000 19.100600

# RAcent  DECcent POSerr Theta    Phi  PeakCts   SNR AngSep     Name
#  [deg]    [deg]    ['] [deg]  [deg]                   [']
299.6361  35.0870   48.7  51.5  165.1   0.0527   0.2    7.2	Cyg X-1
308.1208  41.0614    4.9  44.8  173.1  -0.2966  -2.4    6.5	Cyg X-3
326.1587  38.3167  154.6  30.7  172.9  -0.0055  -0.1    0.7	Cyg X-2
337.4167  19.5606    0.4  20.4  128.3   1.9032  27.4 ------	UNKNOWN
  6.1091  66.5873    2.5  42.0 -126.7   0.6231   4.6 ------	UNKNOWN
Post-slew image of 15-350 keV band
Time interval of the image:
66.100600 302.290000

# RAcent  DECcent POSerr Theta    Phi  PeakCts   SNR AngSep     Name
#  [deg]    [deg]    ['] [deg]  [deg]                   [']
288.8596  10.8295    6.0  47.5  162.6  -3.4735  -1.9    7.8	GRS 1915+105
299.6010  35.2365    1.4  36.7 -161.0   6.1849   8.3    2.2	Cyg X-1
308.1386  41.0281    4.0  32.8 -147.0   2.0810   2.9    4.7	Cyg X-3
325.9803  38.3026    4.4  21.2 -129.7   1.4921   2.6    9.1	Cyg X-2
  6.5315  -5.2145    2.6  37.9   23.8   4.4181   4.5  501.0	UNKNOWN
281.3532  15.1917    2.6  53.5  170.6  10.7746   4.5 ------	UNKNOWN
305.8956  19.3229    2.5  29.7  170.7   3.1133   4.7 ------	UNKNOWN
337.3932  19.5952    1.6   0.0  148.3   4.2012   7.2 ------	UNKNOWN
 32.1608   4.2366    2.6  55.5   -5.5  10.2203   4.5 ------	UNKNOWN
 16.8206  20.2964    2.7  37.0  -22.2   3.5331   4.4 ------	UNKNOWN
273.0364  36.8883    2.8  58.2 -162.2  11.8111   4.1 ------	UNKNOWN