Analysis Summary
Notes:
- 1) No attempt has been made to eliminate the non-significant decimal places.
- 2) This batgrbproduct analysis is done using the HEASARC data.
- 3) This batgrbproduct analysis is using the flight position for the mask-weighting calculation.
======================================================================
                  BAT GRB EVENT DATA PROCESSING REPORT
    Process Script Ver: batgrbproduct v2.46
    Process Start Time: Wed Jan 22 20:44:44 EST 2014
             Host Name: batevent1
   Current Working Dir: /local/data/batevent/batevent_reproc/trigger151334
======================================================================

  Trigger: 00151334      Segment: 000

  BAT Trigger Time: 146274626.88   [s; MET]
      Trigger Stop: 146274627.904   [s; MET]
               UTC: 2005-08-20T23:50:27.194600    [includes UTCF correction]
       Where From?: TDRSS position message

  BAT
    RA: 135.55688251993   Dec: -72.6677827863734  [deg; J2000]

     Catalogged Source?: NO
     Point Source?:      YES
     GRB Indicated?:     YES    [ by BAT flight software ]
     Image S/N Ratio:    8.76
     Image Trigger?:     NO
     Rate S/N Ratio:     14.2828568570857  [ if not an image trigger ]
     Image S/N Ratio:    8.76

  Analysis Position:   [ source = BAT ]
    RA: 135.55688251993   Dec: -72.6677827863734  [deg; J2000]

  Refined Position:   [ source = BAT pre-slew burst ]
    RA: 135.607734559795   Dec: -72.640971198512  [deg; J2000]
        { 09h 02m 25.9s , -72d 38' 27.5" }
         +/- 0.554048352105064 [arcmin] (estimated 90% radius based on SNR)
         +/- 0.136007275792208 [arcmin] (formal 1-sigma fit error)
    SNR: 70.7096772576704

  Angular difference between the analysis and refined position is 1.848068 arcmin

  Partial Coding Fraction: 0.96875    [ including projection effects ]

  Duration
     T90: 12.0640000104904 +/- 0.518906540230266
        Measured from: 1.53999999165535
                   to: 13.6040000021458     [s; relative to TRIGTIME]
     T50: 3.76400002837181 +/- 0.182603392004824
        Measured from: 7.34799998998642
                   to: 11.1120000183582     [s; relative to TRIGTIME]


  Fluence
     Peak Flux  (peak 1 second)
        Measured from: 8.58399999141693
                   to: 9.58399999141693     [s; relative to TRIGTIME]
     Total Fluence
        Measured from: -0.30799999833107
                   to: 15.0200000107288     [s; relative to TRIGTIME]

             Band 1     Band 2     Band 3     Band 4
              15-25      25-50     50-100    100-350     keV
 Total     0.682019   1.200545   1.054493   0.218161
           0.021047   0.022720   0.020626   0.015268 [error]
 Peak      0.082515   0.184423   0.194266   0.048699
           0.006064   0.007096   0.007140   0.004812 [error]

     [ fluence units of on-axis counts / fully illuminated detector ]

======================================================================


====== Table of the duration information =============================

        Value   tstart    tstop
T100   15.328   -0.308   15.020
T90    12.064    1.540   13.604
T50     3.764    7.348   11.112
Peak    1.000    8.584    9.584


====== Spectral Analysis Summary =====================================

Model      : spectral model: simple power-law (PL) and cutoff power-law (CPL)
Ph_index   : photon index: E^{Ph_index}
Ph_90err   : 90% error of the photon index
Epeak      : Epeak in keV
Epeak_90err: 90% error of Epeak
Norm       : normalization at 50 keV in both the PL model and CPL model
Nomr_90err : 90% error of the normalization
chi2       : Chi-Squared
dof        : degree of freedo

=== Time-averaged spectral analysis ===
(Best model with acceptable fit: CPL)

Model Ph_index Ph_90err_low Ph_90err_hi  Epeak  Epeak_90err_low  Epeak_90err_hi  Norm       Nomr_90err_low    Norm_90err_hi    chi2    dof
PL      -1.318    -0.042      0.042       -           -               -         1.41e-02     -3.36e-04          3.36e-04     111.710   57
CPL     -0.596    -0.189      0.197      110.021     -12.167        19.212      2.96e-02     -5.08e-03          6.41e-03      64.070   56


=== 1-s peak spectral analysis ===
(Best model with acceptable fit: CPL)

Model Ph_index Ph_90err_low Ph_90err_hi  Epeak  Epeak_90err_low  Epeak_90err_hi  Norm       Nomr_90err_low    Norm_90err_hi    chi2    dof
PL      -1.003     -0.069     0.069       -           -               -         3.49e-02     -1.47e-03          1.47e-03      82.110   57
CPL     -0.198     -0.302     0.325      128.211     -21.380        42.211      8.00e-02     -2.09e-02          3.04e-02      59.010   56


=== Fluence/Peak Flux Summary ===

              Model    Band1     Band2     Band3     Band4     Band5     Total
                       15-25     25-50    50-100    100-350    15-150    15-350    keV
Fluence         PL   2.33e-07  4.79e-07  7.69e-07  2.76e-06  2.13e-06  4.24e-06   erg/cm2
      90%_error_low -1.10e-08 -1.35e-08 -2.11e-08 -1.67e-07 -5.32e-08 -1.78e-07   erg/cm2
      90%_error_hi   1.12e-08  1.35e-08  2.10e-08  1.74e-07  5.33e-08  1.84e-07   erg/cm2
Peak flux       PL   8.93e-01  1.21e+00  1.21e+00  2.18e+00  4.01e+00  5.49e+00   ph/cm2/s
      90%_error_low -7.26e-02 -6.22e-02 -5.49e-02 -2.00e-01 -1.72e-01 -2.51e-01   ph/cm2/s
      90%_error_hi   7.48e-02  6.19e-02  5.47e-02  2.12e-01  1.72e-01  2.54e-01   ph/cm2/s

Fluence        CPL   1.94e-07  4.98e-07  8.21e-07  1.23e-06  2.05e-06  2.74e-06   erg/cm2
      90%_error_low -1.39e-08 -1.51e-08 -2.53e-08 -2.04e-07 -5.77e-08 -2.08e-07   erg/cm2
      90%_error_hi   1.42e-08  1.51e-08  2.55e-08  2.55e-07  5.76e-08  2.55e-07   erg/cm2
Peak flux      CPL   7.27e-01  1.27e+00  1.33e+00  1.08e+00  3.92e+00  4.41e+00   ph/cm2/s
      90%_error_low -8.94e-02 -7.01e-02 -7.09e-02 -2.26e-01 -1.76e-01 -2.86e-01   ph/cm2/s
      90%_error_hi   9.22e-02  7.05e-02  7.17e-02  2.96e-01  1.76e-01  3.32e-01   ph/cm2/s

======================================================================
Image
Pre-slew 15.0-350.0 keV image (Event data)
#   RAcent    DECcent   POSerr    Theta     Phi              Peak Cts       SNR   Name
  135.6077   -72.6410   0.0027    20.1794   171.0432         3.2045350     70.710 TRIG_00151334

Foreground time interval of the image:
 -0.308  15.020 (delta_t =  15.328 [sec])
Background time interval of the image:
-209.379  -0.308 (delta_t = 209.071 [sec])
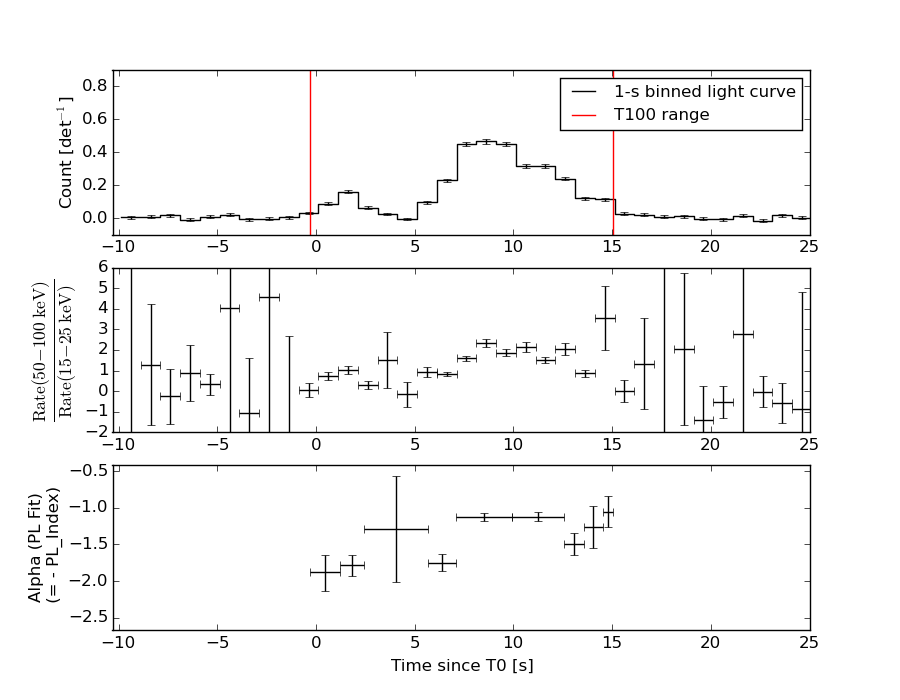
Light Curves
Note: The mask-weighted lightcurves have units of either count/det or counts/sec/det, where a det is 0.4 x 0.4 = 0.16 sq cm.
Full-time range; 1 s binning
Other quick-look light curves:
- 64 ms binning (zoomed)
- 16 ms binning (zoomed)
- 8 ms binning (zoomed)
- 2 ms binning (zoomed)
- SN=5 or 10 s binning (full-time range)
- Raw light curve
Spectra
- 64 ms binning (zoomed)
- 16 ms binning (zoomed)
- 8 ms binning (zoomed)
- 2 ms binning (zoomed)
- SN=5 or 10 s binning (full-time range)
- Raw light curve
Spectra
Notes:
- 1) The fitting includes the systematic errors.
- 2) When the burst includes telescope slew time periods, the fitting uses an average response file made from multiple 5-s response files through out the slew time plus single time preiod for the non-slew times, and weighted by the total counts in the corresponding time period using addrmf. An average response file is needed becuase a spectral fit using the pre-slew DRM will introduce some errors in both a spectral shape and a normalization if the PHA file contains a lot of the slew/post-slew time interval.
- 3) For fits to more complicated models (e.g. a power-law over a cutoff power-law), the BAT team has decided to require a chi-square improvement of more than 6 for each extra dof.
Time averaged spectrum fit using the average DRM
Power-law model
Time interval is from   -0.308 sec. to   15.020 sec.

Spectral model in power-law:
------------------------------------------------------------
Parameters  : value       lower 90%   higher 90%
Photon index: -1.31755     ( -0.0419576   0.0420464 )
Norm@50keV  : 1.41210E-02    ( -0.000335697   0.000335647 )
------------------------------------------------------------
#Fit statistic : Chi-Squared =         111.71 using 59 PHA bins.
# Reduced chi-squared =         1.9598 for     57 degrees of freedom
# Null hypothesis probability =   2.040756e-05

Photon flux (15-150 keV)    in 15.33 sec: 1.69026 ( -0.04344  0.04351 ) ph/cm2/s
Energy fluence (15-150 keV)             : 2.13041e-06 ( -5.32396e-08  5.32859e-08 ) ergs/cm2
Cutoff power-law model

Time interval is from   -0.308 sec. to   15.020 sec.
Spectral model in the cutoff power-law:
------------------------------------------------------------
Parameters  : value       lower 90%   higher 90%
Photon index: -0.595858     ( -0.188608   0.196716 )
Epeak [keV] : 110.021      ( -12.1668 19.2128 )
Norm@50keV  : 2.96300E-02    ( -0.00508389   0.00641199 )
------------------------------------------------------------
#Fit statistic : Chi-Squared =          64.07 using 59 PHA bins.
# Reduced chi-squared =          1.144 for     56 degrees of freedom
# Null hypothesis probability =   2.145765e-01

Photon flux (15-150 keV)    in 15.33 sec: 1.61864 ( -0.04637  0.04651 ) ph/cm2/s
Energy fluence (15-150 keV)             : 2.05089e-06 ( -5.77334e-08  5.75996e-08 ) ergs/cm2
1-s peak spectrum fit
Power-law model
Time interval is from    8.584 sec. to    9.584 sec.

Spectral model in power-law:
------------------------------------------------------------
Parameters  : value       lower 90%   higher 90%
Photon index: -1.00251     ( -0.0685806   0.0691671 )
Norm@50keV  : 3.48671E-02    ( -0.0014705   0.00146938 )
------------------------------------------------------------
#Fit statistic : Chi-Squared =          82.11 using 59 PHA bins.
# Reduced chi-squared =          1.441 for     57 degrees of freedom
# Null hypothesis probability =   1.636748e-02

Photon flux (15-150 keV)    in 1 sec: 4.01475 ( -0.17194  0.17204 ) ph/cm2/s
Energy fluence (15-150 keV)             : 3.76738e-07 ( -1.7146e-08  1.71929e-08 ) ergs/cm2
Cutoff power-law model
Time interval is from    8.584 sec. to    9.584 sec.
Spectral model in the cutoff power-law:
------------------------------------------------------------
Parameters  : value       lower 90%   higher 90%
Photon index: -0.198075     ( -0.302329   0.32516 )
Epeak [keV] : 128.211      ( -21.38 42.2115 )
Norm@50keV  : 7.99959E-02    ( -0.0208576   0.0303828 )
------------------------------------------------------------
#Fit statistic : Chi-Squared =          59.01 using 59 PHA bins.
# Reduced chi-squared =          1.054 for     56 degrees of freedom
# Null hypothesis probability =   3.660398e-01

Photon flux (15-150 keV)    in 1 sec: 3.91520 ( -0.17585  0.17588 ) ph/cm2/s
Energy fluence (15-150 keV)             : 3.64888e-07 ( -1.82629e-08  1.81925e-08 ) ergs/cm2
Time-resolved spectra
Distribution
T90 vs. Hardness ratio plot
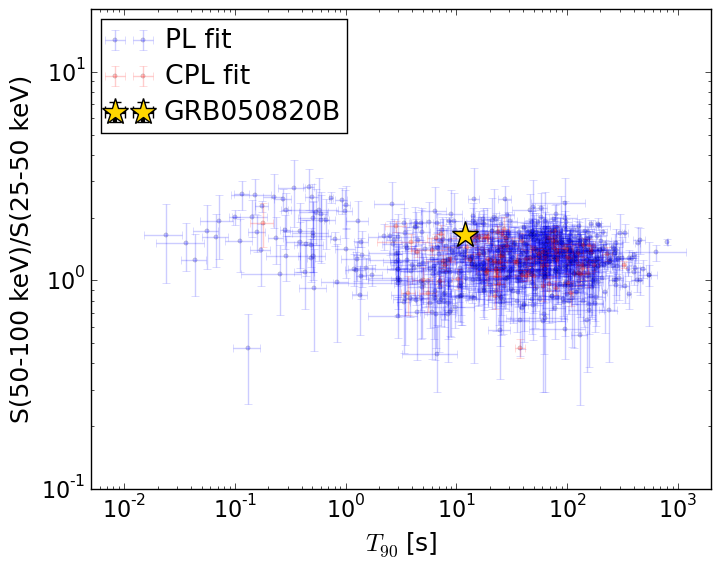
T90                                   = 12.064 sec.
Hardness ratio (energy fluence ratio) = 1.6487698409
S(15-50 keV) vs. S(50-150 keV) plot
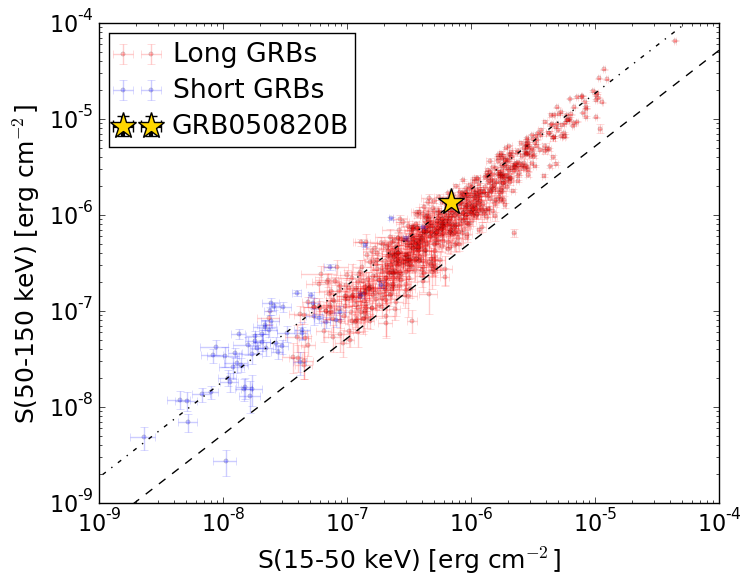
S(15-50 keV)  = 6.918554e-07
S(50-150 keV) = 1.3590176e-06
The dash-dotted line and the dashed line traces the fluences calculated from the Band function with Epeak = 15 and 150 keV, respectively. Both lines assume a canonical values of alpha = -1 and beta = -2.5.
Mask shadow pattern
IMX = -3.630394286445425E-01, IMY = -5.721907705393467E-02
Spacecraft aspect plot
Bright source in the pre-burst/pre-slew/post-slew images
Pre-burst image of 15-350 keV band
Time interval of the image:
-209.379400 -0.308000

# RAcent  DECcent POSerr Theta    Phi  PeakCts   SNR AngSep     Name
#  [deg]    [deg]    ['] [deg]  [deg]                   [']
135.5196 -40.5816    2.0  38.5 -130.6   1.6539   5.8    1.7	Vela X-1
170.1160 -60.5763    2.0   9.4 -126.6   0.7984   5.7    6.5	Cen X-3
186.6481 -62.7682    0.4   2.0  -81.6   3.9317  25.9    0.3	GX 301-2
256.0476 -37.7924    4.7  46.8   36.4   1.2721   2.4    4.2	4U 1700-377
256.5802 -36.4801    9.7  48.2   35.9   0.7164   1.2    7.8	GX 349+2
264.5404 -44.4477   21.9  45.0   49.0   0.3135   0.5    8.7	4U 1735-44
 19.1073 -78.4900    2.5  36.9  130.7   1.4516   4.6 ------	UNKNOWN
213.3856 -13.9895    2.2  53.3  -22.4   2.2241   5.2 ------	UNKNOWN
191.0119 -16.1967    2.6  48.3  -49.8   3.2610   4.4 ------	UNKNOWN
Pre-slew background subtracted image of 15-350 keV band
Time interval of the image:
-0.308000 15.020000

# RAcent  DECcent POSerr Theta    Phi  PeakCts   SNR AngSep     Name
#  [deg]    [deg]    ['] [deg]  [deg]                   [']
135.7366 -40.4537   40.5  38.5 -130.3  -0.0238  -0.3   11.3	Vela X-1
170.4678 -60.7542    4.9   9.2 -126.9  -0.1063  -2.3    9.1	Cen X-3
186.6773 -62.7498    4.3   2.0  -81.0  -0.1195  -2.7    1.4	GX 301-2
256.0593 -37.9864    5.3  46.7   36.5   0.3348   2.2    9.2	4U 1700-377
256.4787 -36.4831    7.5  48.1   35.8  -0.2903  -1.5    4.2	GX 349+2
264.7614 -44.3224    3.4  45.2   49.0  -0.6785  -3.4    7.7	4U 1735-44
  3.1869 -72.2167    2.5  43.2  124.8   0.9500   4.6 ------	UNKNOWN
135.6077 -72.6410    0.2  20.2  171.0   3.2045  70.8 ------	UNKNOWN
106.7062 -63.5222    3.0  33.4 -179.5   0.2180   3.9 ------	UNKNOWN
197.4628 -44.4191    2.6  20.7  -34.9   0.1958   4.5 ------	UNKNOWN
149.2487 -30.2540    2.8  42.1 -107.7   0.7597   4.2 ------	UNKNOWN
Post-slew image of 15-350 keV band
Time interval of the image: