Analysis Summary
Notes:
- 1) No attempt has been made to eliminate the non-significant decimal places.
- 2) This batgrbproduct analysis is done using the HEASARC data.
- 3) This batgrbproduct analysis is using the flight position for the mask-weighting calculation.
======================================================================
                  BAT GRB EVENT DATA PROCESSING REPORT
    Process Script Ver: batgrbproduct v2.46
    Process Start Time: Wed Jan 22 20:41:25 EST 2014
             Host Name: batevent1
   Current Working Dir: /local/data/batevent/batevent_reproc/trigger151486
======================================================================

  Trigger: 00151486      Segment: 000

  BAT Trigger Time: 146375368.832   [s; MET]
      Trigger Stop: 146375370.88   [s; MET]
               UTC: 2005-08-22T03:49:29.144560    [includes UTCF correction]
       Where From?: TDRSS position message

  BAT
    RA: 51.0802641049472   Dec: -46.0231259929805  [deg; J2000]

     Catalogged Source?: NO
     Point Source?:      YES
     GRB Indicated?:     YES    [ by BAT flight software ]
     Image S/N Ratio:    9.73
     Image Trigger?:     NO
     Rate S/N Ratio:     7.41619848709566  [ if not an image trigger ]
     Image S/N Ratio:    9.73

  Analysis Position:   [ source = BAT ]
    RA: 51.0802641049472   Dec: -46.0231259929805  [deg; J2000]

  Refined Position:   [ source = BAT pre-slew burst ]
    RA: 51.1031497598258   Dec: -46.0289054584432  [deg; J2000]
        { 03h 24m 24.8s , -46d 01' 44.1" }
         +/- 1.65068220179193 [arcmin] (estimated 90% radius based on SNR)
         +/- 0.762869103238667 [arcmin] (formal 1-sigma fit error)
    SNR: 14.8651935312887

  Angular difference between the analysis and refined position is 1.014518 arcmin

  Partial Coding Fraction: 0.3710938    [ including projection effects ]

  Duration
     T90: 104.291999995708 +/- 15.8205117471842
        Measured from: 0.848000019788742
                   to: 105.140000015497     [s; relative to TRIGTIME]
     T50: 45.4920000135899 +/- 4.95434557885522
        Measured from: 10.6240000128746
                   to: 56.1160000264645     [s; relative to TRIGTIME]


  Fluence
     Peak Flux  (peak 1 second)
        Measured from: 47.5720000267029
                   to: 48.5720000267029     [s; relative to TRIGTIME]
     Total Fluence
        Measured from: -1.55599999427795
                   to: 133.688000023365     [s; relative to TRIGTIME]

             Band 1     Band 2     Band 3     Band 4
              15-25      25-50     50-100    100-350     keV
 Total     2.181269   1.910533   0.721018   0.374851
           0.085050   0.090213   0.087177   0.094131 [error]
 Peak      0.089694   0.105115   0.050321   0.002453
           0.007774   0.008196   0.007465   0.007621 [error]

     [ fluence units of on-axis counts / fully illuminated detector ]

======================================================================


====== Table of the duration information =============================

        Value   tstart    tstop
T100  135.244   -1.556  133.688
T90   104.292    0.848  105.140
T50    45.492   10.624   56.116
Peak    1.000   47.572   48.572


====== Spectral Analysis Summary =====================================

Model      : spectral model: simple power-law (PL) and cutoff power-law (CPL)
Ph_index   : photon index: E^{Ph_index}
Ph_90err   : 90% error of the photon index
Epeak      : Epeak in keV
Epeak_90err: 90% error of Epeak
Norm       : normalization at 50 keV in both the PL model and CPL model
Nomr_90err : 90% error of the normalization
chi2       : Chi-Squared
dof        : degree of freedo

=== Time-averaged spectral analysis ===
(Best model with acceptable fit: PL)

Model Ph_index Ph_90err_low Ph_90err_hi  Epeak  Epeak_90err_low  Epeak_90err_hi  Norm       Nomr_90err_low    Norm_90err_hi    chi2    dof
PL      -2.326    -0.134      0.129       -           -               -         1.94e-03     -1.67e-04          1.65e-04      53.570   57
CPL     -1.807    -0.196      0.710       13.935     -13.090        14.789      4.00e-03     -1.27e-03          6.87e-03      51.350   56


=== 1-s peak spectral analysis ===
(Best model with acceptable fit: PL)

Model Ph_index Ph_90err_low Ph_90err_hi  Epeak  Epeak_90err_low  Epeak_90err_hi  Norm       Nomr_90err_low    Norm_90err_hi    chi2    dof
PL      -1.982     -0.188     0.179       -           -               -         1.50e-02     -1.83e-03          1.79e-03      48.530   57
CPL     -1.325     -0.752     0.926       42.561      N/A           N/A         3.59e-02        N/A               N/A         46.360   56


=== Fluence/Peak Flux Summary ===

              Model    Band1     Band2     Band3     Band4     Band5     Total
                       15-25     25-50    50-100    100-350    15-150    15-350    keV
Fluence         PL   7.31e-07  8.16e-07  6.50e-07  8.60e-07  2.51e-06  3.06e-06   erg/cm2
      90%_error_low -6.14e-08 -4.90e-08 -7.75e-08 -1.87e-07 -1.72e-07 -2.82e-07   erg/cm2
      90%_error_hi   6.26e-08  4.89e-08  8.02e-08  2.23e-07  1.75e-07  3.08e-07   erg/cm2
Peak flux       PL   9.81e-01  7.44e-01  3.76e-01  2.73e-01  2.23e+00  2.37e+00   ph/cm2/s
      90%_error_low -1.33e-01 -6.98e-02 -6.05e-02 -7.63e-02 -2.09e-01 -2.25e-01   ph/cm2/s
      90%_error_hi   1.37e-01  6.98e-02  6.15e-02  9.33e-02  2.09e-01  2.26e-01   ph/cm2/s

Fluence        CPL   7.03e-07  8.54e-07  5.99e-07  3.09e-07  2.35e-06  2.47e-06   erg/cm2
      90%_error_low -7.05e-08 -3.04e-08 -1.12e-07 -2.03e-07 -2.32e-07 -3.25e-07   erg/cm2
      90%_error_hi   6.66e-08  6.68e-08  1.02e-07  3.42e-07  2.29e-07  4.35e-07   erg/cm2
Peak flux      CPL   1.00e+00  7.43e-01  3.69e-01  1.13e-01  2.23e+00  2.35e+00   ph/cm2/s
      90%_error_low -2.38e-01 -6.80e-02 -7.07e-02 -7.41e-02 -2.09e-01     N/A     ph/cm2/s
      90%_error_hi   7.20e-02  7.17e-02  6.77e-02  1.69e-01  2.09e-01     N/A     ph/cm2/s

======================================================================
Image
Pre-slew 15.0-350.0 keV image (Event data)
#   RAcent    DECcent   POSerr    Theta     Phi              Peak Cts       SNR   Name
   51.1031   -46.0289   0.0130    41.9422   165.5905         1.8206522     14.865 TRIG_00151486

Foreground time interval of the image:
 -1.556  23.869 (delta_t =  25.425 [sec])
Background time interval of the image:
-119.832  -1.556 (delta_t = 118.276 [sec])
Light Curves
Note: The mask-weighted lightcurves have units of either count/det or counts/sec/det, where a det is 0.4 x 0.4 = 0.16 sq cm.
Full-time range; 1 s binning
Other quick-look light curves:
- 64 ms binning (zoomed)
- 16 ms binning (zoomed)
- 8 ms binning (zoomed)
- 2 ms binning (zoomed)
- SN=5 or 10 s binning (full-time range)
- Raw light curve
Spectra
- 64 ms binning (zoomed)
- 16 ms binning (zoomed)
- 8 ms binning (zoomed)
- 2 ms binning (zoomed)
- SN=5 or 10 s binning (full-time range)
- Raw light curve
Spectra
Notes:
- 1) The fitting includes the systematic errors.
- 2) When the burst includes telescope slew time periods, the fitting uses an average response file made from multiple 5-s response files through out the slew time plus single time preiod for the non-slew times, and weighted by the total counts in the corresponding time period using addrmf. An average response file is needed becuase a spectral fit using the pre-slew DRM will introduce some errors in both a spectral shape and a normalization if the PHA file contains a lot of the slew/post-slew time interval.
- 3) For fits to more complicated models (e.g. a power-law over a cutoff power-law), the BAT team has decided to require a chi-square improvement of more than 6 for each extra dof.
Time averaged spectrum fit using the average DRM
Power-law model
Time interval is from   -1.556 sec. to  133.688 sec.

Spectral model in power-law:
------------------------------------------------------------
Parameters  : value       lower 90%   higher 90%
Photon index: -2.32621     ( -0.133534   0.128849 )
Norm@50keV  : 1.93607E-03    ( -0.000166594   0.000164962 )
------------------------------------------------------------
#Fit statistic : Chi-Squared =          53.57 using 59 PHA bins.
# Reduced chi-squared =         0.9398 for     57 degrees of freedom
# Null hypothesis probability =   6.046140e-01

Photon flux (15-150 keV)    in 135.2 sec: 0.343388 ( -0.020212  0.020237 ) ph/cm2/s
Energy fluence (15-150 keV)             : 2.51441e-06 ( -1.71763e-07  1.74937e-07 ) ergs/cm2
Cutoff power-law model
Time interval is from   -1.556 sec. to  133.688 sec.
Spectral model in the cutoff power-law:
------------------------------------------------------------
Parameters  : value       lower 90%   higher 90%
Photon index: -1.80709     ( -0.196156   0.710444 )
Epeak [keV] : 13.9350      ( -13.09 14.7885 )
Norm@50keV  : 4.00065E-03    ( -0.00126996   0.00687024 )
------------------------------------------------------------
#Fit statistic : Chi-Squared =          51.35 using 59 PHA bins.
# Reduced chi-squared =         0.9169 for     56 degrees of freedom
# Null hypothesis probability =   6.513948e-01

Photon flux (15-150 keV)    in 135.2 sec: 0.333312 ( -0.023153  0.022257 ) ph/cm2/s
Energy fluence (15-150 keV)             : 2.34767e-06 ( -2.32101e-07  2.2905e-07 ) ergs/cm2
1-s peak spectrum fit
Power-law model
Time interval is from   47.572 sec. to   48.572 sec.

Spectral model in power-law:
------------------------------------------------------------
Parameters  : value       lower 90%   higher 90%
Photon index: -1.98192     ( -0.188245   0.179039 )
Norm@50keV  : 1.49746E-02    ( -0.00182973   0.00179149 )
------------------------------------------------------------
#Fit statistic : Chi-Squared =          48.53 using 59 PHA bins.
# Reduced chi-squared =         0.8515 for     57 degrees of freedom
# Null hypothesis probability =   7.801760e-01

Photon flux (15-150 keV)    in 1 sec: 2.22789 ( -0.20928  0.20931 ) ph/cm2/s
Energy fluence (15-150 keV)             : 1.37997e-07 ( -1.57692e-08  1.61588e-08 ) ergs/cm2
Cutoff power-law model
Time interval is from   47.572 sec. to   48.572 sec.
Spectral model in the cutoff power-law:
------------------------------------------------------------
Parameters  : value       lower 90%   higher 90%
Photon index: -1.32483     ( -0.75187   0.926161 )
Epeak [keV] : 42.5606      (   )
Norm@50keV  : 3.58774E-02    (     )
------------------------------------------------------------
#Fit statistic : Chi-Squared =          46.36 using 59 PHA bins.
# Reduced chi-squared =         0.8279 for     56 degrees of freedom
# Null hypothesis probability =   8.172192e-01

Photon flux (15-150 keV)    in 1 sec: 2.22858 ( -0.20902  0.20852 ) ph/cm2/s
Energy fluence (15-150 keV)             : 0 ( 0  0 ) ergs/cm2
Time-resolved spectra
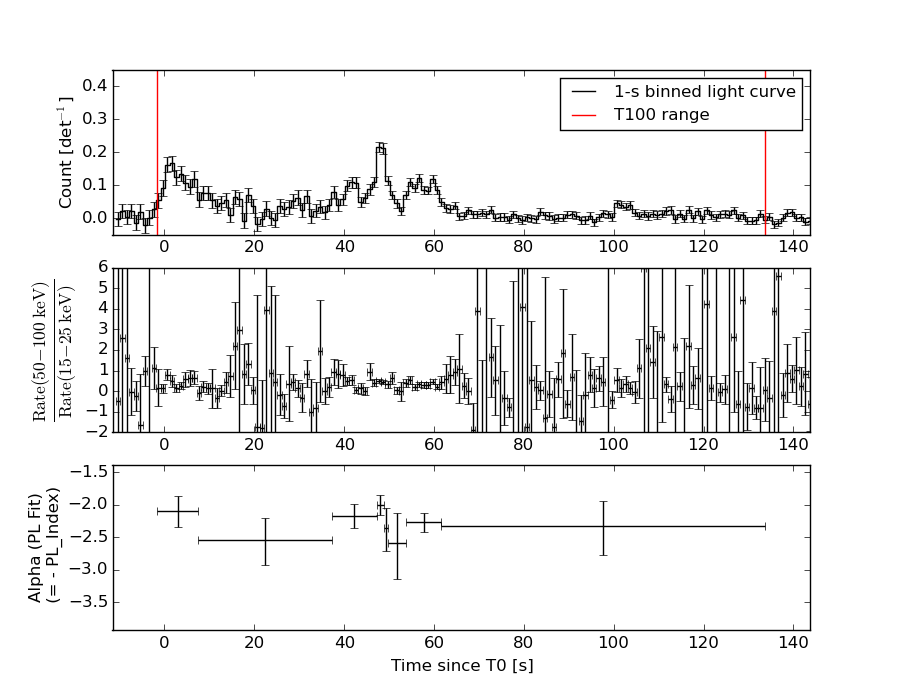
Distribution
T90 vs. Hardness ratio plot
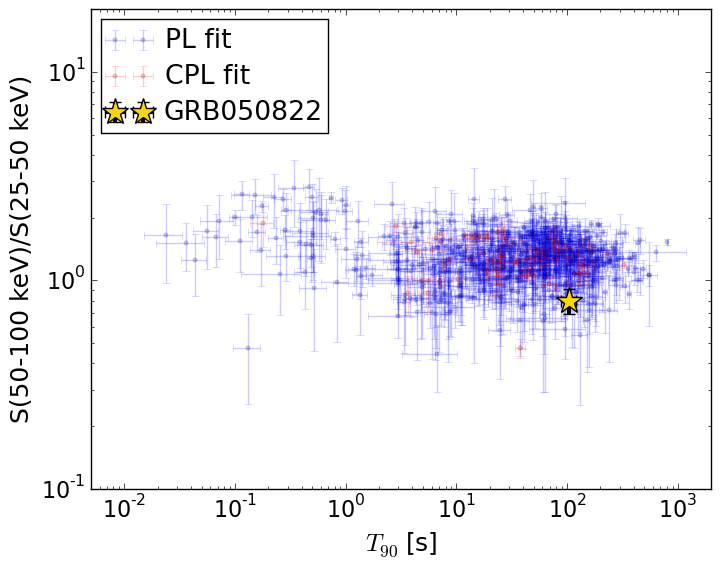
T90                                   = 104.292 sec.
Hardness ratio (energy fluence ratio) = 0.797663951131
S(15-50 keV) vs. S(50-150 keV) plot
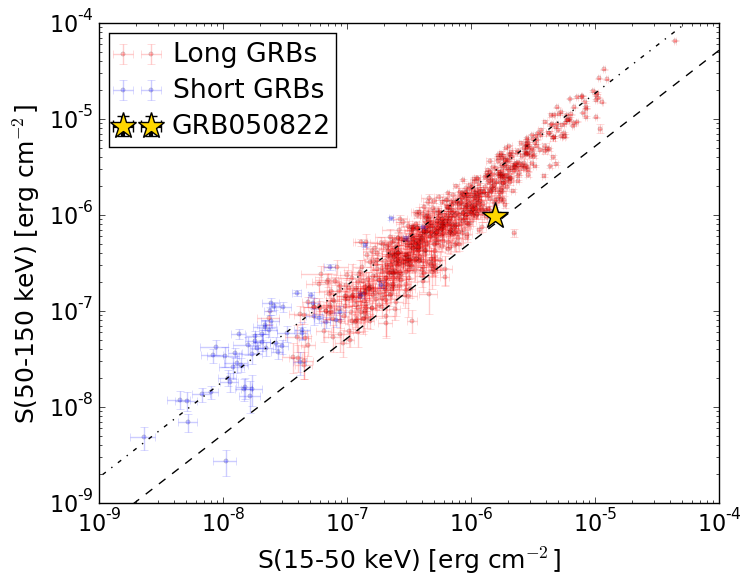
S(15-50 keV)  = 1.5462685e-06
S(50-150 keV) = 9.681401e-07
The dash-dotted line and the dashed line traces the fluences calculated from the Band function with Epeak = 15 and 150 keV, respectively. Both lines assume a canonical values of alpha = -1 and beta = -2.5.
Mask shadow pattern
IMX = -8.703118914732342E-01, IMY = -2.236117712951145E-01
Spacecraft aspect plot
Bright source in the pre-burst/pre-slew/post-slew images
Pre-burst image of 15-350 keV band
Time interval of the image:
-119.832000 -1.556000

# RAcent  DECcent POSerr Theta    Phi  PeakCts   SNR AngSep     Name
#  [deg]    [deg]    ['] [deg]  [deg]                   [']
170.4196 -60.6390   41.5  26.9  -62.2   0.0417   0.3    3.2	Cen X-3
186.6420 -62.7592    2.4  26.1  -44.4   0.6542   4.9    0.8	GX 301-2
264.8266 -44.3441    5.1  50.0   26.3   1.1115   2.2    7.3	4U 1735-44
221.4505 -47.5146    2.5  44.1  -14.3   0.9071   4.6 ------	UNKNOWN
109.4202 -36.0678    2.2  49.0 -131.6   2.9685   5.2 ------	UNKNOWN
Pre-slew background subtracted image of 15-350 keV band
Time interval of the image:
-1.556000 23.868600

# RAcent  DECcent POSerr Theta    Phi  PeakCts   SNR AngSep     Name
#  [deg]    [deg]    ['] [deg]  [deg]                   [']
170.0599 -60.6543    9.0  26.8  -62.6  -0.1075  -1.3    7.8	Cen X-3
186.4178 -62.8624   42.3  26.0  -44.6  -0.0203  -0.3    8.6	GX 301-2
264.8140 -44.5556    5.7  49.8   26.3  -0.5273  -2.0    7.0	4U 1735-44
 51.1031 -46.0289    0.8  41.9  165.6   1.8200  14.9 ------	UNKNOWN
 81.6478 -31.3987    2.1  54.5 -160.8   1.1332   5.4 ------	UNKNOWN
Post-slew image of 15-350 keV band
Time interval of the image:
82.268630 302.207900

# RAcent  DECcent POSerr Theta    Phi  PeakCts   SNR AngSep     Name
#  [deg]    [deg]    ['] [deg]  [deg]                   [']
  5.6838 -28.1281    3.2  39.7  101.7   2.5304   3.6 ------	UNKNOWN
 20.9551 -37.3383    2.4  24.0  101.5   1.1641   4.9 ------	UNKNOWN
 46.0822 -16.8427    2.6  29.5  171.2   0.9151   4.5 ------	UNKNOWN