Analysis Summary
Notes:
- 1) No attempt has been made to eliminate the non-significant decimal places.
- 2) This batgrbproduct analysis is done using the HEASARC data.
- 3) This batgrbproduct analysis is using the flight position for the mask-weighting calculation.
======================================================================
                  BAT GRB EVENT DATA PROCESSING REPORT
    Process Script Ver: batgrbproduct v2.46
    Process Start Time: Wed Jan 22 20:35:07 EST 2014
             Host Name: batevent1
   Current Working Dir: /local/data/batevent/batevent_reproc/trigger152113
======================================================================

  Trigger: 00152113      Segment: 000

  BAT Trigger Time: 146729889.984   [s; MET]
      Trigger Stop: 146729898.176   [s; MET]
               UTC: 2005-08-26T06:18:10.289400    [includes UTCF correction]
       Where From?: TDRSS position message

  BAT
    RA: 87.7286242278895   Dec: -2.67982454693241  [deg; J2000]

     Catalogged Source?: NO
     Point Source?:      YES
     GRB Indicated?:     YES    [ by BAT flight software ]
     Image S/N Ratio:    8.16
     Image Trigger?:     NO
     Rate S/N Ratio:     12.4498995979887  [ if not an image trigger ]
     Image S/N Ratio:    8.16

  Analysis Position:   [ source = BAT ]
    RA: 87.7286242278895   Dec: -2.67982454693241  [deg; J2000]

  Refined Position:   [ source = BAT pre-slew burst ]
    RA: 87.7548499261731   Dec: -2.64583212585851  [deg; J2000]
        { 05h 51m 01.2s , -02d 38' 45.0" }
         +/- 2.02505812645427 [arcmin] (estimated 90% radius based on SNR)
         +/- 1.11954119839552 [arcmin] (formal 1-sigma fit error)
    SNR: 11.1007042482143

  Angular difference between the analysis and refined position is 2.574963 arcmin

  Partial Coding Fraction: 0.8125    [ including projection effects ]

  Duration
     T90: 29.5999999642372 +/- 6.30980951371596
        Measured from: 0.527999997138977
                   to: 30.1279999613762     [s; relative to TRIGTIME]
     T50: 17.391999989748 +/- 10.3361733606588
        Measured from: 4.11199998855591
                   to: 21.5039999783039     [s; relative to TRIGTIME]


  Fluence
     Peak Flux  (peak 1 second)
        Measured from: -0.203999996185303
                   to: 0.796000003814697     [s; relative to TRIGTIME]
     Total Fluence
        Measured from: -0.208000004291534
                   to: 39.5839999914169     [s; relative to TRIGTIME]

             Band 1     Band 2     Band 3     Band 4
              15-25      25-50     50-100    100-350     keV
 Total     0.143475   0.219637   0.197312   0.092531
           0.032931   0.033823   0.029185   0.025075 [error]
 Peak      0.014602   0.012165   0.019308   0.007652
           0.005413   0.005421   0.004726   0.004098 [error]

     [ fluence units of on-axis counts / fully illuminated detector ]

======================================================================


====== Table of the duration information =============================

        Value   tstart    tstop
T100   39.792   -0.208   39.584
T90    29.600    0.528   30.128
T50    17.392    4.112   21.504
Peak    1.000   -0.204    0.796


====== Spectral Analysis Summary =====================================

Model      : spectral model: simple power-law (PL) and cutoff power-law (CPL)
Ph_index   : photon index: E^{Ph_index}
Ph_90err   : 90% error of the photon index
Epeak      : Epeak in keV
Epeak_90err: 90% error of Epeak
Norm       : normalization at 50 keV in both the PL model and CPL model
Nomr_90err : 90% error of the normalization
chi2       : Chi-Squared
dof        : degree of freedo

=== Time-averaged spectral analysis ===
(Best model with acceptable fit: PL)

Model Ph_index Ph_90err_low Ph_90err_hi  Epeak  Epeak_90err_low  Epeak_90err_hi  Norm       Nomr_90err_low    Norm_90err_hi    chi2    dof
PL      -1.234    -0.292      0.299       -           -               -         1.05e-03     -1.59e-04          1.59e-04      65.800   57
CPL     -1.233    -0.291      0.342     9999.360    -9999.360      -9999.360      1.05e-03     -1.60e-04          1.01e-03      65.810   56


=== 1-s peak spectral analysis ===
(Best model with acceptable fit: PL)

Model Ph_index Ph_90err_low Ph_90err_hi  Epeak  Epeak_90err_low  Epeak_90err_hi  Norm       Nomr_90err_low    Norm_90err_hi    chi2    dof
PL      -1.252     -0.666     0.701       -           -               -         3.17e-03     -1.01e-03          1.01e-03      36.890   57
CPL     -1.275     -0.645     0.734     9999.360    -9999.360      -9999.360      3.15e-03     -9.86e-04          1.04e-02      36.910   56


=== Fluence/Peak Flux Summary ===

              Model    Band1     Band2     Band3     Band4     Band5     Total
                       15-25     25-50    50-100    100-350    15-150    15-350    keV
Fluence         PL   4.16e-08  8.99e-08  1.53e-07  5.98e-07  4.20e-07  8.82e-07   erg/cm2
      90%_error_low -1.22e-08 -1.62e-08 -2.92e-08 -2.26e-07 -7.16e-08 -2.47e-07   erg/cm2
      90%_error_hi   1.34e-08  1.56e-08  2.85e-08  3.13e-07  7.24e-08  3.22e-07   erg/cm2
Peak flux       PL   1.03e-01  1.20e-01  1.01e-01  1.43e-01  3.75e-01  4.66e-01   ph/cm2/s
      90%_error_low -6.10e-02 -4.87e-02 -4.14e-02 -9.49e-02 -1.23e-01 -1.55e-01   ph/cm2/s
      90%_error_hi   7.43e-02  4.42e-02  3.85e-02  1.80e-01  1.24e-01  1.67e-01   ph/cm2/s

Fluence        CPL   4.15e-08  9.00e-08  1.53e-07  6.06e-07  4.19e-07  8.80e-07   erg/cm2
      90%_error_low    N/A       N/A       N/A       N/A       N/A    -3.67e-07   erg/cm2
      90%_error_hi     N/A       N/A       N/A       N/A       N/A     2.04e-07   erg/cm2
Peak flux      CPL   1.03e-01  1.20e-01  1.00e-01  1.42e-01  3.77e-01  4.71e-01   ph/cm2/s
      90%_error_low     N/A       N/A       N/A       N/A       N/A   -4.71e-01   ph/cm2/s
      90%_error_hi      N/A       N/A       N/A       N/A       N/A    1.38e-01   ph/cm2/s

======================================================================
Image
Pre-slew 15.0-350.0 keV image (Event data)
#   RAcent    DECcent   POSerr    Theta     Phi              Peak Cts       SNR   Name
   87.7548    -2.6458   0.0173    17.6442    52.2266         0.7552190     11.101 TRIG_00152113

Foreground time interval of the image:
 -0.208  39.584 (delta_t =  39.792 [sec])
Background time interval of the image:
-231.883  -0.208 (delta_t = 231.675 [sec])
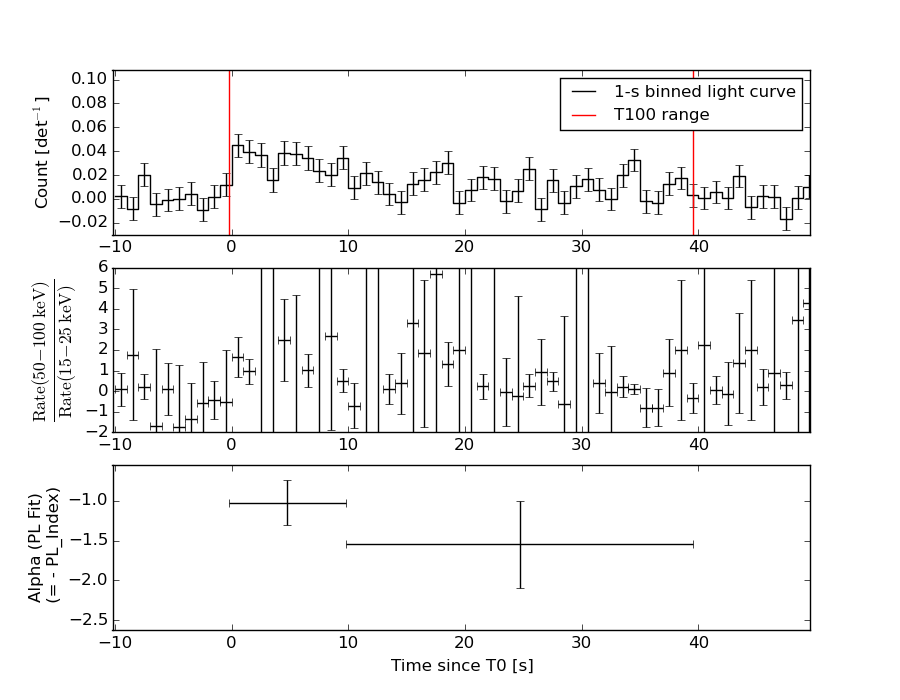
Light Curves
Note: The mask-weighted lightcurves have units of either count/det or counts/sec/det, where a det is 0.4 x 0.4 = 0.16 sq cm.
Full-time range; 1 s binning
Other quick-look light curves:
- 64 ms binning (zoomed)
- 16 ms binning (zoomed)
- 8 ms binning (zoomed)
- 2 ms binning (zoomed)
- SN=5 or 10 s binning (full-time range)
- Raw light curve
Spectra
- 64 ms binning (zoomed)
- 16 ms binning (zoomed)
- 8 ms binning (zoomed)
- 2 ms binning (zoomed)
- SN=5 or 10 s binning (full-time range)
- Raw light curve
Spectra
Notes:
- 1) The fitting includes the systematic errors.
- 2) When the burst includes telescope slew time periods, the fitting uses an average response file made from multiple 5-s response files through out the slew time plus single time preiod for the non-slew times, and weighted by the total counts in the corresponding time period using addrmf. An average response file is needed becuase a spectral fit using the pre-slew DRM will introduce some errors in both a spectral shape and a normalization if the PHA file contains a lot of the slew/post-slew time interval.
- 3) For fits to more complicated models (e.g. a power-law over a cutoff power-law), the BAT team has decided to require a chi-square improvement of more than 6 for each extra dof.
Time averaged spectrum fit using the average DRM
Power-law model
Time interval is from   -0.208 sec. to   39.584 sec.

Spectral model in power-law:
------------------------------------------------------------
Parameters  : value       lower 90%   higher 90%
Photon index: -1.23405     ( -0.292271   0.299205 )
Norm@50keV  : 1.04899E-03    ( -0.000159148   0.000159139 )
------------------------------------------------------------
#Fit statistic : Chi-Squared =          65.80 using 59 PHA bins.
# Reduced chi-squared =          1.154 for     57 degrees of freedom
# Null hypothesis probability =   1.985151e-01

Photon flux (15-150 keV)    in 39.79 sec: 0.123753 ( -0.019491  0.01955 ) ph/cm2/s
Energy fluence (15-150 keV)             : 4.1955e-07 ( -7.16021e-08  7.24262e-08 ) ergs/cm2
Cutoff power-law model

Time interval is from   -0.208 sec. to   39.584 sec.
Spectral model in the cutoff power-law:
------------------------------------------------------------
Parameters  : value       lower 90%   higher 90%
Photon index: -1.23334     ( -0.29112   0.341364 )
Epeak [keV] : 9999.36      ( -9999.36 -9999.36 )
Norm@50keV  : 1.05359E-03    ( -0.000159773   0.00100676 )
------------------------------------------------------------
#Fit statistic : Chi-Squared =          65.81 using 59 PHA bins.
# Reduced chi-squared =          1.175 for     56 degrees of freedom
# Null hypothesis probability =   1.735288e-01

Photon flux (15-150 keV)    in 39.79 sec: 0.123733 ( -0.019495  0.019545 ) ph/cm2/s
Energy fluence (15-150 keV)             : 4.19307e-07 ( 0  0 ) ergs/cm2
1-s peak spectrum fit
Power-law model
Time interval is from   -0.204 sec. to    0.796 sec.

Spectral model in power-law:
------------------------------------------------------------
Parameters  : value       lower 90%   higher 90%
Photon index: -1.25186     ( -0.666531   0.700977 )
Norm@50keV  : 3.16719E-03    ( -0.00101178   0.00100884 )
------------------------------------------------------------
#Fit statistic : Chi-Squared =          36.89 using 59 PHA bins.
# Reduced chi-squared =         0.6473 for     57 degrees of freedom
# Null hypothesis probability =   9.821702e-01

Photon flux (15-150 keV)    in 1 sec: 0.374705 ( -0.123336  0.123677 ) ph/cm2/s
Energy fluence (15-150 keV)             : 3.16862e-08 ( -1.15067e-08  1.17698e-08 ) ergs/cm2
Cutoff power-law model
Time interval is from   -0.204 sec. to    0.796 sec.
Spectral model in the cutoff power-law:
------------------------------------------------------------
Parameters  : value       lower 90%   higher 90%
Photon index: -1.27467     ( -0.646759   0.732358 )
Epeak [keV] : 9999.36      ( -9999.36 -9999.36 )
Norm@50keV  : 3.15215E-03    ( -0.00101144   0.0103614 )
------------------------------------------------------------
#Fit statistic : Chi-Squared =          36.91 using 59 PHA bins.
# Reduced chi-squared =         0.6591 for     56 degrees of freedom
# Null hypothesis probability =   9.771435e-01

Photon flux (15-150 keV)    in 1 sec: 0.376972 (    ) ph/cm2/s
Energy fluence (15-150 keV)             : 3.15573e-08 ( 0  0 ) ergs/cm2
Time-resolved spectra
Distribution
T90 vs. Hardness ratio plot
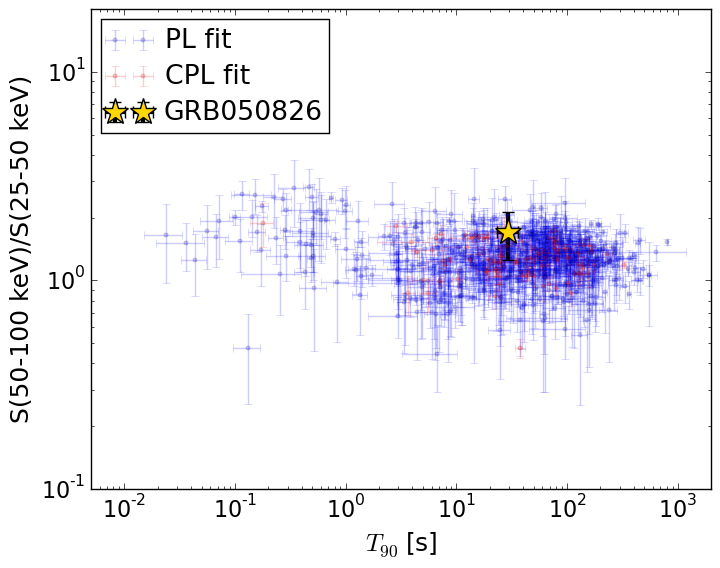
T90                                   = 29.6 sec.
Hardness ratio (energy fluence ratio) = 1.70055286753
S(15-50 keV) vs. S(50-150 keV) plot
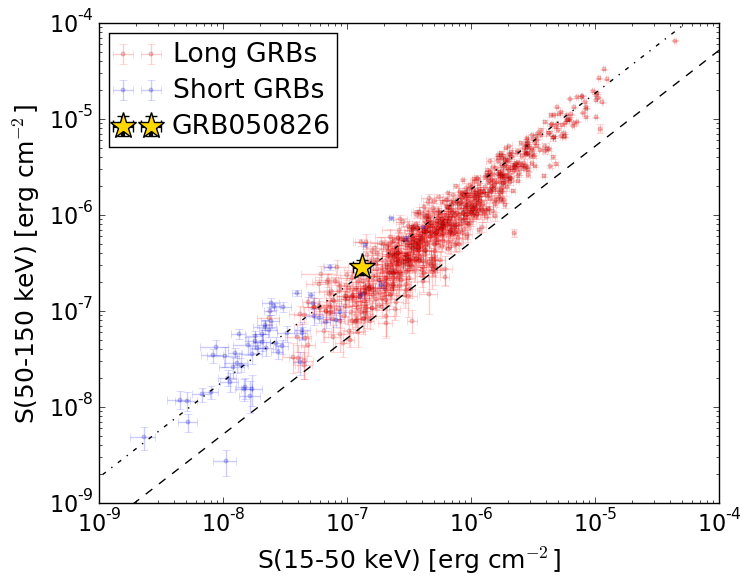
S(15-50 keV)  = 1.3147491e-07
S(50-150 keV) = 2.88073e-07
The dash-dotted line and the dashed line traces the fluences calculated from the Band function with Epeak = 15 and 150 keV, respectively. Both lines assume a canonical values of alpha = -1 and beta = -2.5.
Mask shadow pattern
IMX = 1.948287804055376E-01, IMY = -2.514127592022140E-01
Spacecraft aspect plot
Bright source in the pre-burst/pre-slew/post-slew images
Pre-burst image of 15-350 keV band
Time interval of the image:
-231.883400 -0.208000

# RAcent  DECcent POSerr Theta    Phi  PeakCts   SNR AngSep     Name
#  [deg]    [deg]    ['] [deg]  [deg]                   [']
 83.6247  22.0089    0.2  20.1  136.0  10.3263  57.6    0.6	Crab
 69.7178  25.1870    2.9  32.8  128.6   1.0318   4.0 ------	UNKNOWN
 70.6857  30.2160    2.8  34.2  137.4   1.1834   4.1 ------	UNKNOWN
141.0136 -14.2045    4.3  47.0  -53.2   2.5589   2.7 ------	UNKNOWN
141.2757  -2.6946    3.1  42.7  -68.3   3.5956   3.7 ------	UNKNOWN
141.9880  23.4587    2.7  42.0 -107.5   3.9994   4.2 ------	UNKNOWN
Pre-slew background subtracted image of 15-350 keV band
Time interval of the image:
-0.208000 39.584000

# RAcent  DECcent POSerr Theta    Phi  PeakCts   SNR AngSep     Name
#  [deg]    [deg]    ['] [deg]  [deg]                   [']
 83.5361  21.8439    9.6  20.0  135.5  -0.0773  -1.2   11.6	Crab
 87.7549  -2.6458    1.0  17.6   52.2   0.7553  11.1 ------	UNKNOWN
Post-slew image of 15-350 keV band
Time interval of the image:
90.316600 302.096000

# RAcent  DECcent POSerr Theta    Phi  PeakCts   SNR AngSep     Name
#  [deg]    [deg]    ['] [deg]  [deg]                   [']
 83.6319  22.0149    0.2  25.0 -176.8   9.0308  59.9    0.1	Crab
135.5474 -40.7317    8.3  57.4  -29.5   1.9727   1.4   10.7	Vela X-1
 87.6867 -42.2953    2.7  39.6   12.3   1.0112   4.3 ------	UNKNOWN
 92.4483 -35.6566    2.5  33.3    5.3   0.8784   4.6 ------	UNKNOWN
 94.0450 -17.0506    2.9  15.6  -10.6   0.6208   3.9 ------	UNKNOWN
 92.6220  44.7390    2.3  47.6 -163.0   1.6110   5.0 ------	UNKNOWN
132.0465 -16.9124    2.4  45.8  -56.6   3.7385   4.8 ------	UNKNOWN
128.8832  -0.6127    2.3  41.2  -79.9   3.3387   4.9 ------	UNKNOWN