Analysis Summary
Notes:
- 1) No attempt has been made to eliminate the non-significant decimal places.
- 2) This batgrbproduct analysis is done using the HEASARC data.
- 3) This batgrbproduct analysis is using the flight position for the mask-weighting calculation.
======================================================================
BAT GRB EVENT DATA PROCESSING REPORT
Process Script Ver: batgrbproduct v2.46
Process Start Time: Wed Jan 22 20:27:49 EST 2014
Host Name: batevent1
Current Working Dir: /local/data/batevent/batevent_reproc/trigger153514
======================================================================
Trigger: 00153514 Segment: 000
BAT Trigger Time: 147491504 [s; MET]
Trigger Stop: 147491568 [s; MET]
UTC: 2005-09-04T01:51:44.290000 [includes UTCF correction]
Where From?: TDRSS position message
BAT
RA: 13.67015365989 Dec: 14.1381730057214 [deg; J2000]
Catalogged Source?: NO
Point Source?: YES
GRB Indicated?: YES [ by BAT flight software ]
Image S/N Ratio: 13.26
Image Trigger?: YES
Rate S/N Ratio: 0 [ if not an image trigger ]
Image S/N Ratio: 13.26
Analysis Position: [ source = BAT ]
RA: 13.67015365989 Dec: 14.1381730057214 [deg; J2000]
Refined Position: [ source = BAT pre-slew burst ]
RA: 13.7157652137441 Dec: 14.075392814314 [deg; J2000]
{ 00h 54m 51.8s , +14d 04' 31.4" }
+/- 1.33850511717752 [arcmin] (estimated 90% radius based on SNR)
+/- 0.539188828709435 [arcmin] (formal 1-sigma fit error)
SNR: 20.0554593947411
Angular difference between the analysis and refined position is 4.607977 arcmin
Partial Coding Fraction: 0.5703125 [ including projection effects ]
Duration
T90: 181.576000005007 +/- 16.3062554673326
Measured from: 15.2120000123978
to: 196.788000017405 [s; relative to TRIGTIME]
T50: 88.027999997139 +/- 10.9211036186879
Measured from: 60.9399999976158
to: 148.967999994755 [s; relative to TRIGTIME]
Fluence
Peak Flux (peak 1 second)
Measured from: 27.4399999976158
to: 28.4399999976158 [s; relative to TRIGTIME]
Total Fluence
Measured from: -13.5160000026226
to: 216.956000000238 [s; relative to TRIGTIME]
Band 1 Band 2 Band 3 Band 4
15-25 25-50 50-100 100-350 keV
Total 1.788991 2.640542 2.517093 0.859196
0.085057 0.089311 0.080507 0.072677 [error]
Peak 0.014648 0.029444 0.027253 0.012689
0.006622 0.006960 0.006522 0.005894 [error]
[ fluence units of on-axis counts / fully illuminated detector ]
======================================================================
====== Table of the duration information =============================
Value tstart tstop
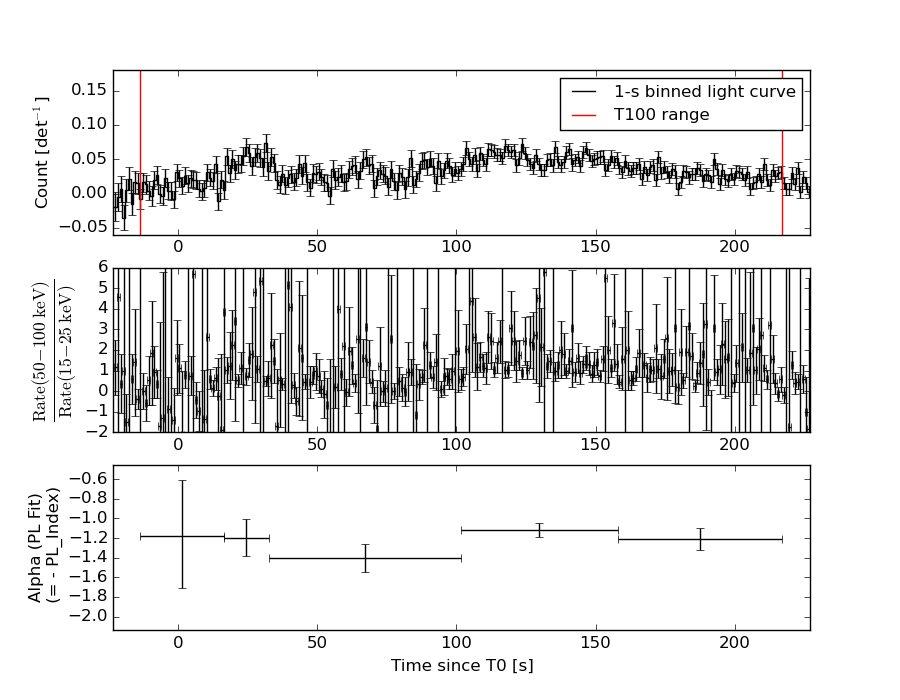
T100 230.472 -13.516 216.956
T90 181.576 15.212 196.788
T50 88.028 60.940 148.968
Peak 1.000 27.440 28.440
====== Spectral Analysis Summary =====================================
Model : spectral model: simple power-law (PL) and cutoff power-law (CPL)
Ph_index : photon index: E^{Ph_index}
Ph_90err : 90% error of the photon index
Epeak : Epeak in keV
Epeak_90err: 90% error of Epeak
Norm : normalization at 50 keV in both the PL model and CPL model
Nomr_90err : 90% error of the normalization
chi2 : Chi-Squared
dof : degree of freedo
=== Time-averaged spectral analysis ===
(Best model with acceptable fit: PL)
Model Ph_index Ph_90err_low Ph_90err_hi Epeak Epeak_90err_low Epeak_90err_hi Norm Nomr_90err_low Norm_90err_hi chi2 dof
PL -1.233 -0.066 0.066 - - - 2.25e-03 -7.98e-05 7.98e-05 55.310 57
CPL -1.134 -0.129 0.251 484.894 -484.894 -484.894 2.49e-03 -4.12e-04 7.29e-04 54.810 56
=== 1-s peak spectral analysis ===
(Best model with acceptable fit: PL)
Model Ph_index Ph_90err_low Ph_90err_hi Epeak Epeak_90err_low Epeak_90err_hi Norm Nomr_90err_low Norm_90err_hi chi2 dof
PL -1.239 -0.428 0.446 - - - 5.36e-03 -1.38e-03 1.38e-03 50.550 57
CPL 0.326 -2.568 4.567 71.903 -19.664 -71.903 3.41e-02 -3.41e-02 6.55e+00 49.310 56
=== Fluence/Peak Flux Summary ===
Model Band1 Band2 Band3 Band4 Band5 Total
15-25 25-50 50-100 100-350 15-150 15-350 keV
Fluence PL 5.15e-07 1.12e-06 1.90e-06 7.43e-06 5.21e-06 1.10e-05 erg/cm2
90%_error_low -3.73e-08 -4.76e-08 -7.93e-08 -6.99e-07 -2.00e-07 -7.42e-07 erg/cm2
90%_error_hi 3.83e-08 4.73e-08 7.91e-08 7.51e-07 2.01e-07 7.86e-07 erg/cm2
Peak flux PL 1.72e-01 2.02e-01 1.71e-01 2.46e-01 6.33e-01 7.91e-01 ph/cm2/s
90%_error_low -7.50e-02 -6.06e-02 -5.14e-02 -1.23e-01 -1.67e-01 -2.10e-01 ph/cm2/s
90%_error_hi 8.64e-02 5.91e-02 5.06e-02 1.85e-01 1.68e-01 2.18e-01 ph/cm2/s
Fluence CPL 5.03e-07 1.12e-06 1.92e-06 6.45e-06 5.17e-06 9.99e-06 erg/cm2
90%_error_low -4.64e-08 -4.43e-08 -8.88e-08 -1.84e-06 -2.17e-07 -1.83e-06 erg/cm2
90%_error_hi 4.01e-08 5.14e-08 8.97e-08 1.15e-06 2.11e-07 1.21e-06 erg/cm2
Peak flux CPL 1.32e-01 2.33e-01 1.85e-01 5.64e-02 5.93e-01 6.06e-01 ph/cm2/s
90%_error_low -9.11e-02 -7.67e-02 -7.01e-02 -5.64e-02 -1.82e-01 -1.94e-01 ph/cm2/s
90%_error_hi 1.04e-01 8.58e-02 6.34e-02 2.44e-01 1.80e-01 3.05e-01 ph/cm2/s
======================================================================
Image
Pre-slew 15.0-350.0 keV image (Event data)
#   RAcent    DECcent   POSerr    Theta     Phi              Peak Cts       SNR   Name
   13.7158    14.0754   0.0096    35.0872    13.4001         2.5233754     20.055 TRIG_00153514

Foreground time interval of the image:
 -2.099  74.301 (delta_t =  76.400 [sec])
Background time interval of the image:
Light Curves
Note: The mask-weighted lightcurves have units of either count/det or counts/sec/det, where a det is 0.4 x 0.4 = 0.16 sq cm.
Full-time range; 1 s binning
Other quick-look light curves:
- 64 ms binning (zoomed)
- 16 ms binning (zoomed)
- 8 ms binning (zoomed)
- 2 ms binning (zoomed)
- SN=5 or 10 s binning (full-time range)
- Raw light curve
Spectra
- 64 ms binning (zoomed)
- 16 ms binning (zoomed)
- 8 ms binning (zoomed)
- 2 ms binning (zoomed)
- SN=5 or 10 s binning (full-time range)
- Raw light curve
Spectra
Notes:
- 1) The fitting includes the systematic errors.
- 2) When the burst includes telescope slew time periods, the fitting uses an average response file made from multiple 5-s response files through out the slew time plus single time preiod for the non-slew times, and weighted by the total counts in the corresponding time period using addrmf. An average response file is needed becuase a spectral fit using the pre-slew DRM will introduce some errors in both a spectral shape and a normalization if the PHA file contains a lot of the slew/post-slew time interval.
- 3) For fits to more complicated models (e.g. a power-law over a cutoff power-law), the BAT team has decided to require a chi-square improvement of more than 6 for each extra dof.
Time averaged spectrum fit using the average DRM
Power-law model
Time interval is from  -13.516 sec. to  216.956 sec.

Spectral model in power-law:
------------------------------------------------------------
Parameters  : value       lower 90%   higher 90%
Photon index: -1.23274     ( -0.0657686   0.0662291 )
Norm@50keV  : 2.24719E-03    ( -7.9824e-05   7.97929e-05 )
------------------------------------------------------------
#Fit statistic : Chi-Squared =          55.31 using 59 PHA bins.
# Reduced chi-squared =         0.9703 for     57 degrees of freedom
# Null hypothesis probability =   5.388897e-01

Photon flux (15-150 keV)    in 230.5 sec: 0.265056 ( -0.009987  0.010007 ) ph/cm2/s
Energy fluence (15-150 keV)             : 5.20835e-06 ( -1.99933e-07  2.0057e-07 ) ergs/cm2
Cutoff power-law model

Time interval is from  -13.516 sec. to  216.956 sec.
Spectral model in the cutoff power-law:
------------------------------------------------------------
Parameters  : value       lower 90%   higher 90%
Photon index: -1.13378     ( -0.128839   0.251087 )
Epeak [keV] : 484.894      ( -485.207 -485.207 )
Norm@50keV  : 2.49465E-03    ( -0.000411368   0.000728789 )
------------------------------------------------------------
#Fit statistic : Chi-Squared =          54.81 using 59 PHA bins.
# Reduced chi-squared =         0.9788 for     56 degrees of freedom
# Null hypothesis probability =   5.199533e-01

Photon flux (15-150 keV)    in 230.5 sec: 0.263525 ( -0.010622  0.00516 ) ph/cm2/s
Energy fluence (15-150 keV)             : 5.17429e-06 ( -2.17036e-07  2.11398e-07 ) ergs/cm2
1-s peak spectrum fit
Power-law model
Time interval is from   27.440 sec. to   28.440 sec.

Spectral model in power-law:
------------------------------------------------------------
Parameters  : value       lower 90%   higher 90%
Photon index: -1.23922     ( -0.428356   0.445951 )
Norm@50keV  : 5.36306E-03    ( -0.00138334   0.00138204 )
------------------------------------------------------------
#Fit statistic : Chi-Squared =          50.55 using 59 PHA bins.
# Reduced chi-squared =         0.8868 for     57 degrees of freedom
# Null hypothesis probability =   7.141369e-01

Photon flux (15-150 keV)    in 1 sec: 0.633220 ( -0.166987  0.167879 ) ph/cm2/s
Energy fluence (15-150 keV)             : 5.38319e-08 ( -1.51026e-08  1.54405e-08 ) ergs/cm2
Cutoff power-law model
Time interval is from   27.440 sec. to   28.440 sec.
Spectral model in the cutoff power-law:
------------------------------------------------------------
Parameters  : value       lower 90%   higher 90%
Photon index: 0.325896     ( -2.56964   4.56558 )
Epeak [keV] : 71.9028      ( -19.6196 -71.8588 )
Norm@50keV  : 3.40860E-02    ( -0.0341984   6.5535 )
------------------------------------------------------------
#Fit statistic : Chi-Squared =          49.31 using 59 PHA bins.
# Reduced chi-squared =         0.8806 for     56 degrees of freedom
# Null hypothesis probability =   7.241283e-01

Photon flux (15-150 keV)    in 1 sec: 0.593446 ( -0.181858  0.180244 ) ph/cm2/s
Energy fluence (15-150 keV)             : 4.66573e-08 ( -1.69946e-08  1.89995e-08 ) ergs/cm2
Time-resolved spectra
Distribution
T90 vs. Hardness ratio plot
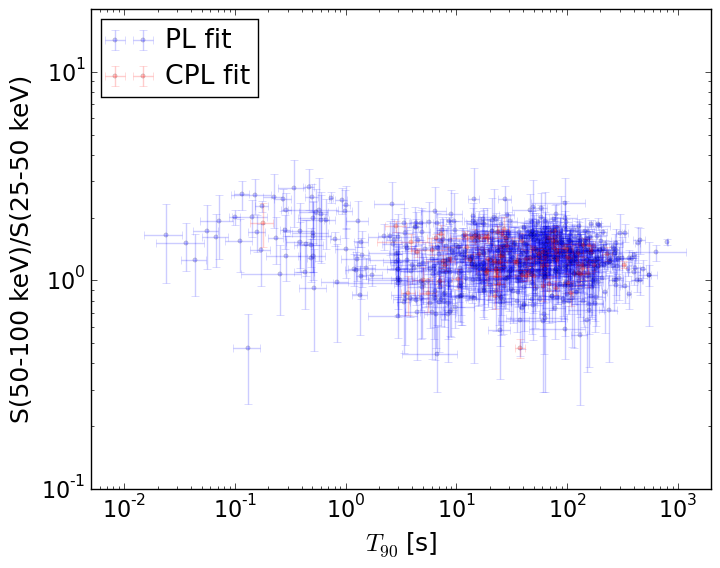
T90                                   = N/A sec.
Hardness ratio (energy fluence ratio) = N/A
S(15-50 keV) vs. S(50-150 keV) plot
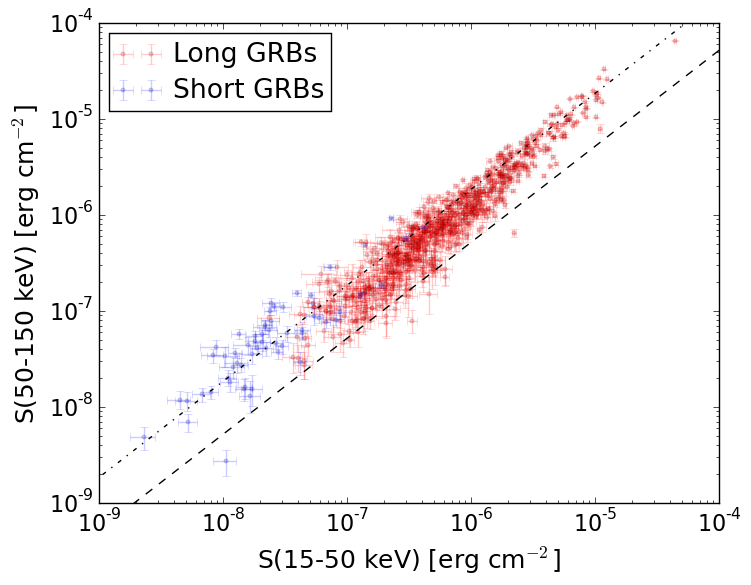
S(15-50 keV)  = N/A
S(50-150 keV) = N/A
The dash-dotted line and the dashed line traces the fluences calculated from the Band function with Epeak = 15 and 150 keV, respectively. Both lines assume a canonical values of alpha = -1 and beta = -2.5.
Mask shadow pattern
IMX = 6.833533355773687E-01, IMY = -1.627988033229366E-01
Spacecraft aspect plot
Bright source in the pre-burst/pre-slew/post-slew images
Pre-burst image of 15-350 keV band
Time interval of the image:
Pre-slew background subtracted image of 15-350 keV band
Time interval of the image:
-2.099400 74.300600

# RAcent  DECcent POSerr Theta    Phi  PeakCts   SNR AngSep     Name
#  [deg]    [deg]    ['] [deg]  [deg]                   [']
288.7955  10.8728    2.8  47.6 -172.9   0.6872   4.2    4.4	GRS 1915+105
299.5854  35.2000    0.7  36.8 -136.7   2.3163  17.4    0.3	Cyg X-1
308.2152  40.9710    2.9  32.8 -122.7   0.5350   4.0    4.9	Cyg X-3
326.3915  38.2172    0.0  21.0 -104.7   0.2653   2.5   12.1	Cyg X-2
 13.7161  14.0749    0.6  35.1   13.4   2.5524  20.3 ------	UNKNOWN
 36.4604  15.8808    2.6  56.1    3.8   2.0484   4.4 ------	UNKNOWN
 37.8899  45.0399    3.4  55.6  -31.7   1.5633   3.4 ------	UNKNOWN
Post-slew image of 15-350 keV band
Time interval of the image:
148.500600 303.075500

# RAcent  DECcent POSerr Theta    Phi  PeakCts   SNR AngSep     Name
#  [deg]    [deg]    ['] [deg]  [deg]                   [']
326.2902  38.1973    3.4  48.2  162.3   1.1709   3.4    9.3	Cyg X-2
 13.7231  14.0769    0.4   0.1  -52.5   3.2787  26.0 ------	UNKNOWN
343.8673  63.9474    2.4  54.0 -162.5   1.6834   4.8 ------	UNKNOWN
 61.8225   4.4621    3.2  48.4  -50.2   2.2575   3.6 ------	UNKNOWN
 38.2510  59.0498    2.7  48.5 -130.2   2.5322   4.3 ------	UNKNOWN