Analysis Summary
Notes:
- 1) No attempt has been made to eliminate the non-significant decimal places.
- 2) This batgrbproduct analysis is done using the HEASARC data.
- 3) This batgrbproduct analysis is using the flight position for the mask-weighting calculation.
======================================================================
BAT GRB EVENT DATA PROCESSING REPORT
Process Script Ver: batgrbproduct v2.46
Process Start Time: Wed Jan 22 20:22:50 EST 2014
Host Name: batevent1
Current Working Dir: /local/data/batevent/batevent_reproc/trigger154112
======================================================================
Trigger: 00154112 Segment: 000
BAT Trigger Time: 147850951.104 [s; MET]
Trigger Stop: 147850953.152 [s; MET]
UTC: 2005-09-08T05:42:31.386740 [includes UTCF correction]
Where From?: TDRSS position message
BAT
RA: 20.4636377922441 Dec: -12.9713413289566 [deg; J2000]
Catalogged Source?: NO
Point Source?: YES
GRB Indicated?: YES [ by BAT flight software ]
Image S/N Ratio: 9.29
Image Trigger?: NO
Rate S/N Ratio: 9.38083151964686 [ if not an image trigger ]
Image S/N Ratio: 9.29
Analysis Position: [ source = BAT ]
RA: 20.4636377922441 Dec: -12.9713413289566 [deg; J2000]
Refined Position: [ source = BAT pre-slew burst ]
RA: 20.4669194304627 Dec: -12.9538449663945 [deg; J2000]
{ 01h 21m 52.1s , -12d 57' 13.8" }
+/- 1.4886888869372 [arcmin] (estimated 90% radius based on SNR)
+/- 0.569753991333922 [arcmin] (formal 1-sigma fit error)
SNR: 17.2288226091153
Angular difference between the analysis and refined position is 1.067174 arcmin
Partial Coding Fraction: 0.734375 [ including projection effects ]
Duration
T90: 18.2840000092983 +/- 3.28171966294318
Measured from: -4.89599999785423
to: 13.3880000114441 [s; relative to TRIGTIME]
T50: 6.72000002861023 +/- 1.67973448236579
Measured from: -0.0480000078678131
to: 6.67200002074242 [s; relative to TRIGTIME]
Fluence
Peak Flux (peak 1 second)
Measured from: 1.65599998831749
to: 2.65599998831749 [s; relative to TRIGTIME]
Total Fluence
Measured from: -6.81600001454353
to: 15.8400000035763 [s; relative to TRIGTIME]
Band 1 Band 2 Band 3 Band 4
15-25 25-50 50-100 100-350 keV
Total 0.280288 0.350097 0.194908 0.024949
0.025284 0.026392 0.022774 0.019103 [error]
Peak 0.017687 0.038734 0.021445 0.007373
0.005449 0.005799 0.004935 0.004016 [error]
[ fluence units of on-axis counts / fully illuminated detector ]
======================================================================
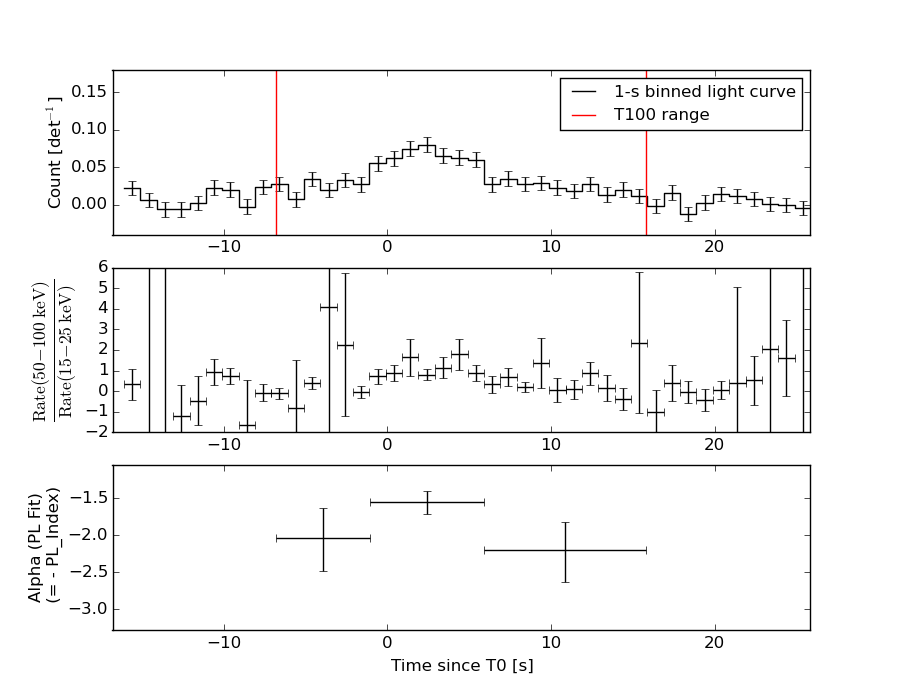
====== Table of the duration information =============================
Value tstart tstop
T100 22.656 -6.816 15.840
T90 18.284 -4.896 13.388
T50 6.720 -0.048 6.672
Peak 1.000 1.656 2.656
====== Spectral Analysis Summary =====================================
Model : spectral model: simple power-law (PL) and cutoff power-law (CPL)
Ph_index : photon index: E^{Ph_index}
Ph_90err : 90% error of the photon index
Epeak : Epeak in keV
Epeak_90err: 90% error of Epeak
Norm : normalization at 50 keV in both the PL model and CPL model
Nomr_90err : 90% error of the normalization
chi2 : Chi-Squared
dof : degree of freedo
=== Time-averaged spectral analysis ===
(Best model with acceptable fit: PL)
Model Ph_index Ph_90err_low Ph_90err_hi Epeak Epeak_90err_low Epeak_90err_hi Norm Nomr_90err_low Norm_90err_hi chi2 dof
PL -1.833 -0.160 0.154 - - - 2.32e-03 -2.42e-04 2.38e-04 54.750 57
CPL -0.937 -0.688 0.825 50.461 -9.614 31.311 7.52e-03 -4.42e-03 1.48e-02 49.600 56
=== 1-s peak spectral analysis ===
(Best model with acceptable fit: PL)
Model Ph_index Ph_90err_low Ph_90err_hi Epeak Epeak_90err_low Epeak_90err_hi Norm Nomr_90err_low Norm_90err_hi chi2 dof
PL -1.485 -0.316 0.311 - - - 5.61e-03 -1.11e-03 1.09e-03 54.360 57
CPL -0.229 -1.364 2.077 67.921 -16.252 -67.921 2.52e-02 -2.52e-02 2.60e-01 52.110 56
=== Fluence/Peak Flux Summary ===
Model Band1 Band2 Band3 Band4 Band5 Total
15-25 25-50 50-100 100-350 15-150 15-350 keV
Fluence PL 9.17e-08 1.38e-07 1.55e-07 3.29e-07 4.83e-07 7.13e-07 erg/cm2
90%_error_low -1.17e-08 -1.22e-08 -2.15e-08 -8.34e-08 -5.03e-08 -1.08e-07 erg/cm2
90%_error_hi 1.20e-08 1.22e-08 2.18e-08 1.00e-07 5.12e-08 1.21e-07 erg/cm2
Peak flux PL 2.27e-01 2.31e-01 1.65e-01 1.88e-01 6.97e-01 8.12e-01 ph/cm2/s
90%_error_low -6.78e-02 -4.65e-02 -4.00e-02 -7.72e-02 -1.34e-01 -1.57e-01 ph/cm2/s
90%_error_hi 7.32e-02 4.60e-02 3.97e-02 1.04e-01 1.34e-01 1.59e-01 ph/cm2/s
Fluence CPL 8.45e-08 1.53e-07 1.50e-07 8.36e-08 4.42e-07 4.72e-07 erg/cm2
90%_error_low -1.33e-08 -1.69e-08 -2.67e-08 -5.26e-08 -5.59e-08 -7.77e-08 erg/cm2
90%_error_hi 1.33e-08 1.75e-08 2.51e-08 1.43e-07 5.88e-08 1.50e-07 erg/cm2
Peak flux CPL 1.86e-01 2.61e-01 1.78e-01 5.68e-02 6.67e-01 6.81e-01 ph/cm2/s
90%_error_low -8.25e-02 -5.86e-02 -4.74e-02 -5.68e-02 -1.40e-01 -1.50e-01 ph/cm2/s
90%_error_hi 8.69e-02 6.30e-02 4.79e-02 1.64e-01 1.39e-01 1.96e-01 ph/cm2/s
======================================================================
Image
Pre-slew 15.0-350.0 keV image (Event data)
#   RAcent    DECcent   POSerr    Theta     Phi              Peak Cts       SNR   Name
   20.4669   -12.9538   0.0111    27.7905    20.7818         0.8745436     17.229 TRIG_00154112

Foreground time interval of the image:
 -6.816  15.840 (delta_t =  22.656 [sec])
Background time interval of the image:
-299.104  -6.816 (delta_t = 292.288 [sec])
Light Curves
Note: The mask-weighted lightcurves have units of either count/det or counts/sec/det, where a det is 0.4 x 0.4 = 0.16 sq cm.
Full-time range; 1 s binning
Other quick-look light curves:
- 64 ms binning (zoomed)
- 16 ms binning (zoomed)
- 8 ms binning (zoomed)
- 2 ms binning (zoomed)
- SN=5 or 10 s binning (full-time range)
- Raw light curve
Spectra
- 64 ms binning (zoomed)
- 16 ms binning (zoomed)
- 8 ms binning (zoomed)
- 2 ms binning (zoomed)
- SN=5 or 10 s binning (full-time range)
- Raw light curve
Spectra
Notes:
- 1) The fitting includes the systematic errors.
- 2) When the burst includes telescope slew time periods, the fitting uses an average response file made from multiple 5-s response files through out the slew time plus single time preiod for the non-slew times, and weighted by the total counts in the corresponding time period using addrmf. An average response file is needed becuase a spectral fit using the pre-slew DRM will introduce some errors in both a spectral shape and a normalization if the PHA file contains a lot of the slew/post-slew time interval.
- 3) For fits to more complicated models (e.g. a power-law over a cutoff power-law), the BAT team has decided to require a chi-square improvement of more than 6 for each extra dof.
Time averaged spectrum fit using the average DRM
Power-law model
Time interval is from   -6.816 sec. to   15.840 sec.

Spectral model in power-law:
------------------------------------------------------------
Parameters  : value       lower 90%   higher 90%
Photon index: -1.83264     ( -0.159634   0.154318 )
Norm@50keV  : 2.31804E-03    ( -0.000241785   0.000238221 )
------------------------------------------------------------
#Fit statistic : Chi-Squared =          54.75 using 59 PHA bins.
# Reduced chi-squared =         0.9606 for     57 degrees of freedom
# Null hypothesis probability =   5.598560e-01

Photon flux (15-150 keV)    in 22.66 sec: 0.323571 ( -0.028785  0.028794 ) ph/cm2/s
Energy fluence (15-150 keV)             : 4.83193e-07 ( -5.03503e-08  5.11869e-08 ) ergs/cm2
Cutoff power-law model
Time interval is from   -6.816 sec. to   15.840 sec.
Spectral model in the cutoff power-law:
------------------------------------------------------------
Parameters  : value       lower 90%   higher 90%
Photon index: -0.936578     ( -0.688293   0.825125 )
Epeak [keV] : 50.4613      ( -9.61362 31.3111 )
Norm@50keV  : 7.51677E-03    ( -0.00441913   0.0148388 )
------------------------------------------------------------
#Fit statistic : Chi-Squared =          49.60 using 59 PHA bins.
# Reduced chi-squared =         0.8856 for     56 degrees of freedom
# Null hypothesis probability =   7.143657e-01

Photon flux (15-150 keV)    in 22.66 sec: 0.313306 ( -0.029738  0.029777 ) ph/cm2/s
Energy fluence (15-150 keV)             : 4.4209e-07 ( -5.59364e-08  5.88204e-08 ) ergs/cm2
1-s peak spectrum fit
Power-law model
Time interval is from    1.656 sec. to    2.656 sec.

Spectral model in power-law:
------------------------------------------------------------
Parameters  : value       lower 90%   higher 90%
Photon index: -1.48468     ( -0.316317   0.310829 )
Norm@50keV  : 5.60849E-03    ( -0.0011051   0.00109457 )
------------------------------------------------------------
#Fit statistic : Chi-Squared =          54.36 using 59 PHA bins.
# Reduced chi-squared =         0.9537 for     57 degrees of freedom
# Null hypothesis probability =   5.746558e-01

Photon flux (15-150 keV)    in 1 sec: 0.697336 ( -0.133939  0.134172 ) ph/cm2/s
Energy fluence (15-150 keV)             : 5.3347e-08 ( -1.13479e-08  1.15523e-08 ) ergs/cm2
Cutoff power-law model

Time interval is from    1.656 sec. to    2.656 sec.
Spectral model in the cutoff power-law:
------------------------------------------------------------
Parameters  : value       lower 90%   higher 90%
Photon index: -0.228703     ( -1.36428   2.0766 )
Epeak [keV] : 67.9212      ( -16.2523 -67.9211 )
Norm@50keV  : 2.51795E-02    ( -0.0251796   0.26041 )
------------------------------------------------------------
#Fit statistic : Chi-Squared =          52.11 using 59 PHA bins.
# Reduced chi-squared =         0.9305 for     56 degrees of freedom
# Null hypothesis probability =   6.229793e-01

Photon flux (15-150 keV)    in 1 sec: 0.667220 ( -0.139545  0.139234 ) ph/cm2/s
Energy fluence (15-150 keV)             : 4.8671e-08 ( -1.21897e-08  1.27264e-08 ) ergs/cm2
Time-resolved spectra
Distribution
T90 vs. Hardness ratio plot

T90                                   = 18.284 sec.
Hardness ratio (energy fluence ratio) = 1.12305186222
S(15-50 keV) vs. S(50-150 keV) plot
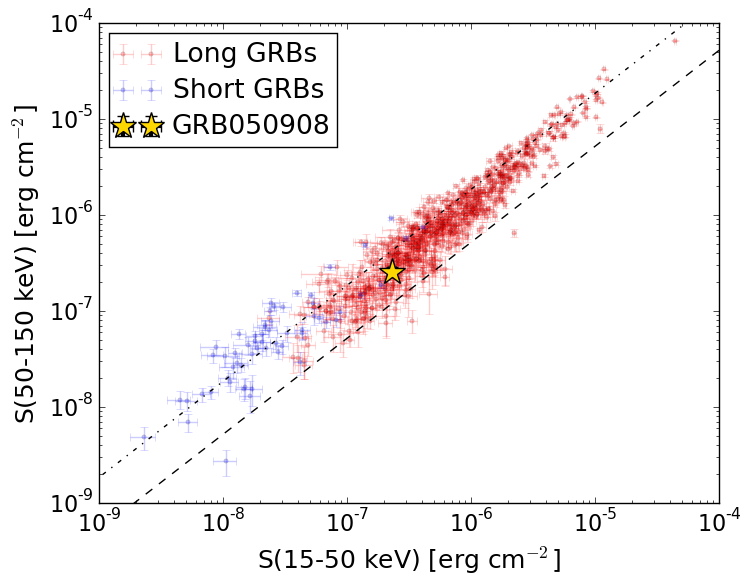
S(15-50 keV)  = 2.2943162e-07
S(50-150 keV) = 2.5377039e-07
The dash-dotted line and the dashed line traces the fluences calculated from the Band function with Epeak = 15 and 150 keV, respectively. Both lines assume a canonical values of alpha = -1 and beta = -2.5.
Mask shadow pattern
IMX = 4.927397904715308E-01, IMY = -1.869951146872751E-01
Spacecraft aspect plot
Bright source in the pre-burst/pre-slew/post-slew images
Pre-burst image of 15-350 keV band
Time interval of the image:
-299.104000 -6.816000

# RAcent  DECcent POSerr Theta    Phi  PeakCts   SNR AngSep     Name
#  [deg]    [deg]    ['] [deg]  [deg]                   [']
326.0351  38.2796   66.1  48.5  164.2   0.0837   0.2    6.9	Cyg X-2
345.5004  -6.6037    2.7  34.8   90.4   1.7864   4.3 ------	UNKNOWN
 14.7479 -32.7721    2.3  46.8   33.8   2.8199   5.2 ------	UNKNOWN
 36.2750 -34.2349    2.9  52.8   11.5   2.6042   4.0 ------	UNKNOWN
324.3529  50.9774    3.4  54.1  178.9   2.1064   3.4 ------	UNKNOWN
Pre-slew background subtracted image of 15-350 keV band
Time interval of the image:
-6.816000 15.840000

# RAcent  DECcent POSerr Theta    Phi  PeakCts   SNR AngSep     Name
#  [deg]    [deg]    ['] [deg]  [deg]                   [']
326.2186  38.4265    6.7  48.4  164.4   0.2029   1.7    6.7	Cyg X-2
346.9470 -14.9725    2.4  39.3   78.4   0.7820   4.7 ------	UNKNOWN
 25.0290 -36.2399    2.9  51.4   23.3   0.7993   4.0 ------	UNKNOWN
340.2874  27.9765    2.5  34.0  154.6   0.2820   4.7 ------	UNKNOWN
 20.4669 -12.9538    0.7  27.8   20.8   0.8745  17.2 ------	UNKNOWN
 60.7091 -20.0012    3.1  57.4  -19.7   0.7463   3.7 ------	UNKNOWN
Post-slew image of 15-350 keV band
Time interval of the image:
88.996600 127.091700
127.896000 302.966000

# RAcent  DECcent POSerr Theta    Phi  PeakCts   SNR AngSep     Name
#  [deg]    [deg]    ['] [deg]  [deg]                   [']
359.7649   8.0873    2.5  29.5  125.4   0.9363   4.7  485.4	UNKNOWN
 52.8823  37.1839    3.5  58.7 -159.3   3.5145   3.3 ------	UNKNOWN
 62.3643  -7.1556    2.6  41.6 -103.1   2.9247   4.5 ------	UNKNOWN