Analysis Summary
Notes:
- 1) No attempt has been made to eliminate the non-significant decimal places.
- 2) This batgrbproduct analysis is done using the HEASARC data.
- 3) This batgrbproduct analysis is using the flight position for the mask-weighting calculation.
======================================================================
BAT GRB EVENT DATA PROCESSING REPORT
Process Script Ver: batgrbproduct v2.46
Process Start Time: Wed Jan 22 20:20:30 EST 2014
Host Name: batevent1
Current Working Dir: /local/data/batevent/batevent_reproc/trigger154630
======================================================================
Trigger: 00154630 Segment: 000
BAT Trigger Time: 148147173.568 [s; MET]
Trigger Stop: 148147174.08 [s; MET]
UTC: 2005-09-11T15:59:33.844660 [includes UTCF correction]
Where From?: TDRSS position message
BAT
RA: 13.6918901114025 Dec: -38.8605504101289 [deg; J2000]
Catalogged Source?: NO
Point Source?: YES
GRB Indicated?: YES [ by BAT flight software ]
Image S/N Ratio: 8.81
Image Trigger?: NO
Rate S/N Ratio: 18.8414436814168 [ if not an image trigger ]
Image S/N Ratio: 8.81
Analysis Position: [ source = BAT ]
RA: 13.6918901114025 Dec: -38.8605504101289 [deg; J2000]
Refined Position: [ source = BAT pre-slew burst ]
RA: 13.714430047257 Dec: -38.860997938466 [deg; J2000]
{ 00h 54m 51.5s , -38d 51' 39.6" }
+/- 2.362665357153 [arcmin] (estimated 90% radius based on SNR)
+/- 1.13727142198295 [arcmin] (formal 1-sigma fit error)
SNR: 8.90608111901844
Angular difference between the analysis and refined position is 1.053416 arcmin
Partial Coding Fraction: 0.4296875 [ including projection effects ]
Duration
T90: 16.2399999797344 +/- 0.879317904925426
Measured from: -0.751999974250793
to: 15.4880000054836 [s; relative to TRIGTIME]
T50: 13.5280000269413 +/- 1.31090807331145
Measured from: 0.19200000166893
to: 13.7200000286102 [s; relative to TRIGTIME]
Fluence
Peak Flux (peak 1 second)
Measured from: -0.104000002145767
to: 0.895999997854233 [s; relative to TRIGTIME]
Total Fluence
Measured from: -0.995999991893768
to: 15.9680000245571 [s; relative to TRIGTIME]
Band 1 Band 2 Band 3 Band 4
15-25 25-50 50-100 100-350 keV
Total 0.197509 0.222558 0.128693 0.008347
0.028476 0.029615 0.025997 0.023139 [error]
Peak 0.059070 0.053135 0.043180 0.010248
0.008055 0.008053 0.007219 0.005863 [error]
[ fluence units of on-axis counts / fully illuminated detector ]
======================================================================
====== Table of the duration information =============================
Value tstart tstop
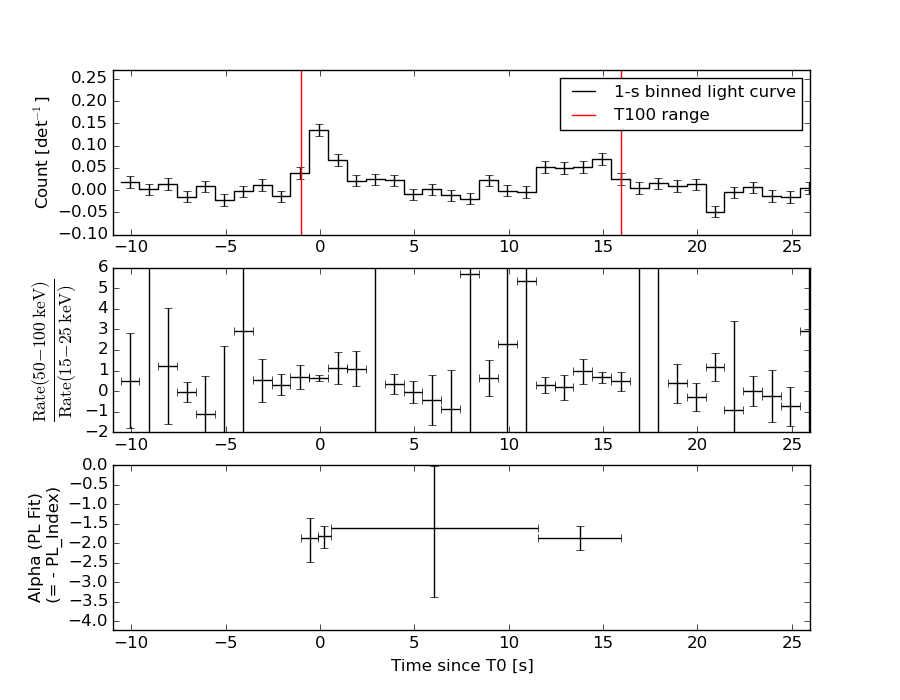
T100 16.964 -0.996 15.968
T90 16.240 -0.752 15.488
T50 13.528 0.192 13.720
Peak 1.000 -0.104 0.896
====== Spectral Analysis Summary =====================================
Model : spectral model: simple power-law (PL) and cutoff power-law (CPL)
Ph_index : photon index: E^{Ph_index}
Ph_90err : 90% error of the photon index
Epeak : Epeak in keV
Epeak_90err: 90% error of Epeak
Norm : normalization at 50 keV in both the PL model and CPL model
Nomr_90err : 90% error of the normalization
chi2 : Chi-Squared
dof : degree of freedo
=== Time-averaged spectral analysis ===
(Best model with acceptable fit: PL)
Model Ph_index Ph_90err_low Ph_90err_hi Epeak Epeak_90err_low Epeak_90err_hi Norm Nomr_90err_low Norm_90err_hi chi2 dof
PL -1.816 -0.285 0.269 - - - 2.05e-03 -3.72e-04 3.60e-04 47.770 57
CPL -1.795 -0.965 1.142 409.289 N/A N/A 2.11e-03 N/A N/A 47.770 56
=== 1-s peak spectral analysis ===
(Best model with acceptable fit: PL)
Model Ph_index Ph_90err_low Ph_90err_hi Epeak Epeak_90err_low Epeak_90err_hi Norm Nomr_90err_low Norm_90err_hi chi2 dof
PL -1.824 -0.298 0.280 - - - 9.56e-03 -1.75e-03 1.68e-03 55.550 57
CPL -2.100 -0.048 1.018 41.889 N/A N/A 6.89e-03 N/A N/A 55.530 56
=== Fluence/Peak Flux Summary ===
Model Band1 Band2 Band3 Band4 Band5 Total
15-25 25-50 50-100 100-350 15-150 15-350 keV
Fluence PL 5.98e-08 9.07e-08 1.03e-07 2.23e-07 3.20e-07 4.77e-07 erg/cm2
90%_error_low -1.27e-08 -1.34e-08 -2.50e-08 -9.25e-08 -5.75e-08 -1.22e-07 erg/cm2
90%_error_hi 1.31e-08 1.34e-08 2.55e-08 1.29e-07 5.92e-08 1.51e-07 erg/cm2
Peak flux PL 5.37e-01 4.47e-01 2.52e-01 2.11e-01 1.33e+00 1.45e+00 ph/cm2/s
90%_error_low -1.20e-01 -6.60e-02 -6.05e-02 -8.52e-02 -1.97e-01 -2.18e-01 ph/cm2/s
90%_error_hi 1.25e-01 6.59e-02 6.09e-02 1.16e-01 1.97e-01 2.19e-01 ph/cm2/s
Fluence CPL 5.97e-08 9.09e-08 1.03e-07 2.13e-07 3.19e-07 4.67e-07 erg/cm2
90%_error_low -1.36e-08 -1.36e-08 -2.49e-08 -1.82e-07 -6.87e-08 -2.04e-07 erg/cm2
90%_error_hi 1.33e-08 1.79e-08 2.56e-08 8.20e-08 5.94e-08 9.25e-08 erg/cm2
Peak flux CPL 5.36e-01 4.06e-01 2.14e-01 1.94e-01 1.23e+00 1.34e+00 ph/cm2/s
90%_error_low -1.43e-01 -1.10e-01 -5.65e-02 -8.75e-02 -3.30e-01 -3.58e-01 ph/cm2/s
90%_error_hi 1.27e-01 9.10e-02 4.40e-02 2.85e-02 2.75e-01 2.87e-01 ph/cm2/s
======================================================================
Image
Pre-slew 15.0-350.0 keV image (Event data)
#   RAcent    DECcent   POSerr    Theta     Phi              Peak Cts       SNR   Name
   13.7144   -38.8610   0.0216    28.2734    74.5155         0.5021197      8.906 TRIG_00154630

Foreground time interval of the image:
 -0.996  15.968 (delta_t =  16.964 [sec])
Background time interval of the image:
-299.568  -0.996 (delta_t = 298.572 [sec])
Light Curves
Note: The mask-weighted lightcurves have units of either count/det or counts/sec/det, where a det is 0.4 x 0.4 = 0.16 sq cm.
Full-time range; 1 s binning
Other quick-look light curves:
- 64 ms binning (zoomed)
- 16 ms binning (zoomed)
- 8 ms binning (zoomed)
- 2 ms binning (zoomed)
- SN=5 or 10 s binning (full-time range)
- Raw light curve
Spectra
- 64 ms binning (zoomed)
- 16 ms binning (zoomed)
- 8 ms binning (zoomed)
- 2 ms binning (zoomed)
- SN=5 or 10 s binning (full-time range)
- Raw light curve
Spectra
Notes:
- 1) The fitting includes the systematic errors.
- 2) When the burst includes telescope slew time periods, the fitting uses an average response file made from multiple 5-s response files through out the slew time plus single time preiod for the non-slew times, and weighted by the total counts in the corresponding time period using addrmf. An average response file is needed becuase a spectral fit using the pre-slew DRM will introduce some errors in both a spectral shape and a normalization if the PHA file contains a lot of the slew/post-slew time interval.
- 3) For fits to more complicated models (e.g. a power-law over a cutoff power-law), the BAT team has decided to require a chi-square improvement of more than 6 for each extra dof.
Time averaged spectrum fit using the average DRM
Power-law model
Time interval is from   -0.996 sec. to   15.968 sec.

Spectral model in power-law:
------------------------------------------------------------
Parameters  : value       lower 90%   higher 90%
Photon index: -1.81614     ( -0.284863   0.268992 )
Norm@50keV  : 2.05135E-03    ( -0.000372144   0.000359976 )
------------------------------------------------------------
#Fit statistic : Chi-Squared =          47.77 using 59 PHA bins.
# Reduced chi-squared =         0.8381 for     57 degrees of freedom
# Null hypothesis probability =   8.031180e-01

Photon flux (15-150 keV)    in 16.96 sec: 0.284475 ( -0.041952  0.041958 ) ph/cm2/s
Energy fluence (15-150 keV)             : 3.20174e-07 ( -5.75253e-08  5.91807e-08 ) ergs/cm2
Cutoff power-law model

Time interval is from   -0.996 sec. to   15.968 sec.
Spectral model in the cutoff power-law:
------------------------------------------------------------
Parameters  : value       lower 90%   higher 90%
Photon index: -1.79495     ( -0.964653   1.14235 )
Epeak [keV] : 409.289      (   )
Norm@50keV  : 2.11024E-03    (     )
------------------------------------------------------------
#Fit statistic : Chi-Squared =          47.77 using 59 PHA bins.
# Reduced chi-squared =         0.8530 for     56 degrees of freedom
# Null hypothesis probability =   7.751071e-01

Photon flux (15-150 keV)    in 16.96 sec: 0.284263 ( -0.043136  0.042051 ) ph/cm2/s
Energy fluence (15-150 keV)             : 3.19364e-07 ( -6.87204e-08  5.93544e-08 ) ergs/cm2
1-s peak spectrum fit
Power-law model
Time interval is from   -0.104 sec. to    0.896 sec.

Spectral model in power-law:
------------------------------------------------------------
Parameters  : value       lower 90%   higher 90%
Photon index: -1.82404     ( -0.297508   0.280248 )
Norm@50keV  : 9.55824E-03    ( -0.00175029   0.00168187 )
------------------------------------------------------------
#Fit statistic : Chi-Squared =          55.55 using 59 PHA bins.
# Reduced chi-squared =         0.9746 for     57 degrees of freedom
# Null hypothesis probability =   5.295331e-01

Photon flux (15-150 keV)    in 1 sec: 1.32966 ( -0.19655  0.19662 ) ph/cm2/s
Energy fluence (15-150 keV)             : 8.79427e-08 ( -1.58618e-08  1.63034e-08 ) ergs/cm2
Cutoff power-law model
Time interval is from   -0.104 sec. to    0.896 sec.
Spectral model in the cutoff power-law:
------------------------------------------------------------
Parameters  : value       lower 90%   higher 90%
Photon index: -2.1003     ( -0.0480023   1.01754 )
Epeak [keV] : 41.8888      (   )
Norm@50keV  : 6.88769E-03    (     )
------------------------------------------------------------
#Fit statistic : Chi-Squared =          55.53 using 59 PHA bins.
# Reduced chi-squared =         0.9917 for     56 degrees of freedom
# Null hypothesis probability =   4.924559e-01

Photon flux (15-150 keV)    in 1 sec: 1.23198 ( -0.330273  0.27485 ) ph/cm2/s
Energy fluence (15-150 keV)             : 0 ( 0  0 ) ergs/cm2
Time-resolved spectra
Distribution
T90 vs. Hardness ratio plot
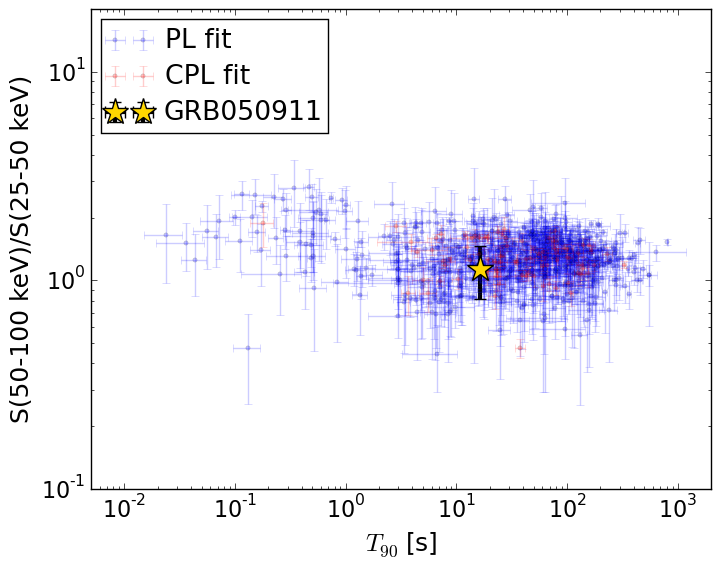
T90                                   = 16.24 sec.
Hardness ratio (energy fluence ratio) = 1.13595218529
S(15-50 keV) vs. S(50-150 keV) plot
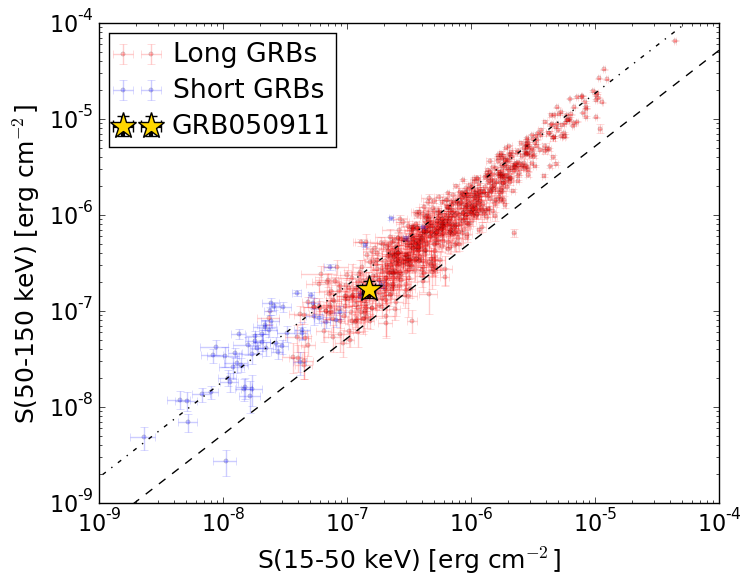
S(15-50 keV)  = 1.5051473e-07
S(50-150 keV) = 1.6966046e-07
The dash-dotted line and the dashed line traces the fluences calculated from the Band function with Epeak = 15 and 150 keV, respectively. Both lines assume a canonical values of alpha = -1 and beta = -2.5.
Mask shadow pattern
IMX = 1.435927784720583E-01, IMY = -5.183233407212076E-01
Spacecraft aspect plot
Bright source in the pre-burst/pre-slew/post-slew images
Pre-burst image of 15-350 keV band
Time interval of the image:
-299.568000 -0.996000

# RAcent  DECcent POSerr Theta    Phi  PeakCts   SNR AngSep     Name
#  [deg]    [deg]    ['] [deg]  [deg]                   [']
 21.4235 -19.9665    2.6  35.7  110.3   1.7990   4.5 ------	UNKNOWN
 63.7768  -4.1497    2.7  43.3 -178.2   1.2638   4.3 ------	UNKNOWN
205.1200 -82.5609    2.4  50.7  -20.9   1.8943   4.9 ------	UNKNOWN
109.7701 -51.5030    3.8  37.9  -76.5   1.4753   3.1 ------	UNKNOWN
Pre-slew background subtracted image of 15-350 keV band
Time interval of the image:
-0.996000 15.968000

# RAcent  DECcent POSerr Theta    Phi  PeakCts   SNR AngSep     Name
#  [deg]    [deg]    ['] [deg]  [deg]                   [']
 13.7144 -38.8610    1.3  28.3   74.5   0.5021   8.9 ------	UNKNOWN
 64.3792 -17.9195    3.1  30.2 -171.1   0.1542   3.8 ------	UNKNOWN
 81.2058  -2.8818    2.2  50.5 -156.3   0.4581   5.1 ------	UNKNOWN
Post-slew image of 15-350 keV band
Time interval of the image: