Analysis Summary
Notes:
- 1) No attempt has been made to eliminate the non-significant decimal places.
- 2) This batgrbproduct analysis is done using the HEASARC data.
- 3) This batgrbproduct analysis is using the flight position for the mask-weighting calculation.
======================================================================
                  BAT GRB EVENT DATA PROCESSING REPORT
    Process Script Ver: batgrbproduct v2.46
    Process Start Time: Wed Jan 22 20:17:11 EST 2014
             Host Name: batevent1
   Current Working Dir: /local/data/batevent/batevent_reproc/trigger155242
======================================================================

  Trigger: 00155242      Segment: 000

  BAT Trigger Time: 148476162.048   [s; MET]
      Trigger Stop: 148476163.072   [s; MET]
               UTC: 2005-09-15T11:22:42.317800    [includes UTCF correction]
       Where From?: TDRSS position message

  BAT
    RA: 81.7136478998272   Dec: -28.0303786003  [deg; J2000]

     Catalogged Source?: NO
     Point Source?:      YES
     GRB Indicated?:     YES    [ by BAT flight software ]
     Image S/N Ratio:    7.68
     Image Trigger?:     NO
     Rate S/N Ratio:     10.5356537528527  [ if not an image trigger ]
     Image S/N Ratio:    7.68

  Analysis Position:   [ source = BAT ]
    RA: 81.7136478998272   Dec: -28.0303786003  [deg; J2000]

  Refined Position:   [ source = BAT pre-slew burst ]
    RA: 81.6891634327391   Dec: -28.0115525658167  [deg; J2000]
        { 05h 26m 45.4s , -28d 00' 41.6" }
         +/- 1.42673255277249 [arcmin] (estimated 90% radius based on SNR)
         +/- 0.361543367953458 [arcmin] (formal 1-sigma fit error)
    SNR: 18.3074979327079

  Angular difference between the analysis and refined position is 1.719811 arcmin

  Partial Coding Fraction: 0.75    [ including projection effects ]

  Duration
     T90: 53.419999986887 +/- 11.2722436270025
        Measured from: -6.52799999713898
                   to: 46.891999989748     [s; relative to TRIGTIME]
     T50: 16.0360000133514 +/- 5.85311029616473
        Measured from: 0.507999986410141
                   to: 16.5439999997616     [s; relative to TRIGTIME]


  Fluence
     Peak Flux  (peak 1 second)
        Measured from: 13.6879999935627
                   to: 14.6879999935627     [s; relative to TRIGTIME]
     Total Fluence
        Measured from: -8.14000001549721
                   to: 57.83599999547     [s; relative to TRIGTIME]

             Band 1     Band 2     Band 3     Band 4
              15-25      25-50     50-100    100-350     keV
 Total     0.292475   0.489266   0.366794   0.105488
           0.040283   0.041696   0.036498   0.030920 [error]
 Peak      0.018783   0.031239   0.033510   0.022590
           0.005503   0.005879   0.005374   0.004308 [error]

     [ fluence units of on-axis counts / fully illuminated detector ]

======================================================================


====== Table of the duration information =============================

        Value   tstart    tstop
T100   65.976   -8.140   57.836
T90    53.420   -6.528   46.892
T50    16.036    0.508   16.544
Peak    1.000   13.688   14.688


====== Spectral Analysis Summary =====================================

Model      : spectral model: simple power-law (PL) and cutoff power-law (CPL)
Ph_index   : photon index: E^{Ph_index}
Ph_90err   : 90% error of the photon index
Epeak      : Epeak in keV
Epeak_90err: 90% error of Epeak
Norm       : normalization at 50 keV in both the PL model and CPL model
Nomr_90err : 90% error of the normalization
chi2       : Chi-Squared
dof        : degree of freedo

=== Time-averaged spectral analysis ===
(Best model with acceptable fit: N/A)

Model Ph_index Ph_90err_low Ph_90err_hi  Epeak  Epeak_90err_low  Epeak_90err_hi  Norm       Nomr_90err_low    Norm_90err_hi    chi2    dof
PL      -1.372    -0.166      0.166       -           -               -         1.30e-03     -1.25e-04          1.25e-04      78.350   57
CPL     -1.002    -0.453      0.754      137.158     -66.009      -137.158      2.00e-03     -7.41e-04          2.67e-03      77.410   56


=== 1-s peak spectral analysis ===
(Best model with acceptable fit: PL)

Model Ph_index Ph_90err_low Ph_90err_hi  Epeak  Epeak_90err_low  Epeak_90err_hi  Norm       Nomr_90err_low    Norm_90err_hi    chi2    dof
PL      -0.949     -0.304     0.334       -           -               -         6.65e-03     -1.21e-03          1.18e-03      44.300   57
CPL     -0.878      N/A       N/A         871.984      N/A           N/A         7.20e-03        N/A               N/A         44.450   56


=== Fluence/Peak Flux Summary ===

              Model    Band1     Band2     Band3     Band4     Band5     Total
                       15-25     25-50    50-100    100-350    15-150    15-350    keV
Fluence         PL   9.75e-08  1.94e-07  2.99e-07  1.01e-06  8.36e-07  1.60e-06   erg/cm2
      90%_error_low -1.63e-08 -2.02e-08 -3.59e-08 -2.42e-07 -8.82e-08 -2.70e-07   erg/cm2
      90%_error_hi   1.71e-08  2.00e-08  3.57e-08  2.90e-07  8.89e-08  3.10e-07   erg/cm2
Peak flux       PL   1.62e-01  2.27e-01  2.35e-01  4.46e-01  7.64e-01  1.07e+00   ph/cm2/s
      90%_error_low -5.92e-02 -5.47e-02 -4.20e-02 -1.54e-01 -1.39e-01 -1.93e-01   ph/cm2/s
      90%_error_hi   6.72e-02  5.27e-02  4.16e-02  2.06e-01  1.40e-01  2.03e-01   ph/cm2/s

Fluence        CPL   9.14e-08  2.01e-07  3.07e-07  5.85e-07  8.13e-07  1.18e-06   erg/cm2
      90%_error_low -1.94e-08 -2.39e-08 -3.89e-08 -3.45e-07 -9.93e-08 -3.56e-07   erg/cm2
      90%_error_hi   2.00e-08  2.50e-08  3.98e-08  5.52e-07  9.79e-08  5.28e-07   erg/cm2
Peak flux      CPL   1.62e-01  2.26e-01  2.34e-01  4.43e-01  7.68e-01  1.10e+00   ph/cm2/s
      90%_error_low     N/A   -5.84e-02     N/A       N/A       N/A   -3.37e-01   ph/cm2/s
      90%_error_hi      N/A    5.79e-02     N/A       N/A       N/A    1.66e-01   ph/cm2/s

======================================================================
Image
Pre-slew 15.0-350.0 keV image (Event data)
#   RAcent    DECcent   POSerr    Theta     Phi              Peak Cts       SNR   Name
   81.6892   -28.0116   0.0105    30.0854  -148.0589         0.9777866     18.307 TRIG_00155242

Foreground time interval of the image:
 -8.140  18.253 (delta_t =  26.393 [sec])
Background time interval of the image:
-291.747  -8.140 (delta_t = 283.607 [sec])
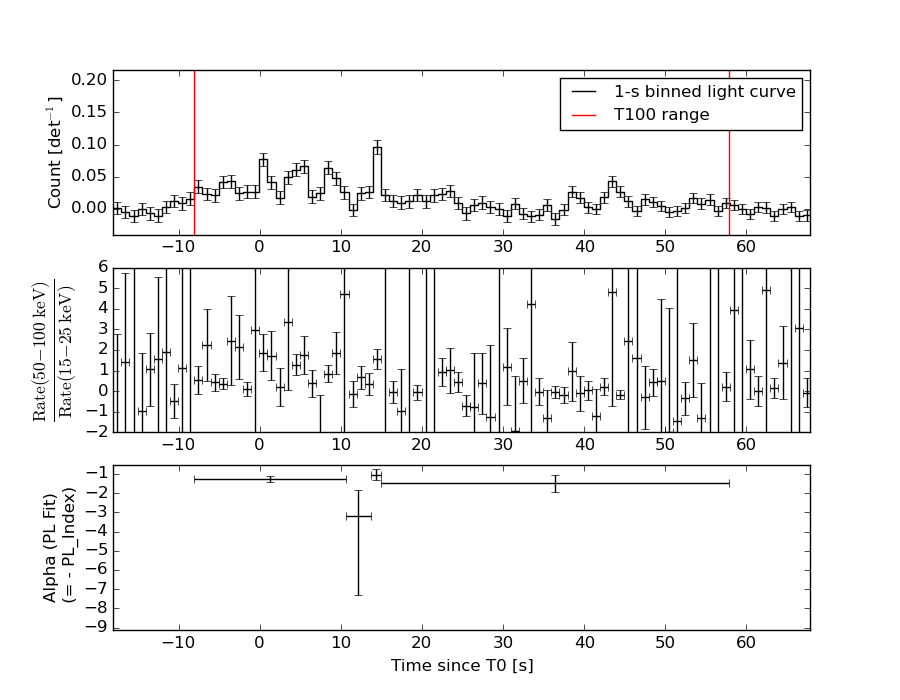
Light Curves
Note: The mask-weighted lightcurves have units of either count/det or counts/sec/det, where a det is 0.4 x 0.4 = 0.16 sq cm.
Full-time range; 1 s binning
Other quick-look light curves:
- 64 ms binning (zoomed)
- 16 ms binning (zoomed)
- 8 ms binning (zoomed)
- 2 ms binning (zoomed)
- SN=5 or 10 s binning (full-time range)
- Raw light curve
Spectra
- 64 ms binning (zoomed)
- 16 ms binning (zoomed)
- 8 ms binning (zoomed)
- 2 ms binning (zoomed)
- SN=5 or 10 s binning (full-time range)
- Raw light curve
Spectra
Notes:
- 1) The fitting includes the systematic errors.
- 2) When the burst includes telescope slew time periods, the fitting uses an average response file made from multiple 5-s response files through out the slew time plus single time preiod for the non-slew times, and weighted by the total counts in the corresponding time period using addrmf. An average response file is needed becuase a spectral fit using the pre-slew DRM will introduce some errors in both a spectral shape and a normalization if the PHA file contains a lot of the slew/post-slew time interval.
- 3) For fits to more complicated models (e.g. a power-law over a cutoff power-law), the BAT team has decided to require a chi-square improvement of more than 6 for each extra dof.
Time averaged spectrum fit using the average DRM
Power-law model
Time interval is from   -8.140 sec. to   57.836 sec.

Spectral model in power-law:
------------------------------------------------------------
Parameters  : value       lower 90%   higher 90%
Photon index: -1.37244     ( -0.165657   0.166356 )
Norm@50keV  : 1.30372E-03    ( -0.000125014   0.000124694 )
------------------------------------------------------------
#Fit statistic : Chi-Squared =          78.35 using 59 PHA bins.
# Reduced chi-squared =          1.375 for     57 degrees of freedom
# Null hypothesis probability =   3.187419e-02

Photon flux (15-150 keV)    in 65.98 sec: 0.157806 ( -0.01546  0.015491 ) ph/cm2/s
Energy fluence (15-150 keV)             : 8.36085e-07 ( -8.82047e-08  8.89371e-08 ) ergs/cm2
Cutoff power-law model
Time interval is from   -8.140 sec. to   57.836 sec.
Spectral model in the cutoff power-law:
------------------------------------------------------------
Parameters  : value       lower 90%   higher 90%
Photon index: -1.00196     ( -0.453324   0.753793 )
Epeak [keV] : 137.158      ( -66.0122 -137.161 )
Norm@50keV  : 1.99558E-03    ( -0.000741232   0.00266644 )
------------------------------------------------------------
#Fit statistic : Chi-Squared =          77.41 using 59 PHA bins.
# Reduced chi-squared =          1.382 for     56 degrees of freedom
# Null hypothesis probability =   3.057843e-02

Photon flux (15-150 keV)    in 65.98 sec: 0.155262 ( -0.016133  0.016111 ) ph/cm2/s
Energy fluence (15-150 keV)             : 8.12682e-07 ( -9.92669e-08  9.79064e-08 ) ergs/cm2
1-s peak spectrum fit
Power-law model
Time interval is from   13.688 sec. to   14.688 sec.

Spectral model in power-law:
------------------------------------------------------------
Parameters  : value       lower 90%   higher 90%
Photon index: -0.949027     ( -0.304084   0.333621 )
Norm@50keV  : 6.65404E-03    ( -0.00121003   0.00118426 )
------------------------------------------------------------
#Fit statistic : Chi-Squared =          44.30 using 59 PHA bins.
# Reduced chi-squared =         0.7773 for     57 degrees of freedom
# Null hypothesis probability =   8.901264e-01

Photon flux (15-150 keV)    in 1 sec: 0.764454 ( -0.139127  0.140131 ) ph/cm2/s
Energy fluence (15-150 keV)             : 7.33061e-08 ( -1.31693e-08  1.32226e-08 ) ergs/cm2
Cutoff power-law model
Time interval is from   13.688 sec. to   14.688 sec.
Spectral model in the cutoff power-law:
------------------------------------------------------------
Parameters  : value       lower 90%   higher 90%
Photon index: -0.878321     (       )
Epeak [keV] : 871.984      (   )
Norm@50keV  : 7.20051E-03    (     )
------------------------------------------------------------
#Fit statistic : Chi-Squared =          44.45 using 59 PHA bins.
# Reduced chi-squared =         0.7937 for     56 degrees of freedom
# Null hypothesis probability =   8.671428e-01

Photon flux (15-150 keV)    in 1 sec: 0.767572 (    ) ph/cm2/s
Energy fluence (15-150 keV)             : 7.35343e-08 ( -1.4521e-08  1.41012e-08 ) ergs/cm2
Time-resolved spectra
Distribution
T90 vs. Hardness ratio plot
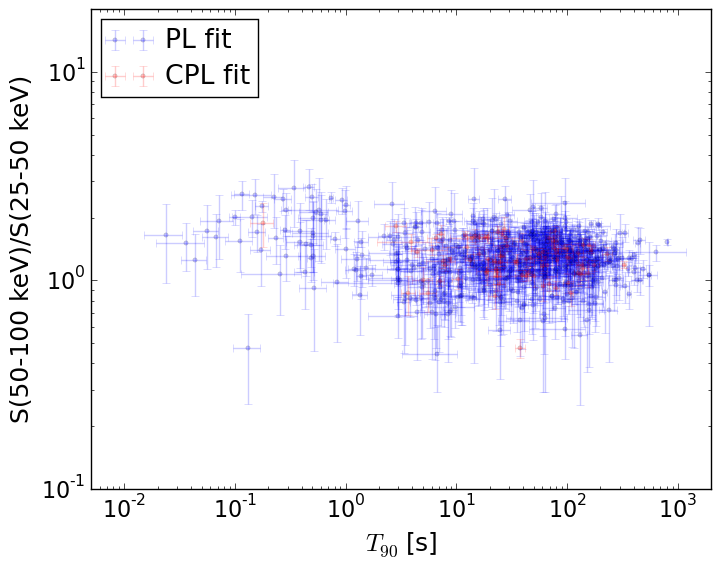
T90                                   = N/A sec.
Hardness ratio (energy fluence ratio) = N/A
S(15-50 keV) vs. S(50-150 keV) plot
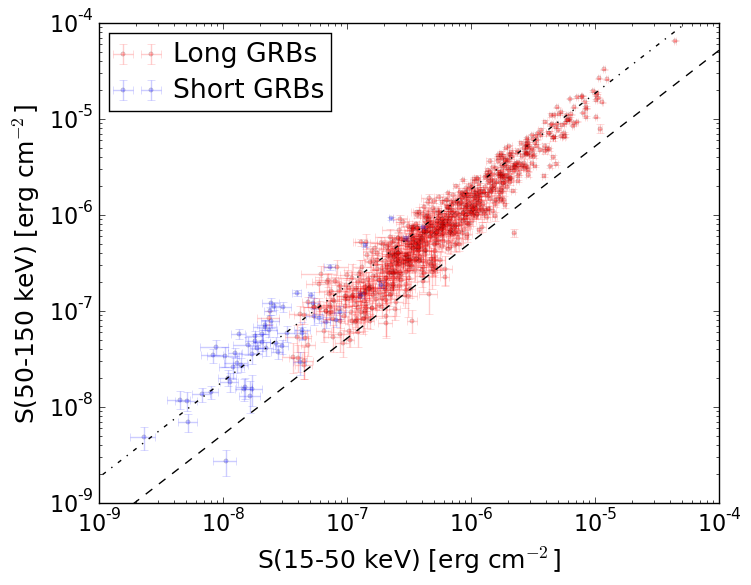
S(15-50 keV)  = N/A
S(50-150 keV) = N/A
The dash-dotted line and the dashed line traces the fluences calculated from the Band function with Epeak = 15 and 150 keV, respectively. Both lines assume a canonical values of alpha = -1 and beta = -2.5.
Mask shadow pattern
IMX = -4.916238833133412E-01, IMY = 3.064985312080724E-01
Spacecraft aspect plot
Bright source in the pre-burst/pre-slew/post-slew images
Pre-burst image of 15-350 keV band
Time interval of the image:
-291.747410 -8.140000

# RAcent  DECcent POSerr Theta    Phi  PeakCts   SNR AngSep     Name
#  [deg]    [deg]    ['] [deg]  [deg]                   [']
 33.8105 -18.0689    2.4  31.5  115.4   1.3211   4.7 ------	UNKNOWN
 79.2550 -19.9434    2.1  34.9 -160.9   1.0750   5.4 ------	UNKNOWN
 91.3220   1.5605    2.6  59.4 -163.2   5.8917   4.5 ------	UNKNOWN
111.3744 -44.8382    3.1  41.3 -100.9   3.3556   3.8 ------	UNKNOWN
Pre-slew background subtracted image of 15-350 keV band
Time interval of the image:
-8.140000 18.252600

# RAcent  DECcent POSerr Theta    Phi  PeakCts   SNR AngSep     Name
#  [deg]    [deg]    ['] [deg]  [deg]                   [']
 81.6892 -28.0115    0.6  30.1 -148.1   0.9778  18.3 ------	UNKNOWN
 97.5662  -9.5148    2.0  53.8 -149.5   0.9985   5.8 ------	UNKNOWN
Post-slew image of 15-350 keV band
Time interval of the image:
70.052610 303.005500

# RAcent  DECcent POSerr Theta    Phi  PeakCts   SNR AngSep     Name
#  [deg]    [deg]    ['] [deg]  [deg]                   [']
 83.6313  22.0132    0.5  50.1 -175.9   8.7973  24.1    0.1	Crab
135.7259 -40.5770   16.3  45.6  -57.5  -0.5336  -0.7    9.1	Vela X-1
 36.3887 -27.1342    1.9  40.0   82.1   3.5823   6.0 ------	UNKNOWN
 57.8604   8.9643    2.4  43.6  146.4   1.8918   4.8 ------	UNKNOWN
 93.7702 -72.2569    2.3  44.7   -3.4   1.3732   4.9 ------	UNKNOWN
121.7862 -75.9438    2.8  51.7   -9.7   1.5108   4.1 ------	UNKNOWN