Analysis Summary
Notes:
- 1) No attempt has been made to eliminate the non-significant decimal places.
- 2) This batgrbproduct analysis is done using the HEASARC data.
- 3) This batgrbproduct analysis is using the flight position for the mask-weighting calculation.
======================================================================
BAT GRB EVENT DATA PROCESSING REPORT
Process Script Ver: batgrbproduct v2.46
Process Start Time: Wed Jan 22 20:13:51 EST 2014
Host Name: batevent1
Current Working Dir: /local/data/batevent/batevent_reproc/trigger155284
======================================================================
Trigger: 00155284 Segment: 000
BAT Trigger Time: 148512184 [s; MET]
Trigger Stop: 148512248 [s; MET]
UTC: 2005-09-15T21:23:04.269060 [includes UTCF correction]
Where From?: TDRSS position message
BAT
RA: 219.095807718615 Dec: -67.4048403823788 [deg; J2000]
Catalogged Source?: NO
Point Source?: YES
GRB Indicated?: YES [ by BAT flight software ]
Image S/N Ratio: 23.35
Image Trigger?: YES
Rate S/N Ratio: 0 [ if not an image trigger ]
Image S/N Ratio: 23.35
Analysis Position: [ source = BAT ]
RA: 219.095807718615 Dec: -67.4048403823788 [deg; J2000]
Refined Position: [ source = BAT pre-slew burst ]
RA: 219.120523734458 Dec: -67.4058125131395 [deg; J2000]
{ 14h 36m 28.9s , -67d 24' 20.9" }
+/- 0.761278136392281 [arcmin] (estimated 90% radius based on SNR)
+/- 0.273531630923196 [arcmin] (formal 1-sigma fit error)
SNR: 44.9099069674404
Angular difference between the analysis and refined position is 0.572745 arcmin
Partial Coding Fraction: 0.53125 [ including projection effects ]
Duration
T90: 43.0960000157356 +/- 4.40570765213235
Measured from: -4.2960000038147
to: 38.8000000119209 [s; relative to TRIGTIME]
T50: 21.3000000119209 +/- 1.19930647318383
Measured from: 2.40000000596046
to: 23.7000000178814 [s; relative to TRIGTIME]
Fluence
Peak Flux (peak 1 second)
Measured from: -3.07600000500679
to: -2.07600000500679 [s; relative to TRIGTIME]
Total Fluence
Measured from: -9.1240000128746
to: 56.9160000085831 [s; relative to TRIGTIME]
Band 1 Band 2 Band 3 Band 4
15-25 25-50 50-100 100-350 keV
Total 2.134346 2.491964 1.430887 0.247331
0.058932 0.060111 0.050218 0.040690 [error]
Peak 0.080557 0.103552 0.073325 0.018130
0.007934 0.008300 0.007200 0.005277 [error]
[ fluence units of on-axis counts / fully illuminated detector ]
======================================================================
====== Table of the duration information =============================
Value tstart tstop
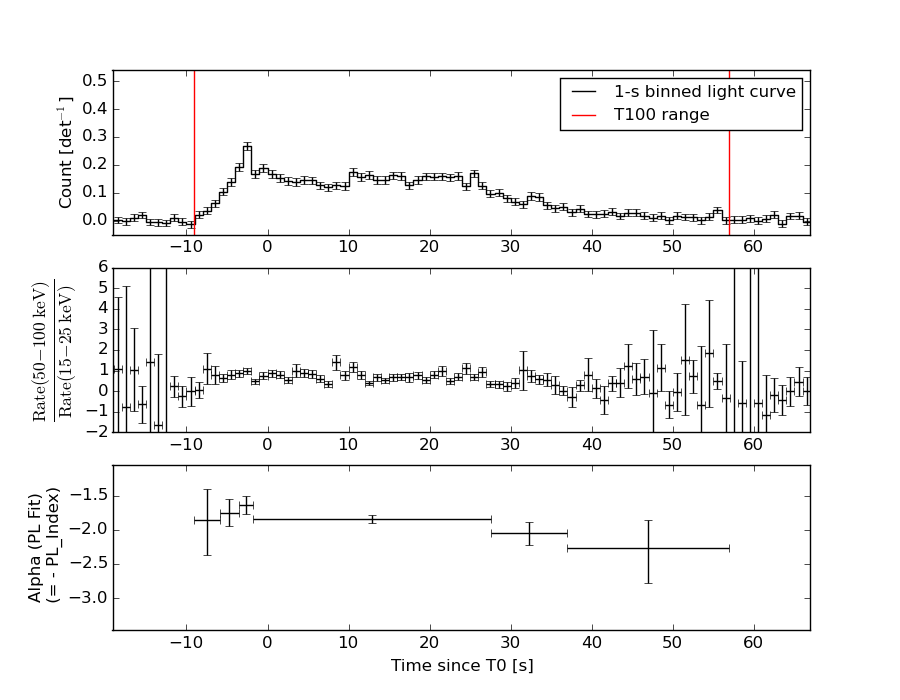
T100 66.040 -9.124 56.916
T90 43.096 -4.296 38.800
T50 21.300 2.400 23.700
Peak 1.000 -3.076 -2.076
====== Spectral Analysis Summary =====================================
Model : spectral model: simple power-law (PL) and cutoff power-law (CPL)
Ph_index : photon index: E^{Ph_index}
Ph_90err : 90% error of the photon index
Epeak : Epeak in keV
Epeak_90err: 90% error of Epeak
Norm : normalization at 50 keV in both the PL model and CPL model
Nomr_90err : 90% error of the normalization
chi2 : Chi-Squared
dof : degree of freedo
=== Time-averaged spectral analysis ===
(Best model with acceptable fit: CPL)
Model Ph_index Ph_90err_low Ph_90err_hi Epeak Epeak_90err_low Epeak_90err_hi Norm Nomr_90err_low Norm_90err_hi chi2 dof
PL -1.887 -0.062 0.062 - - - 5.86e-03 -1.98e-04 1.98e-04 73.620 57
CPL -1.374 -0.265 0.282 59.441 -7.268 14.634 1.06e-02 -2.76e-03 4.05e-03 62.110 56
=== 1-s peak spectral analysis ===
(Best model with acceptable fit: PL)
Model Ph_index Ph_90err_low Ph_90err_hi Epeak Epeak_90err_low Epeak_90err_hi Norm Nomr_90err_low Norm_90err_hi chi2 dof
PL -1.597 -0.155 0.152 - - - 1.78e-02 -1.63e-03 1.61e-03 44.920 57
CPL -1.353 -0.376 0.648 130.513 -63.866 -130.513 2.38e-02 -1.44e-02 2.67e-02 44.400 56
=== Fluence/Peak Flux Summary ===
Model Band1 Band2 Band3 Band4 Band5 Total
15-25 25-50 50-100 100-350 15-150 15-350 keV
Fluence PL 7.12e-07 1.03e-06 1.12e-06 2.26e-06 3.56e-06 5.12e-06 erg/cm2
90%_error_low -4.01e-08 -3.45e-08 -5.13e-08 -2.16e-07 -1.20e-07 -2.57e-07 erg/cm2
90%_error_hi 4.09e-08 3.44e-08 5.13e-08 2.31e-07 1.20e-07 2.68e-07 erg/cm2
Peak flux PL 8.06e-01 7.66e-01 5.06e-01 5.20e-01 2.29e+00 2.60e+00 ph/cm2/s
90%_error_low -1.15e-01 -6.96e-02 -5.91e-02 -1.14e-01 -2.02e-01 -2.26e-01 ph/cm2/s
90%_error_hi 1.20e-01 6.92e-02 5.86e-02 1.31e-01 2.02e-01 2.27e-01 ph/cm2/s
Fluence CPL 6.47e-07 1.08e-06 1.13e-06 1.11e-06 3.40e-06 3.97e-06 erg/cm2
90%_error_low -5.01e-08 -4.06e-08 -5.49e-08 -3.11e-07 -1.43e-07 -3.47e-07 erg/cm2
90%_error_hi 5.11e-08 4.10e-08 5.51e-08 4.57e-07 1.43e-07 4.79e-07 erg/cm2
Peak flux CPL 7.73e-01 7.84e-01 5.16e-01 3.88e-01 2.27e+00 2.46e+00 ph/cm2/s
90%_error_low -1.38e-01 -8.07e-02 -6.34e-02 -1.92e-01 -2.10e-01 -2.99e-01 ph/cm2/s
90%_error_hi 1.34e-01 8.41e-02 6.50e-02 1.70e-01 2.10e-01 3.35e-01 ph/cm2/s
======================================================================
Image
Pre-slew 15.0-350.0 keV image (Event data)
#   RAcent    DECcent   POSerr    Theta     Phi              Peak Cts       SNR   Name
  219.1205   -67.4058   0.0043    24.5428    88.2863         6.1487488     44.910 TRIG_00155284

Foreground time interval of the image:
 -4.499  56.916 (delta_t =  61.415 [sec])
Background time interval of the image:
Light Curves
Note: The mask-weighted lightcurves have units of either count/det or counts/sec/det, where a det is 0.4 x 0.4 = 0.16 sq cm.
Full-time range; 1 s binning
Other quick-look light curves:
- 64 ms binning (zoomed)
- 16 ms binning (zoomed)
- 8 ms binning (zoomed)
- 2 ms binning (zoomed)
- SN=5 or 10 s binning (full-time range)
- Raw light curve
Spectra
- 64 ms binning (zoomed)
- 16 ms binning (zoomed)
- 8 ms binning (zoomed)
- 2 ms binning (zoomed)
- SN=5 or 10 s binning (full-time range)
- Raw light curve
Spectra
Notes:
- 1) The fitting includes the systematic errors.
- 2) When the burst includes telescope slew time periods, the fitting uses an average response file made from multiple 5-s response files through out the slew time plus single time preiod for the non-slew times, and weighted by the total counts in the corresponding time period using addrmf. An average response file is needed becuase a spectral fit using the pre-slew DRM will introduce some errors in both a spectral shape and a normalization if the PHA file contains a lot of the slew/post-slew time interval.
- 3) For fits to more complicated models (e.g. a power-law over a cutoff power-law), the BAT team has decided to require a chi-square improvement of more than 6 for each extra dof.
Time averaged spectrum fit using the average DRM
Power-law model
Time interval is from   -9.124 sec. to   56.916 sec.

Spectral model in power-law:
------------------------------------------------------------
Parameters  : value       lower 90%   higher 90%
Photon index: -1.88667     ( -0.0620983   0.0615787 )
Norm@50keV  : 5.86294E-03    ( -0.000198396   0.000197766 )
------------------------------------------------------------
#Fit statistic : Chi-Squared =          73.62 using 59 PHA bins.
# Reduced chi-squared =          1.292 for     57 degrees of freedom
# Null hypothesis probability =   6.841046e-02

Photon flux (15-150 keV)    in 66.04 sec: 0.836722 ( -0.029241  0.029349 ) ph/cm2/s
Energy fluence (15-150 keV)             : 3.55998e-06 ( -1.19831e-07  1.20269e-07 ) ergs/cm2
Cutoff power-law model
Time interval is from   -9.124 sec. to   56.916 sec.
Spectral model in the cutoff power-law:
------------------------------------------------------------
Parameters  : value       lower 90%   higher 90%
Photon index: -1.37401     ( -0.26462   0.281655 )
Epeak [keV] : 59.4409      ( -7.26838 14.634 )
Norm@50keV  : 1.06394E-02    ( -0.00275936   0.00404717 )
------------------------------------------------------------
#Fit statistic : Chi-Squared =          62.11 using 59 PHA bins.
# Reduced chi-squared =          1.109 for     56 degrees of freedom
# Null hypothesis probability =   2.676335e-01

Photon flux (15-150 keV)    in 66.04 sec: 0.805040 ( -0.032896  0.033049 ) ph/cm2/s
Energy fluence (15-150 keV)             : 3.4039e-06 ( -1.42553e-07  1.42821e-07 ) ergs/cm2
1-s peak spectrum fit
Power-law model
Time interval is from   -3.076 sec. to   -2.076 sec.

Spectral model in power-law:
------------------------------------------------------------
Parameters  : value       lower 90%   higher 90%
Photon index: -1.597     ( -0.154924   0.15216 )
Norm@50keV  : 1.78329E-02    ( -0.00162712   0.00161383 )
------------------------------------------------------------
#Fit statistic : Chi-Squared =          44.92 using 59 PHA bins.
# Reduced chi-squared =         0.7881 for     57 degrees of freedom
# Null hypothesis probability =   8.767827e-01

Photon flux (15-150 keV)    in 1 sec: 2.28956 ( -0.2017  0.20194 ) ph/cm2/s
Energy fluence (15-150 keV)             : 1.66859e-07 ( -1.63127e-08  1.64779e-08 ) ergs/cm2
Cutoff power-law model
Time interval is from   -3.076 sec. to   -2.076 sec.
Spectral model in the cutoff power-law:
------------------------------------------------------------
Parameters  : value       lower 90%   higher 90%
Photon index: -1.3525     ( -0.376383   0.647505 )
Epeak [keV] : 130.513      ( -63.8668 -130.513 )
Norm@50keV  : 2.38185E-02    ( -0.0144294   0.0267058 )
------------------------------------------------------------
#Fit statistic : Chi-Squared =          44.40 using 59 PHA bins.
# Reduced chi-squared =         0.7929 for     56 degrees of freedom
# Null hypothesis probability =   8.682127e-01

Photon flux (15-150 keV)    in 1 sec: 2.26524 ( -0.21015  0.20954 ) ph/cm2/s
Energy fluence (15-150 keV)             : 1.63817e-07 ( -1.80632e-08  1.79019e-08 ) ergs/cm2
Time-resolved spectra
Distribution
T90 vs. Hardness ratio plot
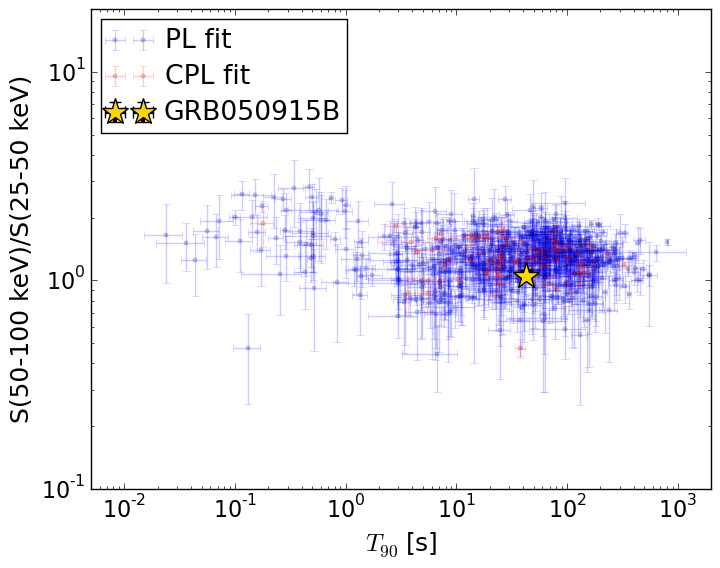
T90                                   = 43.096 sec.
Hardness ratio (energy fluence ratio) = 1.05470288789
S(15-50 keV) vs. S(50-150 keV) plot
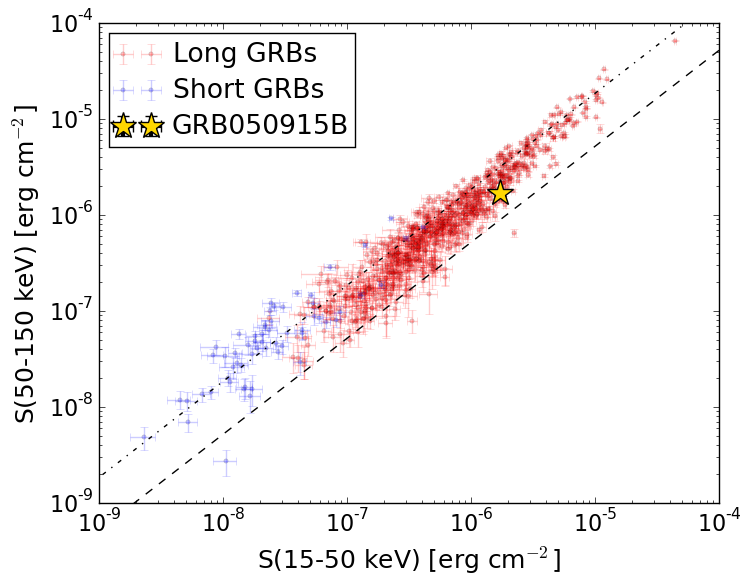
S(15-50 keV)  = 1.7225606e-06
S(50-150 keV) = 1.6813926e-06
The dash-dotted line and the dashed line traces the fluences calculated from the Band function with Epeak = 15 and 150 keV, respectively. Both lines assume a canonical values of alpha = -1 and beta = -2.5.
Mask shadow pattern
IMX = 1.365583999024523E-02, IMY = -4.564246376089915E-01
Spacecraft aspect plot
Bright source in the pre-burst/pre-slew/post-slew images
Pre-burst image of 15-350 keV band
Time interval of the image:
Pre-slew background subtracted image of 15-350 keV band
Time interval of the image:
-4.499400 56.916000

# RAcent  DECcent POSerr Theta    Phi  PeakCts   SNR AngSep     Name
#  [deg]    [deg]    ['] [deg]  [deg]                   [']
135.3739 -40.4191    0.0  36.9 -158.9  -0.0409  -0.3   10.8	Vela X-1
170.2887 -60.6877   49.7  15.1  150.4   0.0217   0.2    4.0	Cen X-3
186.6179 -62.7758    0.8  13.9  118.5   1.2732  14.5    1.1	GX 301-2
219.1197 -67.4057    0.3  24.5   88.3   6.1477  44.9 ------	UNKNOWN
229.2329 -46.5561    2.7  28.1   39.2   0.4929   4.3 ------	UNKNOWN
234.0319 -10.7076    2.6  54.5   -0.3   1.5517   4.5 ------	UNKNOWN
138.0279 -18.6523    2.4  49.5 -132.4   2.1433   4.9 ------	UNKNOWN
Post-slew image of 15-350 keV band
Time interval of the image:
120.100600 303.110400

# RAcent  DECcent POSerr Theta    Phi  PeakCts   SNR AngSep     Name
#  [deg]    [deg]    ['] [deg]  [deg]                   [']
135.3124 -40.5473   25.9  50.8 -146.0   0.2071   0.4    9.9	Vela X-1
170.1575 -60.4847    6.9  21.9 -138.6   0.2508   1.7    9.5	Cen X-3
186.6683 -62.7635    0.5  14.2 -129.6   3.3581  24.2    0.5	GX 301-2
244.9972 -15.6400    1.3  54.4  -11.9   4.2413   9.2    1.0	Sco X-1
255.8251 -37.8619    6.3  35.9   10.5  -0.3428  -1.8    7.7	4U 1700-377
256.5857 -36.4286    7.5  37.5   10.5   0.3080   1.5    7.3	GX 349+2
262.9038 -24.6680   15.0  50.4   11.7   0.3212   0.8    7.4	GX 1+4
264.7262 -44.4876    4.4  33.0   26.4   0.4890   2.6    2.4	4U 1735-44
270.3951 -25.0750   16.7  52.5   20.0   0.4419   0.7    6.0	GX 5-1
270.2468 -25.7033    9.0  51.9   20.1   0.7645   1.3    3.8	GRS 1758-258
275.9226 -30.2384   10.7  49.7   28.4   0.6425   1.1    7.7	H1820-303
263.0707 -33.7577    2.8  42.0   16.5   1.0088   4.2    6.2	GX 354-0
253.4647 -39.8573    1.9  33.4    8.9   1.1048   6.0 ------	UNKNOWN
 96.5255 -50.9032    2.8  54.1  177.9   2.1008   4.1 ------	UNKNOWN
 98.4139 -47.3433    3.5  56.9 -179.0   2.6827   3.3 ------	UNKNOWN
163.7184 -36.0127    3.0  44.0 -116.5   2.3837   3.9 ------	UNKNOWN