Analysis Summary
Notes:
- 1) No attempt has been made to eliminate the non-significant decimal places.
- 2) This batgrbproduct analysis is done using the HEASARC data.
- 3) This batgrbproduct analysis is using the flight position for the mask-weighting calculation.
======================================================================
BAT GRB EVENT DATA PROCESSING REPORT
Process Script Ver: batgrbproduct v2.46
Process Start Time: Wed Jan 22 20:04:46 EST 2014
Host Name: batevent1
Current Working Dir: /local/data/batevent/batevent_reproc/trigger156467
======================================================================
Trigger: 00156467 Segment: 000
BAT Trigger Time: 149111750.144 [s; MET]
Trigger Stop: 149111751.168 [s; MET]
UTC: 2005-09-22T19:55:50.400700 [includes UTCF correction]
Where From?: TDRSS position message
BAT
RA: 317.390673787551 Dec: -8.77177360830505 [deg; J2000]
Catalogged Source?: NO
Point Source?: YES
GRB Indicated?: YES [ by BAT flight software ]
Image S/N Ratio: 22.78
Image Trigger?: NO
Rate S/N Ratio: 106.677082824757 [ if not an image trigger ]
Image S/N Ratio: 22.78
Analysis Position: [ source = BAT ]
RA: 317.390673787551 Dec: -8.77177360830505 [deg; J2000]
Refined Position: [ source = BAT pre-slew burst ]
RA: 317.3872254408 Dec: -8.76251539765766 [deg; J2000]
{ 21h 09m 32.9s , -08d 45' 45.1" }
+/- 0.679972630743099 [arcmin] (estimated 90% radius based on SNR)
+/- 0.199803507517951 [arcmin] (formal 1-sigma fit error)
SNR: 52.7735529253484
Angular difference between the analysis and refined position is 0.591934 arcmin
Partial Coding Fraction: 0.53125 [ including projection effects ]
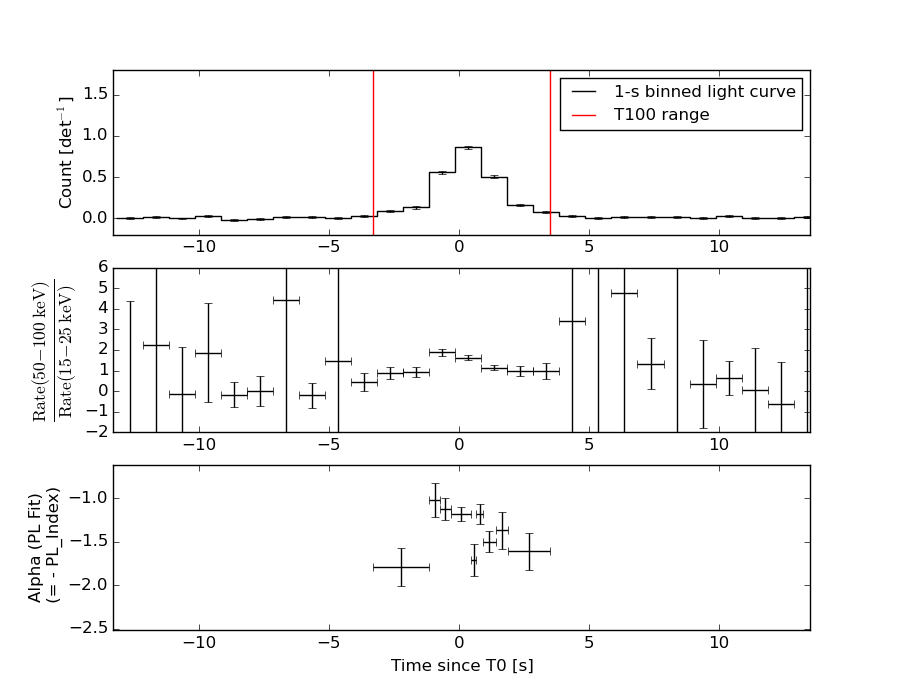
Duration
T90: 4.55200001597404 +/- 0.448017870687082
Measured from: -2.08399999141693
to: 2.46800002455711 [s; relative to TRIGTIME]
T50: 1.4200000166893 +/- 0.0933809188437612
Measured from: -0.407999992370605
to: 1.0120000243187 [s; relative to TRIGTIME]
Fluence
Peak Flux (peak 1 second)
Measured from: -0.0760000050067902
to: 0.92399999499321 [s; relative to TRIGTIME]
Total Fluence
Measured from: -3.31599998474121
to: 3.4839999973774 [s; relative to TRIGTIME]
Band 1 Band 2 Band 3 Band 4
15-25 25-50 50-100 100-350 keV
Total 0.531671 0.894585 0.732055 0.225969
0.020857 0.023376 0.021434 0.016176 [error]
Peak 0.174968 0.334242 0.275743 0.091580
0.009524 0.011640 0.011251 0.007795 [error]
[ fluence units of on-axis counts / fully illuminated detector ]
======================================================================
====== Table of the duration information =============================
Value tstart tstop
T100 6.800 -3.316 3.484
T90 4.552 -2.084 2.468
T50 1.420 -0.408 1.012
Peak 1.000 -0.076 0.924
====== Spectral Analysis Summary =====================================
Model : spectral model: simple power-law (PL) and cutoff power-law (CPL)
Ph_index : photon index: E^{Ph_index}
Ph_90err : 90% error of the photon index
Epeak : Epeak in keV
Epeak_90err: 90% error of Epeak
Norm : normalization at 50 keV in both the PL model and CPL model
Nomr_90err : 90% error of the normalization
chi2 : Chi-Squared
dof : degree of freedo
=== Time-averaged spectral analysis ===
(Best model with acceptable fit: PL)
Model Ph_index Ph_90err_low Ph_90err_hi Epeak Epeak_90err_low Epeak_90err_hi Norm Nomr_90err_low Norm_90err_hi chi2 dof
PL -1.357 -0.056 0.056 - - - 2.45e-02 -7.57e-04 7.57e-04 70.980 57
CPL -1.126 -0.213 0.226 209.568 -76.969 1431.682 3.13e-02 -6.07e-03 8.24e-03 67.630 56
=== 1-s peak spectral analysis ===
(Best model with acceptable fit: CPL)
Model Ph_index Ph_90err_low Ph_90err_hi Epeak Epeak_90err_low Epeak_90err_hi Norm Nomr_90err_low Norm_90err_hi chi2 dof
PL -1.299 -0.070 0.070 - - - 6.04e-02 -2.48e-03 2.48e-03 69.860 57
CPL -0.890 -0.275 0.293 146.483 -40.006 174.475 9.46e-02 -2.40e-02 3.48e-02 63.190 56
=== Fluence/Peak Flux Summary ===
Model Band1 Band2 Band3 Band4 Band5 Total
15-25 25-50 50-100 100-350 15-150 15-350 keV
Fluence PL 1.86e-07 3.73e-07 5.83e-07 2.01e-06 1.62e-06 3.15e-06 erg/cm2
90%_error_low -1.13e-08 -1.35e-08 -2.15e-08 -1.62e-07 -5.36e-08 -1.75e-07 erg/cm2
90%_error_hi 1.15e-08 1.34e-08 2.14e-08 1.72e-07 5.36e-08 1.83e-07 erg/cm2
Peak flux PL 2.05e+00 2.33e+00 1.89e+00 2.56e+00 7.20e+00 8.83e+00 ph/cm2/s
90%_error_low -1.55e-01 -1.10e-01 -9.11e-02 -2.48e-01 -3.05e-01 -3.73e-01 ph/cm2/s
90%_error_hi 1.59e-01 1.09e-01 9.06e-02 2.63e-01 3.05e-01 3.74e-01 ph/cm2/s
Fluence CPL 1.76e-07 3.79e-07 5.96e-07 1.47e-06 1.60e-06 2.62e-06 erg/cm2
90%_error_low -1.41e-08 -1.48e-08 -2.46e-08 -3.58e-07 -5.75e-08 -3.57e-07 erg/cm2
90%_error_hi 1.44e-08 1.49e-08 2.48e-08 4.89e-07 5.73e-08 4.86e-07 erg/cm2
Peak flux CPL 1.87e+00 2.40e+00 1.98e+00 1.69e+00 7.09e+00 7.94e+00 ph/cm2/s
90%_error_low -1.88e-01 -1.23e-01 -1.09e-01 -4.00e-01 -3.14e-01 -5.15e-01 ph/cm2/s
90%_error_hi 1.93e-01 1.24e-01 1.10e-01 5.43e-01 3.14e-01 6.12e-01 ph/cm2/s
======================================================================
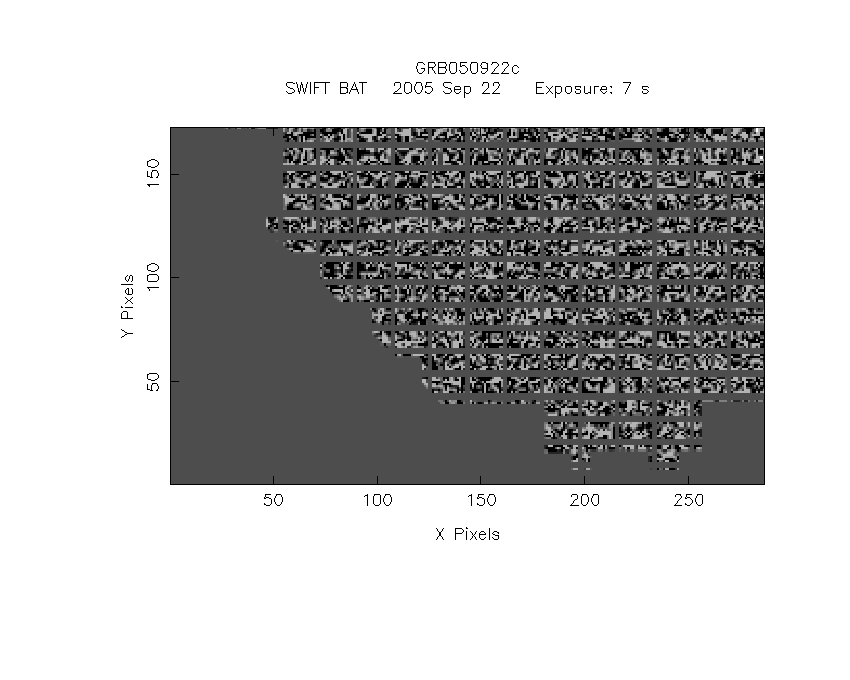
Image
Pre-slew 15.0-350.0 keV image (Event data)
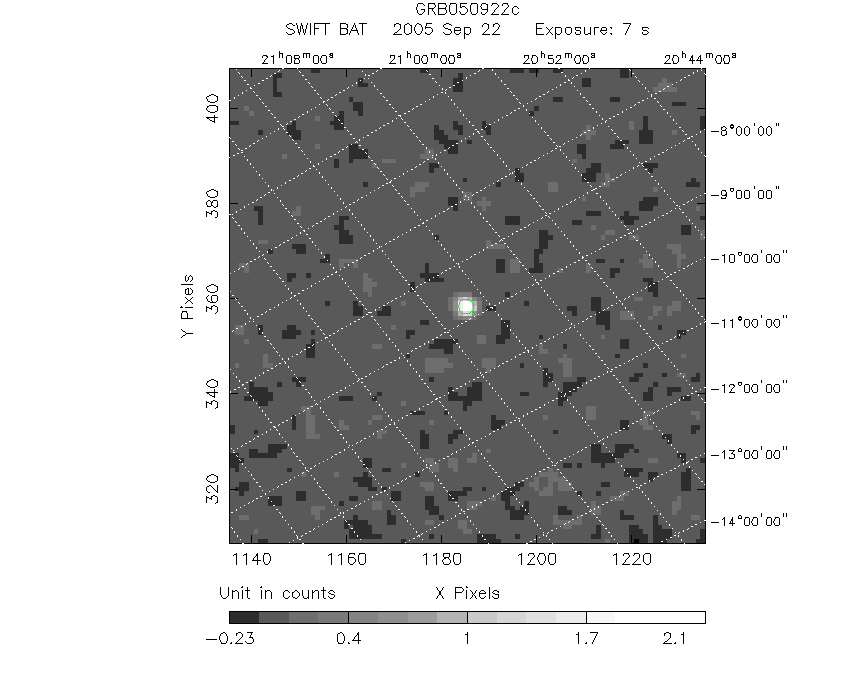
#   RAcent    DECcent   POSerr    Theta     Phi              Peak Cts       SNR   Name
  317.3872    -8.7625   0.0036    34.5467   158.8477         2.5092686     52.774 TRIG_00156467

Foreground time interval of the image:
 -3.316   3.484 (delta_t =   6.800 [sec])
Background time interval of the image:
-51.843  -3.316 (delta_t =  48.527 [sec])
Light Curves
Note: The mask-weighted lightcurves have units of either count/det or counts/sec/det, where a det is 0.4 x 0.4 = 0.16 sq cm.
Full-time range; 1 s binning
Other quick-look light curves:
- 64 ms binning (zoomed)
- 16 ms binning (zoomed)
- 8 ms binning (zoomed)
- 2 ms binning (zoomed)
- SN=5 or 10 s binning (full-time range)
- Raw light curve
Spectra
- 64 ms binning (zoomed)
- 16 ms binning (zoomed)
- 8 ms binning (zoomed)
- 2 ms binning (zoomed)
- SN=5 or 10 s binning (full-time range)
- Raw light curve
Spectra
Notes:
- 1) The fitting includes the systematic errors.
- 2) When the burst includes telescope slew time periods, the fitting uses an average response file made from multiple 5-s response files through out the slew time plus single time preiod for the non-slew times, and weighted by the total counts in the corresponding time period using addrmf. An average response file is needed becuase a spectral fit using the pre-slew DRM will introduce some errors in both a spectral shape and a normalization if the PHA file contains a lot of the slew/post-slew time interval.
- 3) For fits to more complicated models (e.g. a power-law over a cutoff power-law), the BAT team has decided to require a chi-square improvement of more than 6 for each extra dof.
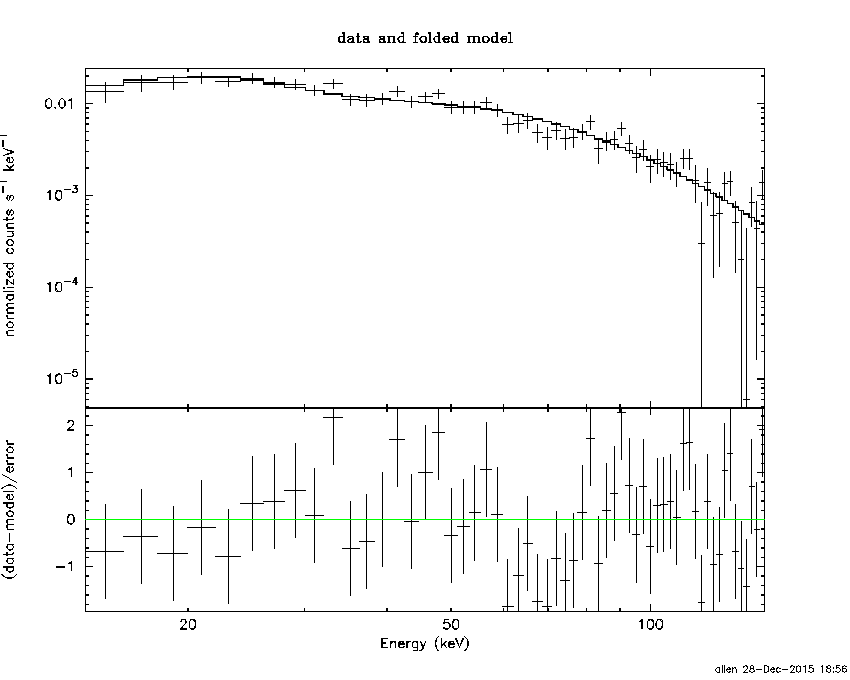
Time averaged spectrum fit using the average DRM
Power-law model
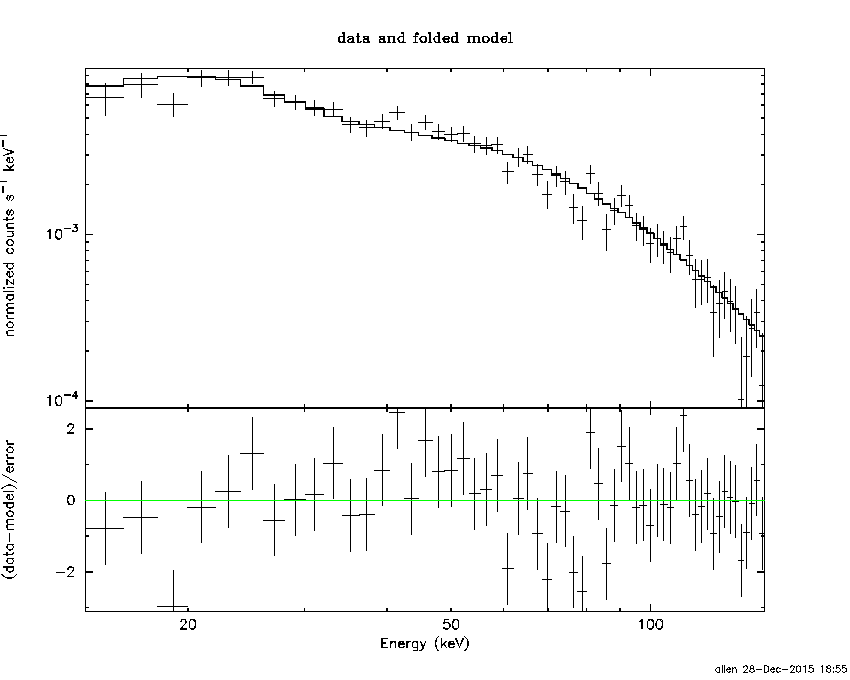
Time interval is from   -3.316 sec. to    3.484 sec.

Spectral model in power-law:
------------------------------------------------------------
Parameters  : value       lower 90%   higher 90%
Photon index: -1.35664     ( -0.0557072   0.0558196 )
Norm@50keV  : 2.44893E-02    ( -0.000757394   0.000757376 )
------------------------------------------------------------
#Fit statistic : Chi-Squared =          70.98 using 59 PHA bins.
# Reduced chi-squared =          1.245 for     57 degrees of freedom
# Null hypothesis probability =   1.008992e-01

Photon flux (15-150 keV)    in 6.8 sec: 2.95435 ( -0.09835  0.09854 ) ph/cm2/s
Energy fluence (15-150 keV)             : 1.62423e-06 ( -5.35501e-08  5.36379e-08 ) ergs/cm2
Cutoff power-law model
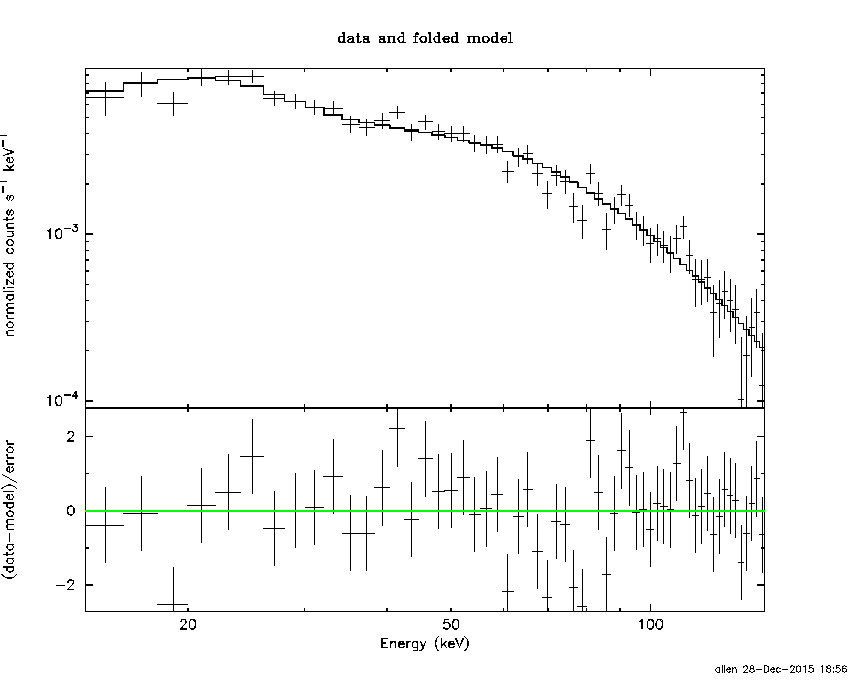
Time interval is from   -3.316 sec. to    3.484 sec.
Spectral model in the cutoff power-law:
------------------------------------------------------------
Parameters  : value       lower 90%   higher 90%
Photon index: -1.12628     ( -0.212862   0.226412 )
Epeak [keV] : 209.568      ( -76.9706 1431.68 )
Norm@50keV  : 3.12754E-02    ( -0.00607098   0.00824488 )
------------------------------------------------------------
#Fit statistic : Chi-Squared =          67.63 using 59 PHA bins.
# Reduced chi-squared =          1.208 for     56 degrees of freedom
# Null hypothesis probability =   1.371989e-01

Photon flux (15-150 keV)    in 6.8 sec: 2.91635 ( -0.104  0.10424 ) ph/cm2/s
Energy fluence (15-150 keV)             : 1.60328e-06 ( -5.74924e-08  5.72616e-08 ) ergs/cm2
1-s peak spectrum fit
Power-law model
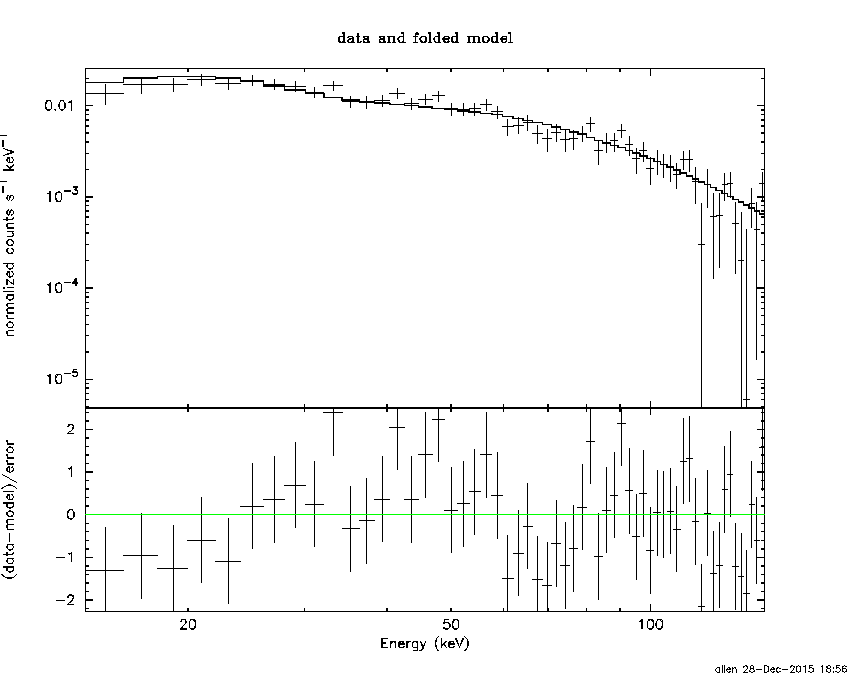
Time interval is from   -0.076 sec. to    0.924 sec.

Spectral model in power-law:
------------------------------------------------------------
Parameters  : value       lower 90%   higher 90%
Photon index: -1.29912     ( -0.0696745   0.0696675 )
Norm@50keV  : 6.03769E-02    ( -0.00247541   0.00247517 )
------------------------------------------------------------
#Fit statistic : Chi-Squared =          69.86 using 59 PHA bins.
# Reduced chi-squared =          1.226 for     57 degrees of freedom
# Null hypothesis probability =   1.178458e-01

Photon flux (15-150 keV)    in 1 sec: 7.20203 ( -0.30509  0.30536 ) ph/cm2/s
Energy fluence (15-150 keV)             : 5.96829e-07 ( -2.68747e-08  2.69489e-08 ) ergs/cm2
Cutoff power-law model
Time interval is from   -0.076 sec. to    0.924 sec.
Spectral model in the cutoff power-law:
------------------------------------------------------------
Parameters  : value       lower 90%   higher 90%
Photon index: -0.889571     ( -0.274956   0.293392 )
Epeak [keV] : 146.483      ( -40.006 174.475 )
Norm@50keV  : 9.45512E-02    ( -0.0240426   0.0348189 )
------------------------------------------------------------
#Fit statistic : Chi-Squared =          63.19 using 59 PHA bins.
# Reduced chi-squared =          1.128 for     56 degrees of freedom
# Null hypothesis probability =   2.373631e-01

Photon flux (15-150 keV)    in 1 sec: 7.08802 ( -0.31383  0.31405 ) ph/cm2/s
Energy fluence (15-150 keV)             : 5.84346e-07 ( -2.87233e-08  2.85545e-08 ) ergs/cm2
Time-resolved spectra
Distribution
T90 vs. Hardness ratio plot
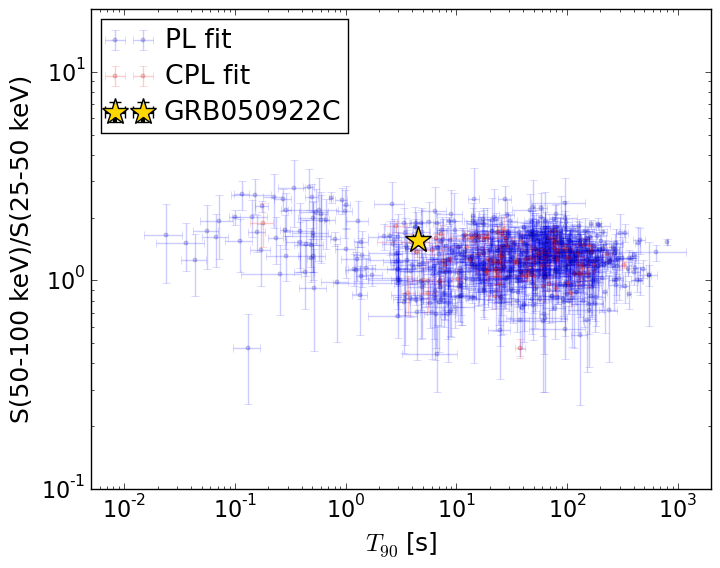
T90                                   = 4.552 sec.
Hardness ratio (energy fluence ratio) = 1.56199642582
S(15-50 keV) vs. S(50-150 keV) plot
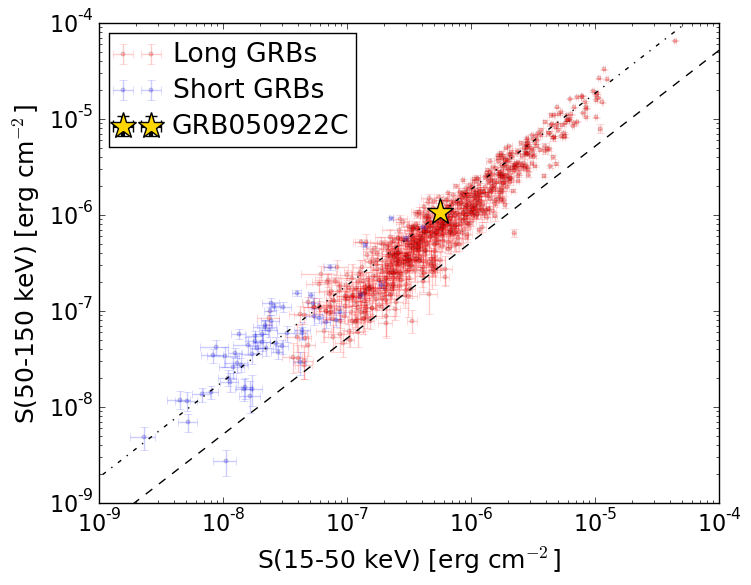
S(15-50 keV)  = 5.589383e-07
S(50-150 keV) = 1.0652844e-06
The dash-dotted line and the dashed line traces the fluences calculated from the Band function with Epeak = 15 and 150 keV, respectively. Both lines assume a canonical values of alpha = -1 and beta = -2.5.
Mask shadow pattern
IMX = -6.420951896159968E-01, IMY = -2.484374243543705E-01
Spacecraft aspect plot
Bright source in the pre-burst/pre-slew/post-slew images
Pre-burst image of 15-350 keV band
Time interval of the image:
-51.843410 -3.316000

# RAcent  DECcent POSerr Theta    Phi  PeakCts   SNR AngSep     Name
#  [deg]    [deg]    ['] [deg]  [deg]                   [']
288.8513  11.0461    7.8  47.5 -150.8   0.2107   1.5    6.8	GRS 1915+105
299.6241  35.2224    0.9  36.8 -114.8   1.5580  12.3    2.1	Cyg X-1
307.9639  40.8999    4.7  33.0 -101.1   0.2546   2.4    7.3	Cyg X-3
325.9388  38.3711    8.9  21.3  -83.5   0.0962   1.3   11.4	Cyg X-2
 23.8111   4.4776    2.4  47.6   44.4   1.3237   4.8 ------	UNKNOWN
303.3412 -23.4899    2.4  54.4  161.3   1.6638   4.9 ------	UNKNOWN
340.5935  36.8177    2.0  17.5  -49.6   0.3582   5.7 ------	UNKNOWN
Pre-slew background subtracted image of 15-350 keV band
Time interval of the image:
-3.316000 3.484000

# RAcent  DECcent POSerr Theta    Phi  PeakCts   SNR AngSep     Name
#  [deg]    [deg]    ['] [deg]  [deg]                   [']
288.8074  11.1652    0.0  47.5 -150.6  -0.0604  -0.8   13.2	GRS 1915+105
299.7005  35.2618    9.7  36.7 -114.7   0.0713   1.2    6.5	Cyg X-1
308.2089  40.8109    6.1  32.8 -101.1  -0.1028  -1.9    9.6	Cyg X-3
325.9115  38.3548    0.0  21.3  -83.5  -0.0969  -2.7   12.4	Cyg X-2
335.9986  -3.3706    2.1  23.0  125.9   0.2083   5.4 ------	UNKNOWN
317.3872  -8.7625    0.2  34.5  158.8   2.5092  52.8 ------	UNKNOWN
291.2812 -15.1650    3.1  57.2  178.1   0.8184   3.8 ------	UNKNOWN
289.1272 -12.3933    2.1  57.3 -177.8   1.0875   5.5 ------	UNKNOWN
Post-slew image of 15-350 keV band
Time interval of the image:
94.756600 302.973400

# RAcent  DECcent POSerr Theta    Phi  PeakCts   SNR AngSep     Name
#  [deg]    [deg]    ['] [deg]  [deg]                   [']
285.0209 -25.0044    7.1  34.8 -112.4   0.4187   1.6    5.1	HT1900.1-2455
288.8113  10.9722    1.1  34.6  -46.3   2.1981  10.5    1.8	GRS 1915+105
299.5849  35.2084    0.5  47.1  -10.5   6.7223  23.6    0.5	Cyg X-1
308.0889  40.9687    3.2  50.5    0.4   1.3054   3.6    1.4	Cyg X-3
326.1954  38.3508   22.7  47.8   18.8   0.2055   0.5    2.1	Cyg X-2
336.2902  34.1671    2.7  46.5   31.2   1.7465   4.3 ------	UNKNOWN
308.4031  25.2698    3.5  35.1   -4.7   0.6036   3.3 ------	UNKNOWN
301.1025  35.2884    2.2  46.6   -8.9   1.3735   5.2 ------	UNKNOWN
302.7724 -31.4891    2.7  26.5 -141.8   0.6633   4.3 ------	UNKNOWN
291.5370 -20.2617    2.6  27.4 -108.2   0.8122   4.5 ------	UNKNOWN
278.0801 -49.1705    2.8  52.0 -138.9   3.2274   4.1 ------	UNKNOWN