Analysis Summary
Notes:
- 1) No attempt has been made to eliminate the non-significant decimal places.
- 2) This batgrbproduct analysis is done using the HEASARC data.
- 3) This batgrbproduct analysis is using the flight position for the mask-weighting calculation.
======================================================================
BAT GRB EVENT DATA PROCESSING REPORT
Process Script Ver: batgrbproduct v2.46
Process Start Time: Wed Jan 22 19:58:25 EST 2014
Host Name: batevent1
Current Working Dir: /local/data/batevent/batevent_reproc/trigger157870
======================================================================
Trigger: 00157870 Segment: 000
BAT Trigger Time: 149857896 [s; MET]
Trigger Stop: 149857960 [s; MET]
UTC: 2005-10-01T11:11:36.241320 [includes UTCF correction]
Where From?: TDRSS position message
BAT
RA: 350.972781554212 Dec: -31.5278427417636 [deg; J2000]
Catalogged Source?: NO
Point Source?: YES
GRB Indicated?: YES [ by BAT flight software ]
Image S/N Ratio: 7.29
Image Trigger?: YES
Rate S/N Ratio: 0 [ if not an image trigger ]
Image S/N Ratio: 7.29
Analysis Position: [ source = BAT ]
RA: 350.972781554212 Dec: -31.5278427417636 [deg; J2000]
Refined Position: [ source = BAT pre-slew burst ]
RA: 350.974297625128 Dec: -31.5187005705944 [deg; J2000]
{ 23h 23m 53.8s , -31d 31' 07.3" }
+/- 2.37062373601689 [arcmin] (estimated 90% radius based on SNR)
+/- 1.36604069351936 [arcmin] (formal 1-sigma fit error)
SNR: 8.86339979776763
Angular difference between the analysis and refined position is 0.553984 arcmin
Partial Coding Fraction: 0.7421875 [ including projection effects ]
Duration
T90: 190.260000020266 +/- 22.8599314077769
Measured from: -11.8959999978542
to: 178.364000022411 [s; relative to TRIGTIME]
T50: 101.852000027895 +/- 36.0743244098844
Measured from: 50.6559999883175
to: 152.508000016212 [s; relative to TRIGTIME]
Fluence
Peak Flux (peak 1 second)
Measured from: 130.423999994993
to: 131.423999994993 [s; relative to TRIGTIME]
Total Fluence
Measured from: -25.4799999892712
to: 199.243999987841 [s; relative to TRIGTIME]
Band 1 Band 2 Band 3 Band 4
15-25 25-50 50-100 100-350 keV
Total 1.378247 1.301621 0.688249 0.045285
0.075647 0.078518 0.068673 0.061173 [error]
Peak 0.021322 0.022156 0.017237 0.003851
0.004540 0.004751 0.004202 0.003568 [error]
[ fluence units of on-axis counts / fully illuminated detector ]
======================================================================
====== Table of the duration information =============================
Value tstart tstop
T100 224.724 -25.480 199.244
T90 190.260 -11.896 178.364
T50 101.852 50.656 152.508
Peak 1.000 130.424 131.424
====== Spectral Analysis Summary =====================================
Model : spectral model: simple power-law (PL) and cutoff power-law (CPL)
Ph_index : photon index: E^{Ph_index}
Ph_90err : 90% error of the photon index
Epeak : Epeak in keV
Epeak_90err: 90% error of Epeak
Norm : normalization at 50 keV in both the PL model and CPL model
Nomr_90err : 90% error of the normalization
chi2 : Chi-Squared
dof : degree of freedo
=== Time-averaged spectral analysis ===
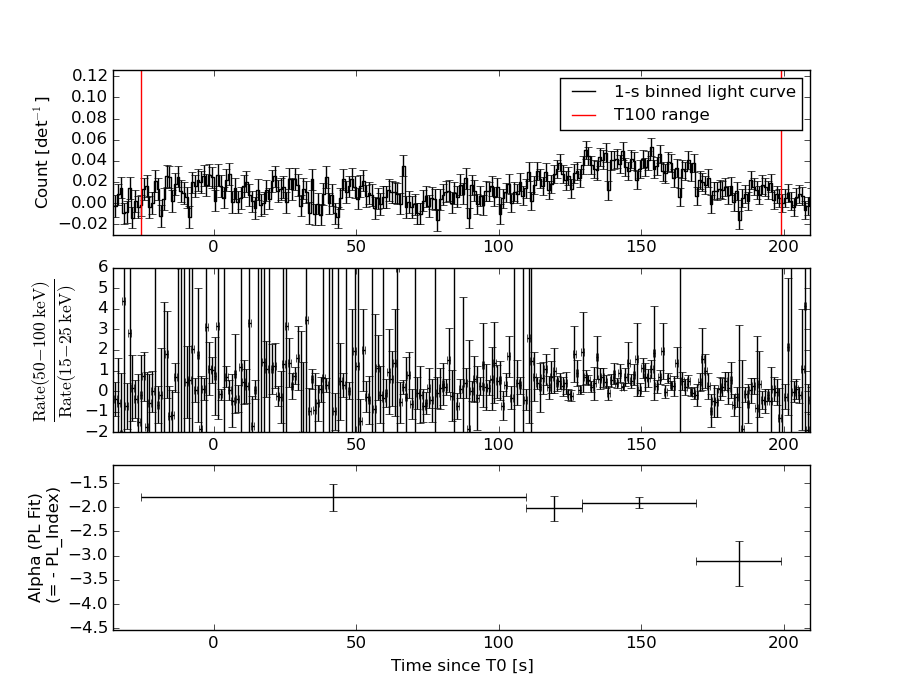
(Best model with acceptable fit: PL)
Model Ph_index Ph_90err_low Ph_90err_hi Epeak Epeak_90err_low Epeak_90err_hi Norm Nomr_90err_low Norm_90err_hi chi2 dof
PL -2.021 -0.141 0.136 - - - 8.50e-04 -7.57e-05 7.45e-05 68.740 57
CPL -1.628 -0.511 0.582 39.907 -31.383 -39.907 1.42e-03 -6.77e-04 1.61e-03 67.050 56
=== 1-s peak spectral analysis ===
(Best model with acceptable fit: PL)
Model Ph_index Ph_90err_low Ph_90err_hi Epeak Epeak_90err_low Epeak_90err_hi Norm Nomr_90err_low Norm_90err_hi chi2 dof
PL -1.552 -0.385 0.366 - - - 3.77e-03 -9.10e-04 8.87e-04 54.310 57
CPL -0.457 -1.622 2.510 64.961 -19.471 -64.961 1.47e-02 -1.47e-02 2.93e-01 53.000 56
=== Fluence/Peak Flux Summary ===
Model Band1 Band2 Band3 Band4 Band5 Total
15-25 25-50 50-100 100-350 15-150 15-350 keV
Fluence PL 3.99e-07 5.34e-07 5.26e-07 9.32e-07 1.76e-06 2.39e-06 erg/cm2
90%_error_low -4.04e-08 -3.71e-08 -6.46e-08 -2.11e-07 -1.46e-07 -2.84e-07 erg/cm2
90%_error_hi 4.13e-08 3.71e-08 6.56e-08 2.50e-07 1.48e-07 3.14e-07 erg/cm2
Peak flux PL 1.63e-01 1.59e-01 1.09e-01 1.16e-01 4.78e-01 5.48e-01 ph/cm2/s
90%_error_low -5.29e-02 -3.55e-02 -3.30e-02 -5.71e-02 -1.04e-01 -1.24e-01 ph/cm2/s
90%_error_hi 5.69e-02 3.53e-02 3.30e-02 8.27e-02 1.04e-01 1.27e-01 ph/cm2/s
Fluence CPL 3.83e-07 5.58e-07 5.17e-07 4.63e-07 1.69e-06 1.92e-06 erg/cm2
90%_error_low -4.58e-08 -4.79e-08 -7.24e-08 -2.64e-07 -1.70e-07 -3.26e-07 erg/cm2
90%_error_hi 4.59e-08 4.89e-08 7.03e-08 6.88e-07 1.76e-07 7.23e-07 erg/cm2
Peak flux CPL 1.41e-01 1.79e-01 1.14e-01 3.63e-02 4.60e-01 4.70e-01 ph/cm2/s
90%_error_low -6.57e-02 -4.59e-02 -3.92e-02 -3.63e-02 -1.08e-01 -1.16e-01 ph/cm2/s
90%_error_hi 6.63e-02 5.00e-02 3.88e-02 1.04e-01 1.08e-01 1.55e-01 ph/cm2/s
======================================================================
Image
Pre-slew 15.0-350.0 keV image (Event data)
#   RAcent    DECcent   POSerr    Theta     Phi              Peak Cts       SNR   Name
  350.9743   -31.5187   0.0217    29.3303    13.3100         1.0543590      8.863 TRIG_00157870

Foreground time interval of the image:
-25.480  72.301 (delta_t =  97.781 [sec])
Background time interval of the image:
-299.000 -25.480 (delta_t = 273.520 [sec])
Light Curves
Note: The mask-weighted lightcurves have units of either count/det or counts/sec/det, where a det is 0.4 x 0.4 = 0.16 sq cm.
Full-time range; 1 s binning
Other quick-look light curves:
- 64 ms binning (zoomed)
- 16 ms binning (zoomed)
- 8 ms binning (zoomed)
- 2 ms binning (zoomed)
- SN=5 or 10 s binning (full-time range)
- Raw light curve
Spectra
- 64 ms binning (zoomed)
- 16 ms binning (zoomed)
- 8 ms binning (zoomed)
- 2 ms binning (zoomed)
- SN=5 or 10 s binning (full-time range)
- Raw light curve
Spectra
Notes:
- 1) The fitting includes the systematic errors.
- 2) When the burst includes telescope slew time periods, the fitting uses an average response file made from multiple 5-s response files through out the slew time plus single time preiod for the non-slew times, and weighted by the total counts in the corresponding time period using addrmf. An average response file is needed becuase a spectral fit using the pre-slew DRM will introduce some errors in both a spectral shape and a normalization if the PHA file contains a lot of the slew/post-slew time interval.
- 3) For fits to more complicated models (e.g. a power-law over a cutoff power-law), the BAT team has decided to require a chi-square improvement of more than 6 for each extra dof.
Time averaged spectrum fit using the average DRM
Power-law model
Time interval is from  -25.480 sec. to  199.244 sec.

Spectral model in power-law:
------------------------------------------------------------
Parameters  : value       lower 90%   higher 90%
Photon index: -2.0208     ( -0.140673   0.135823 )
Norm@50keV  : 8.49821E-04    ( -7.57423e-05   7.45265e-05 )
------------------------------------------------------------
#Fit statistic : Chi-Squared =          68.74 using 59 PHA bins.
# Reduced chi-squared =          1.206 for     57 degrees of freedom
# Null hypothesis probability =   1.371177e-01

Photon flux (15-150 keV)    in 224.7 sec: 0.128718 ( -0.008981  0.008986 ) ph/cm2/s
Energy fluence (15-150 keV)             : 1.76337e-06 ( -1.45613e-07  1.48037e-07 ) ergs/cm2
Cutoff power-law model
Time interval is from  -25.480 sec. to  199.244 sec.
Spectral model in the cutoff power-law:
------------------------------------------------------------
Parameters  : value       lower 90%   higher 90%
Photon index: -1.62753     ( -0.511185   0.582482 )
Epeak [keV] : 39.9066      ( -31.3828 -39.9064 )
Norm@50keV  : 1.42431E-03    ( -0.000677368   0.00160562 )
------------------------------------------------------------
#Fit statistic : Chi-Squared =          67.05 using 59 PHA bins.
# Reduced chi-squared =          1.197 for     56 degrees of freedom
# Null hypothesis probability =   1.480463e-01

Photon flux (15-150 keV)    in 224.7 sec: 0.126230 ( -0.009527  0.009529 ) ph/cm2/s
Energy fluence (15-150 keV)             : 1.68804e-06 ( -1.69757e-07  1.75647e-07 ) ergs/cm2
1-s peak spectrum fit
Power-law model
Time interval is from  130.424 sec. to  131.424 sec.

Spectral model in power-law:
------------------------------------------------------------
Parameters  : value       lower 90%   higher 90%
Photon index: -1.55229     ( -0.385264   0.365846 )
Norm@50keV  : 3.77340E-03    ( -0.000909807   0.000887102 )
------------------------------------------------------------
#Fit statistic : Chi-Squared =          54.31 using 59 PHA bins.
# Reduced chi-squared =         0.9527 for     57 degrees of freedom
# Null hypothesis probability =   5.767594e-01

Photon flux (15-150 keV)    in 1 sec: 0.478022 ( -0.104379  0.104411 ) ph/cm2/s
Energy fluence (15-150 keV)             : 3.55165e-08 ( -9.13132e-09  9.43353e-09 ) ergs/cm2
Cutoff power-law model
Time interval is from  130.424 sec. to  131.424 sec.
Spectral model in the cutoff power-law:
------------------------------------------------------------
Parameters  : value       lower 90%   higher 90%
Photon index: -0.456843     ( -1.62616   2.50568 )
Epeak [keV] : 64.9606      ( -19.399 -64.8889 )
Norm@50keV  : 1.46802E-02    ( -0.0147695   0.29329 )
------------------------------------------------------------
#Fit statistic : Chi-Squared =          53.00 using 59 PHA bins.
# Reduced chi-squared =         0.9465 for     56 degrees of freedom
# Null hypothesis probability =   5.890607e-01

Photon flux (15-150 keV)    in 1 sec: 0.460461 ( -0.108274  0.107835 ) ph/cm2/s
Energy fluence (15-150 keV)             : 3.23407e-08 ( -9.36705e-09  1.04698e-08 ) ergs/cm2
Time-resolved spectra
Distribution
T90 vs. Hardness ratio plot
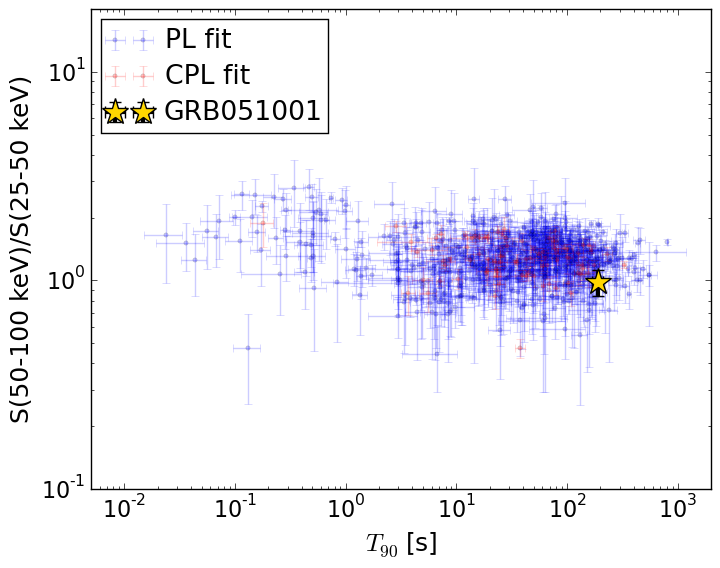
T90                                   = 190.26 sec.
Hardness ratio (energy fluence ratio) = 0.985734472428
S(15-50 keV) vs. S(50-150 keV) plot
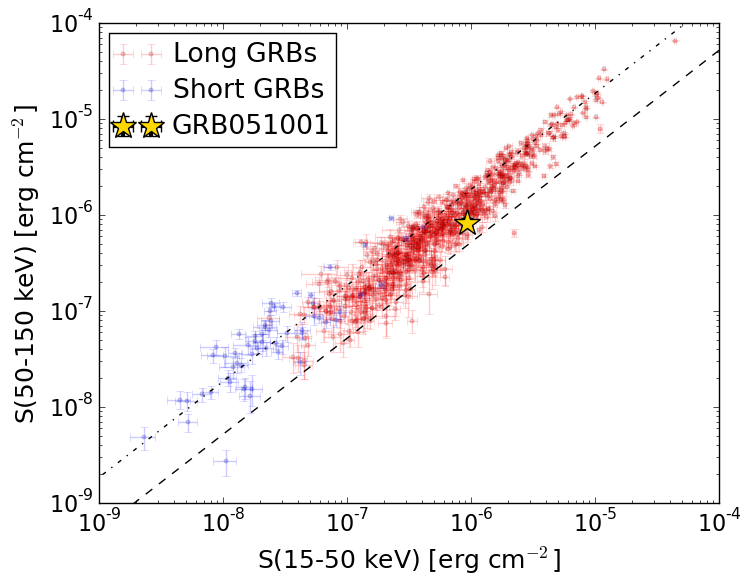
S(15-50 keV)  = 9.325648e-07
S(50-150 keV) = 8.308096e-07
The dash-dotted line and the dashed line traces the fluences calculated from the Band function with Epeak = 15 and 150 keV, respectively. Both lines assume a canonical values of alpha = -1 and beta = -2.5.
Mask shadow pattern
IMX = 5.467758537644792E-01, IMY = -1.293527451924378E-01
Spacecraft aspect plot
Bright source in the pre-burst/pre-slew/post-slew images
Pre-burst image of 15-350 keV band
Time interval of the image:
-299.000000 -25.480000

# RAcent  DECcent POSerr Theta    Phi  PeakCts   SNR AngSep     Name
#  [deg]    [deg]    ['] [deg]  [deg]                   [']
350.8389 -39.5538    2.5  36.5    6.4   0.9651   4.6 ------	UNKNOWN
  0.8212 -36.9848    2.9  31.6   -5.5   0.7982   3.9 ------	UNKNOWN
 13.0578 -42.2686    2.7  37.1  -22.0   0.9348   4.3 ------	UNKNOWN
 40.8210 -27.1501    3.1  39.6  -66.4   1.8031   3.7 ------	UNKNOWN
 41.8249 -20.6756    2.7  38.0  -76.5   2.1168   4.2 ------	UNKNOWN
Pre-slew background subtracted image of 15-350 keV band
Time interval of the image:
-25.480000 72.300590

# RAcent  DECcent POSerr Theta    Phi  PeakCts   SNR AngSep     Name
#  [deg]    [deg]    ['] [deg]  [deg]                   [']
350.9743 -31.5187    1.3  29.3   13.3   1.0542   8.9 ------	UNKNOWN
 19.9300 -61.5839    2.6  56.9  -21.1   1.9296   4.4 ------	UNKNOWN
Post-slew image of 15-350 keV band
Time interval of the image:
172.300600 303.060000

# RAcent  DECcent POSerr Theta    Phi  PeakCts   SNR AngSep     Name
#  [deg]    [deg]    ['] [deg]  [deg]                   [']
350.9512 -31.5018    2.0   0.0 -132.3   0.6112   5.7 ------	UNKNOWN
 50.2453 -59.0482    2.9  47.8 -154.2   0.8981   4.0 ------	UNKNOWN
321.9845 -54.4803    2.2  30.9  -84.3   0.8851   5.2 ------	UNKNOWN